Abstract—The structure-borne noise of the bridge is an environmental pollution in the city. In this paper, the vibration and sound radiation of the highway bridge are analyzed by numerical method, experimental verification is carried out, and the optimization measures are proposed. Firstly, the finite element method for the vibration of the hinged-beam bridge under the action of vehicle is proposed. Secondly, the boundary element method is used to calculate the acoustic radiation caused by the structural vibration of the bridge. Thirdly, the reliability of the above computational method is verified by the experiment on a practical bridge. Finally, the measures to control the vibration and noise of bridge are proposed, and the effects are evaluated numerically based on the current method. The results show that strengthening the lateral connection of beams in bridge and reducing the roughness of bridge deck are effective ways to decrease the structure-borne noise of bridge.
Index Terms—Highway bridge, vibration, structure-borne noise, finite element method, boundary element method.
I. INTRODUCTION
When the vehicle travels through the bridge, it will arouse vibration and structure-borne low-frequency noise of the bridge. This noise has become an important part of environmental pollution, that not only harms the health of residents around the bridge [1], [2], but also affects the survival and reproduction of wild animals [3]. Therefore, it is necessary to analyze the mechanism of vibration and noise of the bridge structure and try to reduce this noise.
Many studies have been performed on the vibration and noise radiation of bridge structures. Goromaru et al. [4] studied the vibration and low-frequency noise of a simple truss structure under a simple vehicle model. Bewes [5] used the Statistical Energy Method (SEA) to calculate the railway bridge noise, in which the predicted noise above 200 Hz agrees with the measurement, but that below 200 Hz has a large deviation. Au et al. [6] presented a theoretical solution to analyze the acoustic radiation of simple bridge structure under moving loads. The above work shows that the theoretical solution of structure-borne noise is not suitable for complex structures, and the statistical energy method is fitted for the prediction of low-frequency noise of bridge.
In recent years, Song et al. [7] analyzed structural noise of urban-rail-transit bridges by using finite element method
Manuscript received February 25, 2019; revised April 23, 2019. This work was supported by National Natural Science Foundation of China (51808301); Natural Science Foundation of Zhejiang Provincial (LY19E080009), and Ningbo Transportation Technology Project (201604).
Pei Wang and Yong Ding are with the Department of Civil Engineering, Ningbo University, China (e-mail: [email protected], [email protected]).
(FEM) for structural vibration, and boundary element method (BEM) for structure-borne noise. Li et al. [8] and Zhang et al. [9] also used these methods to calculate the structure-borne noise of high-speed railway bridges. Their calculations were in good agreement with the experimental results. The above works are all for railway bridges, and the computational research for highway bridges is rare [10]. There are much more highway bridges than railway bridges. The noise of highway bridges in cities has a greater impact on the surrounding people. Therefore, it is necessary to study and analyze the vibration and noise of highway bridges.
With these background in mind, the vehicle-induced vibration and structure-borne sound radiation of hinged-beam bridge, a typical highway bridge, are analyzed by computing. The results are verified by the experiment. By using the numerical simulation, the ways to reduce the vehicle-induced vibration of bridge and structure-borne noise of highway bridges are discussed.
II. FINITE ELEMENT METHOD FOR BRIDGE VIBRATION
The finite element method is adopted for the analysis of bridge vibration. Not only the bridge, but also the vehicle is modeled by FEM, that makes the analytical system flexible. The finite element model of the vehicle-bridge system is shown in Fig. 1.
5 8
3
1 9
11
15 17
21 23
13 19
h
1
z
y m2 m4 m5
l1 l2
l3 l4
h
2
h
3
m1, Jx1, Jz1
m3, Jx3
k1 c1 k2 c2
k3 c3 k4 c4 k5 c5 k6 c6
A beam i B
v
L
(a) Side view.
z
x
y
1 2
3 4
5 6 7
8
9 10
11
12 13
15 16
17 18
19 20
21
22 23
24 25
l5
v
14
A beam i
beam j
B
(b) Perspective view
Fig. 1. FEM model of vehicle-bridge system.
Optimization of Vehicle-Induced Vibration and
Structure-borne Noise of Bridge Based on Computing
The vehicle is a typical three-axle truck [11], and the finite element model consists of 37 elements, of which 6 distributed spring-damper elements [11] in contact with the bridge represent tires, others are ordinary spring-damper element, concentrated mass element and rigid beam element [12]. The parameters of the vehicle model are shown in Table I.
TABLEI:PARAMETERS OF THE VEHICLE [11]
m1(Kg) 27507 k1(kN/m) 1200 c1(kN.s/m) 6.0 m2(Kg) 359.5 k2(kN/m) 2400 c2(kN.s/m) 10.0 m3(Kg) 160 k3(kN/m) 2200 c3(kN.s/m) 12.0 m4(Kg) 542.5 k4(kN/m) 4800 c4(kN.s/m) 20.0 m5(Kg) 595.5 k5(kN/m) 2200 c5(kN.s/m) 12.0 l1(m) 1.3 k6(kN/m) 4800 c6(kN.s/m) 20.0 l2(m) 3.5 Jx1(Kg.m2) 69200 h1(m) 0.43 l3(m) 0.65 Jz1(Kg.m2) 19600 h2(m) 1.77 l4(m) 0.91 Jx3(Kg.m2) 22.6 h3(m) 0.7
l5(m) 1.8
After assembling, the global finite element equation for the vehicle is obtained.
( )
v v+ v v+ v v= v t
M u C u K u F (2)
where uv, uv, uv are the nodal acceleration, velocity and displacement vectors of vehicle model, respectively; Mv, Cv
and Kv are the mass, damping and stiffness matrices,
respectively; Fv is the load vector for the vehicle at time t.
The bridge is a hinged-beam bridge, the finite element model of which are shown in Fig. 1. The Euler-Bernoulli beam element is adopted for the bridge model, on which the load of the vehicle is applied. The hinge node is used to connect the adjacent beams of bridge. The hinge node can transmit force, but can’t transmit bending moment. The global finite element equation for the bridge is
( )
tMu + Cu + Ku = P (3)
where u, uand u are the nodal acceleration, velocity and displacement vectors of bridge model, respectively; M, C and K are global mass, damping and stiffness matrices, respectively; and P is the load vector resulting from vehicle tires, in which the load from a single tire is
( ) ( )
r B A B A
P =k u −u +c u −u (4)
where k and c are stiffness and damper of the vehicle tire, respectively; uA and uB are displacements of the axis and
bottom of the vehicle tire, respectively; uA and uBare the
velocity of the axis and bottom of the vehicle tire, respectively. In view of the coupling effect in vehicle-bridge interaction system, the vibration of the bridge is derived by an iterative procedure [14].
Considering the influence of the roughness of bridge deck on the vibration of vehicle and bridge, the uneven bridge deck is adopted, and the random surface roughness, r x
( )
, is described by a zero-mean stationary Gaussian process as [15]( )
cos 2(
)
n
k k k
k=1
r x =
a Ω x+ (5)where k is random phase angle with uniform probability
distribution in the interval
0 2,
, which could be generated by Monte Carlo method; x is the global coordinate along the longitudinal axis of the bridge; n is the total number of terms to build up the bridge surface roughness; other parameters are defined as( )
2k k
a = S Ω Ω (6)
u l
Ω Ω
Ω n −
= (7) 1
, 1, 2, ,
2
k l
Ω =Ω +k− Ω k= n
(8)
in which S Ω
( )
k is the Power Spectral Density function (PSD),and Ω1 and Ωu are the lower and upper cut-off frequency,
respectively.
As shown in Fig. 2, three PSD functions are adopted in this paper, in which curve ‘A’ represents smooth road surface [16], the PSD of curve ‘B’ and ‘C’ are 30 and 100 times that of the curve ‘A’, respectively. According to the PSD curves, the surface profiles of bridge deck in Fig. 3 are generated. The following parameters are used in calculation: Ωl=0, Ωu=6,
and n=2500.
0.00 0.01 0.10 1.00 10.00
10-10 10-8 10-6 10-4 10-2 100 102 104
best worst
S
(
)
(
m
3 )
(m-1) PSD in ISO 8606 [16]
A B C
Fig. 2. PSD curve of the bridge surface.
0 5 10 15 20 25 30 35
-25 -20 -15 -10 -5 0 5 10 15 20 25
Su
rfa
ce
pro
file (mm)
x (m) A
B C
Fig. 3 Bridge surface profile.
III. BOUNDARY ELEMENT METHOD FOR BRIDGE NOISE
2
( )
2( )
0 p t c p− t
x, − x, = (9)
wherep is sound pressure, x is coordinate vector, and c is the velocity of the sound wave in the air. The equations of initial condition for sound field analysis are
( )
0 0p x, = ,p
( )
0 =0 x
n ,
(10)
The equations of boundary condition are
( )
n
p t v
= −
x
n ,
(11)
where n is external normal vector of the outer surface of the bridge, vn is the normal vibration velocity of the outer
surface of the bridge from the vibration analysis in section II, and is the density of the air.
Introducing the basic solution of the point sound source, rewriting the equations (9-11) into the equivalent integral form, and then discretizing the outer surface of bridge in the spatial domain, the boundary integral equation for the structure-borne sound radiation of bridge is derived [17]. For the analysis of sound radiation of hinged-beam bridge, the mesh of the boundary element model is not closed. So that the indirect boundary element method is applied, and the sound pressure, p, at any point in the sound field around the bridge is obtained.
In this paper, the sound radiation of bridge is calculated by boundary element method using Virtual Lab Acoustics which is commonly used in acoustic analysis. To ensure the accuracy of calculation, each wavelength of sound should contains at least 6 linear boundary elements. When the frequency of the sound radiation is 100 Hz, the wavelength is 3.4 m. In order to calculate the low-frequency noise of 0-100Hz accurately, the side length of the mesh in vibration analysis by FEM and acoustic analysis by BEM should be less than 0.55 m.
IV. NUMERICAL EXAMPLES AND PARAMETER ANALYSIS
As shown in Fig. 4, the three-axle truck passes a hinged-beam bridge at a speed of 24km/h (6.6m/s). The left and right wheels of the truck are applied on beam 12 and 14, respectively. Numerical calculation and field experiment were carried out on the vibration and noise of the bridge.
Simply supported bridges
20 m 20 m 20 m 20 m
Span 1 Span 2 Span 3 Span 4 (Test span)
(a) Side view
12.25m 3.25m 4.25m
1
.5
~
2
.1
m
0
.8
m
Sound pressure test Deflection test
A B
1 2 3 4 5 6 7 8 9 10 11 12 13 14 15 16 17 18
C
(b) Cross section.
(c)Photo in experiment.
Fig. 4. Experiment of vibration and sound radiation of a typical hinged-beam bridge.
The measuring point is arranged under span 4 in Fig. 4(a). Transient deflection and sound pressure are measured in Fig. 4 (b,c), while electro-mechanical displacement meter and sound pressure sensor are used for vibration and sound measurement, respectively. In order to minimize the impact of surrounding environment, the experiment was carried out in quiet midnight without wind.
The parameters of the truck in experiment are shown in Table I. The bridge consists of 18 1m-wide prefabricated hollow beam. The parameters of each beam are shown in Table I. The damping of the bridge is Rayleigh damping, and the damping ratio of the first and second modes is 0.02 [13].
TABLEII:PARAMETERS OF A SINGLE BRIDGE BEAM Elastic modulus(GPa) 34.5 Cross section Area (m2) 0.86 Shear modulus (GPa) 14.4 Beam length (m) 19.3 Moment of inertia (m4) 0.067 Density ( 3
kg m ) 2500
A. Vibration Analysis
The vehicle-bridge coupled vibration of the truck through the bridge in Fig. 4 is calculated by the method proposed in section II. The finite element model of the hinged-beam bridge is established. Because the lateral connection between the beam 16 and beam 17 is weak, the finite element model only consists beams 1-16. Every beam is divided into 40 beam elements longitudinally, and the length of which is 0.5m. As discussed in Section III, low-frequency vibration and noise of 0-100Hz can be calculated accurately.
Fig. 5 shows the deflection of the truck passed through the middle of span 4. Fig. 6 shows the calculated mid-span transient deflection, Fig. 7 shows the measured one, and they are similar with each other, that indicate the reliability the current method for predicting the dynamic deflection of the hinged-beam bridge. The maximum calculated deflection is larger than the measured one by 15%, and the error may come from that the stiffness of the calculated model is slightly smaller than that of the actual structure and there is some slippage on the top of the electro-mechanical displacement meter.
1
6
11
160
5 10
15 0.0 0.5 1.0 1.5 2.0
Deflection (mm)
coor dinate
(m) Beam n
um ber
0.000
0.4000
0.8000
1.200
1.600
2.000
0 1 2 3 4 5 0.0
0.4 0.8 1.2 1.6 2.0
Deflection (mm)
Time (s)
Beam 2 Beam 6 Beam 10 Beam 12 Beam 14 Beam 16
Fig. 6. The calculated middle-span deflection of the span 4.
0 1 2 3 4 5
0.0 0.4 0.8 1.2 1.6 2.0
Beam 15 Beam 16
Time (s)
Deflection (mm)
Fig.7. The measured middle-span deflection of the span 4.
Because the acoustic radiation is directly related to the vibration of the bridge deck, the mid-span vibration velocities of the beams 6, 10 and 14 are shown in Fig. 8.
0 1 2 3 4 5
-6 -4 -2 0 2 4 6 8
Vibr
ation
velocity
(mm/s)
Time (s) Beam 6 Beam 10 Beam 14
Fig. 8. The calculated middle-span velocity of the span 4.
B. Sound Radiation Analysis
In structure-borne sound radiation analysis, boundary element method in section III is adopted, in which the mesh of the hinged-beam bridge is shown in Figure 9. The triangular element is used in the mesh, and the maximum edge is 0.493m, so that the upper limit of the frequency in calculated acoustic radiation is about 115Hz.
Fig. 9. BEM grid for the calculation of bridge sound radiation.
The dynamic deflection obtained from the vibration analysis is introduced into the acoustic analysis as boundary input, and the sound pressure at any point around the bridge can be obtained. Taking the sound pressure at the point C in Fig. 4(b) as an example, the sound pressure history while the
truck running through the hinged-beam bridge is shown in Fig.
10, and the computational result are generally agree with the measured one.
0 1 2 3 4 5
-4 -3 -2 -1 0 1 2 3 4
Sound pressur
e (Pa)
Time (s) (a) Computational result
12 13 14 15 16
-4 -3 -2 -1 0 1 2 3 4
Sou
nd
pressu
re (Pa)
Time (s) (b) Measured result
Fig. 10. History of sound pressure of point C under the bridge.
When the truck traveled on the mid-span of the span 4 of the bridge, the sound field around the bridge is calculated and shown in Fig. 11. The result shows that the sound pressure under the bridge is larger than that on the bridge because of the reflection of the ground under the bridge. The sound pressure under the beam applied by the truck tire is more significant and the maximum value is 3.6 Pa. It should be noted that the above sound pressure only comes from the bridge structure, and that from the truck and road is not considered.
Fig. 11. The structure-borne sound field of the practical bridge.
C. Main Factors Affecting Structure-Borne Noise
Two factors affecting structure-borne noise, the roughness of bridge deck and lateral-connection stiffness between adjacent beams, are discussed in the following numerical examples.
the bridge structure.
0 1 2 3 4 5
0.0 0.5 1.0 1.5 2.0 2.5
Time (s)
Mid-span
deflection
(mm
) Surface profile 'A'
Surface profile 'B' Surface profile 'C'
(a) Mid-span deflection of beam 16
0 1 2 3 4 5
-10 -5 0 5 10
Mid
-span v
elocity
(mm
/s)
Time (s)
Surface profile 'A' Surface profile 'B' Surface profile 'C'
(b) Mid-span velocity of beam 16
0 1 2 3 4 5
-6 -4 -2 0 2 4 6
Time (s)
Sound pr
ess
ure
(Pa)
Surface profile 'A' Surface profile 'B' Surface profile 'C'
(c) Sound pressure at Point C under the bridge Fig. 12. Effect of the roughness of bridge deck.
The lateral connection is the weak part of the hinged-beam bridge, and it is also an important indicator to measure the performance of this bridge [18]. The stronger the lateral connection, the more uniform the vehicle load is shared by the beams of bridge. Conversely, the vehicle load is only borne by the beam directly under the tire.
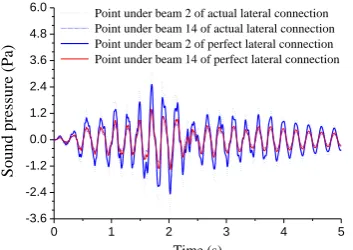
To explore the effect of lateral-connection stiffness between adjacent beams, two kinds of stiffness are considered. The first is the actual lateral-connection stiffness of practical bridge, while the beam under tire bears more load than the other beams away from the tire. The second is the perfect lateral-connection stiffness, while all the beams of the bridge bear the vehicle load evenly. When the truck travels through the bridge with this two lateral-connection stiffness respectively, the vibration and structure-borne sound are computed and shown in Fig. 13. It indicates that the better the lateral connection of the bridge, the smaller the difference in vibration between the beams of bridge, and the smaller the variation of the sound pressure under the bridge.
Fig. 14 shows the sound field around the bridge when the lateral connection is pefect. Compared with the sound field of the actual bridge in Fig. 11, the maximum sound pressure in Fig. 14 is smaller (3.0 Pa), and the sound pressure vibration under the bridge is also smaller. It indicates that the
structure-borne noise can be reduced by strengthening the lateral connection between the beams of bridge. Conversely, when the lateral connection between the beams is weak or damaged, the sound pressure under the bridge will be increased, same as the variation of the sound pressure under the bridge.
0 1 2 3 4 5
0.0 0.5 1.0 1.5 2.0 2.5 3.0
Time (s)
Deflection (
mm)
Beam 14 of actual lateral connection Beam 8 of actual lateral connection Beam 2 of actual lateral connection Each beam of perfect lateral connection
(a) Effect of lateral connection on the mid-span deflection
0 1 2 3 4 5
-6 -4 -2 0 2 4 6 8
10 Beam 14 of actual lateral connection
Beam 8 of actual lateral connection Beam 2 of actual lateral connection Each beam of perfect lateral connection
Time (s)
Vibration
velocity (m
m/s)
(b) Effect of lateral connection on the mid-span velocity
0 1 2 3 4 5
-3.6 -2.4 -1.2 0.0 1.2 2.4 3.6 4.8
6.0 Point under beam 2 of actual lateral connection
Point under beam 14 of actual lateral connection Point under beam 2 of perfect lateral connection Point under beam 14 of perfect lateral connection
Sound pr
ess
ure
(Pa)
Time (s)
(c) Effect of lateral connection on the mid-span sound pressure Fig. 13. Effect of the lateral connection between beams of bridge on the
vibration and sound.
Fig. 14. Structure-borne sound field of the hinged-beam bridge with perfect lateral connection.
V. CONCLUSION
experiment.
2) The structure-borne sound pressure under the bridge is usually larger than that on the bridge because of the reflection of ground. The sound radiation in the space under the bridge should be concerned during noise control.
3) The vehicle-induced vibration and structure-borne noise of bridge can be decreased by reducing the surface roughness of the bridge deck.
4) The structure-borne noise can be reduced by strengthening the lateral connection between the beams of bridge. The sound pressure of the bridge will be increased when the lateral connection between the beams is damaged.
REFERENCES
[1] N. Naoko, M. Masanobu, Y. Yasukiyo et al., “Process and emergence on the effects of infrasonic and low frequency noise on inhabitants,” Journal of Low Frequency and Vibration, vol. 8, no. 3, pp. 87-89, 1989.
[2] K. Persson, R. Rylande, S. Benton et al., “Effects on performance and work quality due to low frequency ventilation noise,” Journal of Low Frequency and Vibration, vol. 205, no. 4, pp. 467-474, 1997. [3] M. Foglar and J. Göringer, “Influence of the structural arrangement of
bridges on the noise induced by traffic,” Engineering Structures, vol. 56, no. 20, pp. 642-655, 2013.
[4] H. Goromaru, K. Shiraishi, H. Hara et al., “Analysis of low frequency sound radiating from simple girder highway bridge by a moving vehicle,” Journal of Construction Management and Engineering, vol. 427, no. VI-14, pp. 133-142, 1991.
[5] O. G. Bewes, D. J. Thompson, C. J. C. Jones et al., “Calculation of noise from railway bridges and viaducts: Experimental validation of a rapid calculation model,” Journal of Sound and Vibration, vol. 293, no. 3-5, pp. 933-943, 2006.
[6] F. T. K. Au and M. F. Wang, “Sound radiation from forced vibration of rectangular orthotropic plates under moving loads,” Journal of Sound and Vibration, vol. 281, no. 3-5, pp. 1057-1075, 2005.
[7] X. D. Song, Q. Li, and D. J. Wu, “Prediction and spatial distribution of low-frequency noise radiated from the multi-span bridge,” Engineering Mechanics, vol. 34, no. 3, pp. 22-28, 2017.
[8] X. Z. Li, Q. M. Liu, S. L. Pei et al., “Structure-borne noise of railway composite bridge: Numerical simulation and experimental validation,” Journal of Sound and Vibration, vol. 353, pp. 378-394, 2015. [9] X Zhang, X. Z. Li, H. Hao et al., “A case study of interior
low-frequency noise from box-shaped bridge girders induced by running trains: Its mechanism, prediction and countermeasures,” Journal of Sound and Vibration, vol. 367, no. 8, pp. 129-144, 2016. [10] H. Zhang, X. Xie, J. Q. Jiang et al., “Assessment on transient sound
radiation of a vibrating steel bridge due to traffic loading,” Journal of Sound and Vibration, vol. 336, pp. 132-149, 2015.
[11] Y. Ding, Q. Huang, X. Xie et al., “A computational method for the dynamic load in heavy-vehicle bumping at the bridge expansion joint and the analysis of influencing factors,” China Civil Engineering Journal, vol. 46, no. 7, pp. 98-107, 2013.
[12] O. C. Zienkiewicz and R. L. Taylor, The Finite Element Method, 6th ed., London: McGraw-Hill, 2005.
[13] A. K. Chopra, Dynamics of Structures: Theory and Applications to Earthquake Engineering, 2nd ed., New Jersey: Prentice Hall, 2004. [14] Y. Ding, Z. Y. Bu, X. Xie et al., “Analysis of low-frequency noise
considering the vibration of bridge deck,” Journal of Civil, Architectural and Environmental Engineering, vol. 33, no. 2, pp. 57-64, 2011.
[15] F. T. K. Au, Y. S. Cheng, and Y. K. Cheung, “Effects of random road surface roughness and long-term deflection of prestressed concrete girder and cable-stayed bridges on impact due to moving vehicles,” Computers and Structures, vol. 79, no. 8, pp. 853-872, 2001. [16] Mechanical Vibration - Road Surface Profiles - Reporting of
Measured Data, ISO 8608, 1995.
[17] T. W. Wu. Boundary Element Acoustics: Fundamentals and Computer Codes, Southampton: WIT Press, 2000: 161-193. [18] Q. Wang, Q. X. Wu, B. C. Chen. “Experimental study on failure mode
of hinged joint in assembly voided slab bridge,” Engineering Mechanics, vol. 31, no special, pp. 115-120, 2014.
Pei Wang was born in Hangzhou, China on December 17, 1994. She obtained a bachelor’s degree of engineering in Ningbo University, Ningbo, China in 2017. Now she is a postgraduate student in Ningbo University. Her research interest includes the computational mechanics and its application in civil engineering.
Yong Ding was born in Ningbo, China on March 20, 1975. He obtained a bachelor’s degree of engineering in Tongji University, Shanghai, China in 1997. Then he obtained the master’s degree and doctor’s degree of engineering in Tsinghua University, Beijing, China in 2002.
He worked as a postdoctoral fellow in Hong Kong University of Science and Technology from 2002 to 2004. Then he joined the Department of Civil Engineering, Ningbo University as a research staff. He has published more than 40 papers mainly in the computational mechanics and written a book about elastic mechanics. Now he is a professor in Ningbo University.

![TABLE I: PARAMETERS OF THE VEHICLE [11]](https://thumb-us.123doks.com/thumbv2/123dok_us/1356075.1644438/2.595.325.520.417.676/table-i-parameters-of-the-vehicle.webp)