Harmonic Contribution Analysis of Electric Arc
Furnace by Using Spectrogram
M.H Jopri*, A.R Abdullah*, M Manap**, MR Ab Ghani*, N.H Saleh*
* Center for Robotics and Industrial Automation (CeRIA), Faculty of Electrical Engineering, Universiti Teknikal Malaysia Melaka
** CeRIA, Faculty of Engineering Technology, Universiti Teknikal Malaysia Melaka
Abstract— A fast and accurate detection of the harmonic and interharmonic contribution of electric arc furnace (EAF) is crucial in identifying and to mitigate the undesired effects to the system. In this paper, spectrogram, a fast and accurate technique is introduced for the analysis of the contribution. Based on a rule-based classifier and the threshold settings that referred to the IEEE Standard 1159 2009, the analysis of the harmonic and interharmonic contribution of EAF are carried out successfully. Moreover, the impact of contribution is measured using total harmonic distortion (THD) and total non-harmonic distortion (TnHD). In addition, spectrogram also gives 100 percent correct detection and able to analyze the contribution impact. It is proven that the proposed method is accurate, fast and cost efficient for analyzing the impact of harmonic and interharmonic of EAF. Index Term-- Harmonic, Interharmonic, Spectrogram, Electric Arc Furnace
1. INTRODUCTION
Presently electric arc furnace (EAF) is extensively used in iron and steel industry due to the increase in demand for iron such as in the vehicle industry.[1]. Electric arc furnace is used for melting alloys such as steel at high melting point [2]. Electrical energy is converted into thermal energy by electric arc furnaces during the melting of raw materials. Serious power quality problems occurred during the melting process whereas the random property of arc melting process and the control system are the fundamental reasons of the electrical and thermal dynamics [3]. The EAFs create the power quality issues such as unbalanced voltages and currents, voltage flickers as well as odd and even harmonics caused by the time-variant and non-linear loads [4]. The cause of harmonics is predominantly identified with the non-linear voltage-current characteristic of the arc.
The effect of the harmonic distortion caused several problems in electrical power systems, such as influence operation of devices, non-durable equipment, and increase losses in transmission and distribution networks, overvoltage and overcurrent [2][5][6]. As an EAF is a large source of harmonics, causes voltage-current distortion which is a major power quality issue that influences connected load operation in the electric network. Hence, harmonic analysis of EAF has attracted the attention of researchers to solve these power quality issues pertaining to EAF [7]. Harmonics can be analyzed using frequency, time and time-frequency domain methods [8]. The details of the concept and analytical of these
methods are briefly explained in this paper. There are several signal processing based method approaches have been proposed in harmonic detection analysis in order to assess the power quality issues [9].
For minimizing power quality effect caused by the EAF, there is a need to characterize the behavior of electric arc furnace load [10]. The primary issue in the modeling of electric arc furnace is to define of electrical arc [10][11].There are different numbers of concerning models for EAF based on the Current-Voltage (V-I) characteristic of arc furnace such as hyperbolic, exponential model and the combination of the hyperbolic and exponential model [7][10]. For the modeling of an electrical arc is benefited from the V-I characteristics (VIC) that formed by the electrical arc. The VIC method is widely used for modelling the static and the dynamic operation of EAF [12] and a hyperbolic model of EAF with a good approximation without the need of the initial conditions of the EAF is necessary to be used in the analysis [13][14]. In addition, it is used to describe the different operating situation of the EAF and power system [14].
A frequency-domain analysis method has been introduced called Fourier Transform (FT) [1]. The FT technique is usually used for the spectral and harmonics analysis [15][16].The Fast Fourier Transform (FFT) is a reasonable approach for stationary signal, but it loses accuracy under time fluctuating frequency conditions and furthermore have picket and fence problems [17]. The short time Fourier transform (STFT) has overcome the deficiencies of FT by employing a time- frequency window to localize transient in a signal [15]. There are different numbers of models for EAF such as Wavelet-Transform (WT) have been developed as time-frequency domain and it is outstanding in detecting the beginning of the transients. However, Wavelet Transform have a drawback which is incapable to give accurate result under a noise condition because of poor frequency resolution [9][18]. A Modified version of the STFT known as S-transform (ST) has been proposed for the recognition of power quality disturbance. S-transform is a superior tool to analyze transient disturbances [10][19]. However, the detection ability of ST also degrades in analyzing some non-stationary transient disturbances [15].
Fig. 1. Electric Arc Furnace Model
A controlled voltage source with the resistive and inductive network is used to couple the generated flicker disturbance to a given phase of the power system line. For a three-phase system, three sets of the controlled voltage source and resistive and inductive networks are required. The electric arc furnace model uses a hyperbolic model [13] defined in Equation 1, where Vat is the arc length threshold voltage, i is the phase current, C is the arc power, and D is the arc current
𝑣(𝑖) = (𝑉𝑎𝑡+ 𝐷+|𝑖|𝐶 ) 𝑠𝑖𝑔𝑛 (𝑖) (1)
The effect of voltage flicker is determined by the threshold voltage shown in Equation 2, where Vat0 is the base reference voltage when there is no arc activity, m is the modulation index, and ωf is the flicker frequency.
𝑉𝑎𝑡(𝑡) = 𝑉𝑎𝑡0[1 + 𝑚. sin (𝜔𝑓𝑡)]
(2)
Fig. 2. EAF subsystem block.
2.2 Harmonic Signal Analysis
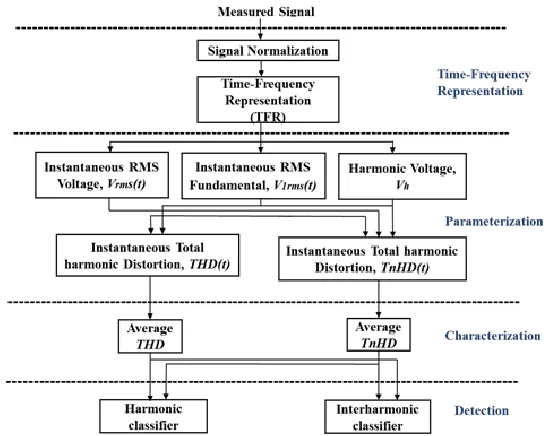
In the harmonic signal detection, there are four basic stages. The first stage is Time-Frequency Representation (TFR), whereas normalization of the measured signal is performed. In the second stage, the signal parameters parameterization will be obtained accurately. In the third stage, with reference to the IEEE Std. 1159-2009, the signal characterization is implemented, and the detection of the harmonic signal is the final stage of harmonic signal analysis.
Fig. 3. Process of Harmonic Signal Analysis
2.3 Spectrogram
The spectrogram is one of the time-frequency representations (TFR) that represents a three dimensional of the signal energy concerning time and frequency and it is obtained by squared modulus of the STFT [23]. This method generally reflects how
2.4 Signal Classification
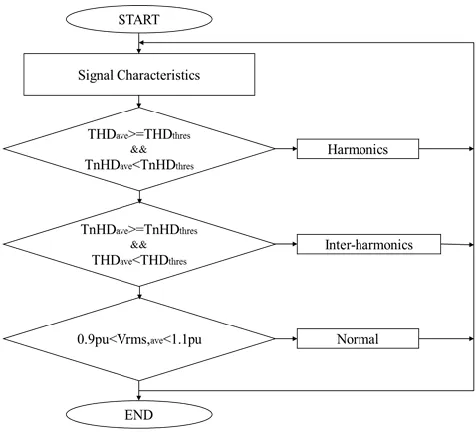
The rule-based classifier is a deterministic grouping technique that utilized as a part of the genuine application, especially in signal classification. The deployment of
rule-The existence of harmonic and interharmonic components distinguished by THD and TnHD indices, respectively. Furthermore, the implementation of signal classification plainly shows in Figure 4.
Fig. 4. Flow chart of Signal Classification
3. RESULTS AND ANALYSIS
In this section, it is explained and discuss comprehensively the results of this research. Figure 5(a) demonstrates the sample of the instantaneous waveform of measured voltage and current at the PCC. According to the IEEE Std 519-2014, the measurement window width should be minimum of 10 cycles and must consider harmonic components up to 50th order. With refer to the IEC 61000-4-7, a method
based on the grouping concept of Harmonic Groups and Interharmonic Groups, minimum of 5 Hz frequency resolution is used in this study. Possibly the greatest challenge pertaining interharmonics is on the low-frequency and is necessary to
(a)
(c)
Fig. 5. (a) Instantaneous voltage and current waveform at PCC, (b) TFR of the voltage signal, (c) TFR of the current signal.
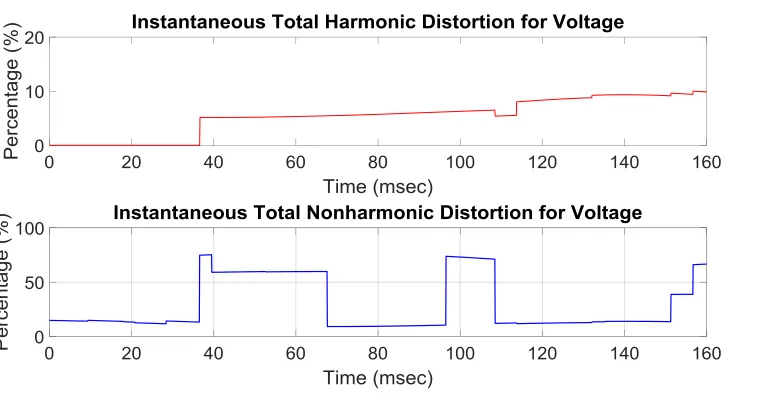
The harmonic and interharmonic indices are calculated using signal parameters that were obtained from the TFR of voltage and current. Figure 6(a) depicts the THD(t) and TnHD(t) of the voltage signal that were obtained from the spectrogram analysis. As can be understood from the figure, the THDV(t) is in the range of zero percent to 10 percent. Meanwhile, the TnHDV(t) value varies from 10 percent to 70 percent, respectively. In the meantime, Figure 6(b) shows that the instantaneous THDI(t) and TnHDI(t) for the current signal which are vary between 15 percent to 20 percent and 20 percent to 80 percent, correspondingly. According to the
IEEE Standard 519-2014, any buses or PCC with a nominal voltage less than 1000 V, the limits may allow 8% THDV and 5% individual voltage harmonic amplitude. It is shown that the THDV has exceeded the standard limit values and the harmonic compensator is required due to improving the power quality. The 3-phase EAF has generated more harmonic distortion as the EAF does not has ground return and also using star connection for the three arc and during unbalanced condition which is in meltdown process, it will cause the harmonic and interharmonic components multiplicity generated.
(b)
Fig. 6. (a) THDV(t) and TnHDv(t), (b) THDI(t) and (d) TnHDI(t)
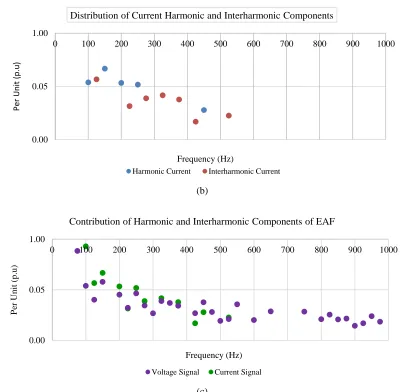
For a better understanding of the harmonic and interharmonic contribution of electric arc furnace in the system, a distribution of voltage and current harmonic and interharmonic components are obtained and observed from TFR. This is done by considering all integer harmonics up to 50th and interharmonic components with a minimum
resolution of 5 Hz; it is clearly shown that the voltage signal comprises a large number of harmonic and interharmonic components compare to the current signal. Figure 7(a) shows the harmonic and interharmonic distribution of voltage. The are 16 voltage harmonic components while 13 voltage interharmonic components are distinguished in the voltage signal. Meanwhile, Figure 7(b) depicts 5 current harmonic
components and 7 interharmonic components. It is observed that the interharmonic components dominantly in the current signal. However, in the voltage signal, the number of harmonic is greater than the interharmonic component. As can be seen from Figure 7(c), the contribution of harmonic and interharmonic of EAF shows that the EAF is considered a voltage harmonic and interharmonic source as well as discussed in [4][6][7]. Establishing EAF model accurately is an essential prerequisite for determining the impact of its harmonic contribution to the system. By using this model and the proposed method, it is observed that the analysis of harmonic and interharmonic contribution can be defined significantly.
(a) 0.0025
0.05 1
0 100 200 300 400 500 600 700 800 900 1000
P
er
Un
it
(p
.u
)
Frequency (Hz)
Distribution of Voltage Harmonic and Interharmonic Components
(b)
(c)
Fig. 7. (a) Distribution of EAF Current Harmonic and Interharmonic Components, (b) Distribution of EAF Voltage Harmonic and Interharmonic Components, (c) Contribution of Harmonic and Interharmonic Components by EAF
4. CONCLUSION
The analysis of the harmonic and interharmonic contribution of EAF in the distribution system by using spectrogram successfully implemented in this study. From the analysis, the spectrogram succeeds in distinguishing the harmonic and interharmonic components. In the meantime, the THD(t) and TnHD(t) indices of the signals are calculated using the signal parameters that were obtained from the TFR. The results show that the spectrogram is fast and accurate in identifying the harmonic and interharmonic distribution. Hence, the spectrogram is an appropriate technique to be implemented for analyzing the harmonic and interharmonic of the EAF.
ACKNOWLEDGEMENTS
This research is supported by Advanced Digital Signal Processing Laboratory (ADSP Lab). Special thanks also to the
of Universiti Teknikal Malaysia Melaka (UTeM), Center for Robotics and Industrial Automation (CeRIA) of UTeM, Ministry of Higher Education Malaysia (MOHE) and Ministry of Science, Technology and Innovation (MOSTI) for giving their cooperation and funding for this research with grant number 06-01-14-SF00119 L00025. Their support is gratefully acknowledged.
REFERENCES
[1] M. T. Esfahani and B. Vahidi, “A Probabilistic Three-Phase Time Domain Electric Arc Furnace Model based on analytical method,” vol. 47, no. 1, pp. 1–10, 2015.
[2] T. M. O. N. Aye and S. O. E. W. I. N. Naing, “Harmonics Evaluation Generated By Electric Arc,” no. 5, pp. 17–22, 2015.
[3] Y. Djeghader and H. Labar, “Improvement Of Power Quality In Electric Arc Furnace Operation Case Harmonics,” pp. 5–9. [4] Y. H. L. Djeghader, “Investigation of Voltage Unbalance Problems
Frequency (Hz)
Harmonic Current Interharmonic Current
0.00 0.05 1.00
0 100 200 300 400 500 600 700 800 900 1000
P
er
Un
it
(p
.u
)
Frequency (Hz)
Contribution of Harmonic and Interharmonic Components of EAF
[5] A. R. Abdullah, G. Z. Peng and S. A. Ghani, “A new vector draft method for harmonic source detection at point of common coupling,” Proc. 2014 IEEE 8th Int. Power Eng. Optim. Conf. PEOCO 2014, no. March, pp. 110–114, 201.
[6] N. H. T. Huda and A. R. Abdullah, “Power quality signals detection using S-transform,” Proc. 2013 IEEE 7th Int. Power Eng. Optim. Conf. PEOCO 2013, pp. 552–557, 2013
[7] Bhonsle, Deepak C., and Ramesh B. Kelkar. "New time domain electric arc furnace model for power quality study." Power Electronics (IICPE), 2014 IEEE 6th India International Conference on. IEEE, 2014.
[8] A. Medina, P. Ribeiro, W. Xu, K. L. Lian, G. W. Chang, V. Dinavahi, and N. R. Watson, “Harmonic Analysis in Frequency and Time Domain,” vol. 28, no. 3, pp. 1813–1821, 2013.
[9] S. K. Ojha, P. A. K. Nadir, M. Chauhan, and A. Kumar, “Identification and Minimization of Harmonics in Power System Networks,” Int. J. Emerg. Technol. Adv. Eng., vol. 4, no. 1, 2014. [10] M. Şeker and A. Memmedov, “Investigation of Voltage Quality in
Electric Arc Furnace with Matlab / Simulink,” no. 11, pp. 274–284, 2014.
[11] Rahmatollah Hooshmand, Mahdi Banejad, and M. T. Esfahani, “A New Time Domain Model for Electric Arc Furnance,” vol. 59, no. 4, pp. 195–202, 2008.
[12] A. P. Esmita Gupta ME Student, “Process Mining A Comparative Study,” Int. J. Adv. Res. Comput. Commun. Eng., vol. 3, no. 11, pp. 17–23, 2014.
[13] R. H. G. Tan and V. K. Ramachandaramurthy, “A Comprehensive Modeling and Simulation of Power Quality Disturbances Using MATLAB / SIMULINK,” Power Qual. Issues Distrib. Gener. InTech, 2015., 2015.
[14] S. Pushpavalli, “Analysis of Different Loads with Multi-Techniques using D-STATCOM,” vol. 7, no. 1, pp. 664–672, 2015
[15] S. A. A. M. Z. A. P. M. A. S. M. Khokhar, “A new optimal feature selection algorithm for classification of power quality disturbances using discrete wavelet transform and probabilistic neural network,” Measurement, vol. 95, pp. 246–259, 2017.
[16] N. H. H. and Abidullah, N. A, Abdullah, A. R., Zuri_Sha’ameri, A., Shamsudin and N.H. Ahmad, “Real-Time Power Quality Disturbances Detection and Classification System,” World Appl. Sci. J., vol. 32, no. 8, pp. 1637–1651, 2014.
[17] S. K. Singh, N. Sinha, A. K. Goswami, and N. Sinha, “Electrical Power and Energy Systems Several variants of Kalman Filter algorithm for power system harmonic estimation,” Int. J. Electr. Power Energy Syst., vol. 78, pp. 793–800, 2016.
[18] N.H.T Ahmad, A.R Abdullah and N.A Abidullah, “Analysis of Power Quality DIsturbances Using Spectrogram and S-Transform,” Int. Rev. Electr. Eng., vol. 9, 2014.
[19] A. R. Abdullah, N. H. T. H. Ahmad, N. A. Abidullah and N. H. Shamsudin, “Performance Evaluation of Real Power Quality Disturbances Analysis Using S-Transform,” Appl. Mech. Mater., vol. 752–753, no. April, pp. 1343–1348, 2015.
[20] Abdullah, Abdul Rahim, et al. "Power Quality Signals Classification System using Time-frequency Distribution." Applied Mechanics and Materials. Vol. 494. Trans Tech Publications, 2014.
[21] N. A. Abidullah, A. R. Abdullah, N. H. Shamsudin and N. H. T. H. Ahmad, “Real-time power quality signals monitoring system,” Proceeding - 2013 IEEE Student Conf. Res. Dev. SCOReD 2013, no. December, pp. 433–438, 2015
[22] N. A. Abidullah, G. Z. Peng and A. R. Abdullah, “A new two points method for identify dominant harmonic disturbance using frequency and phase spectrogram,” Int. Rev. Electr. Eng., vol. 9, no. 2, pp. 453– 459, 2014.
[23] A. R. Abdullah, N.Norddin, N. Q. Zainal Abidin and A. Aman, “Leakage current analysis on polymeric and non-polymeric insulating materials using time-frequency distribution,” IEEE Int. Conf. Power Energy, no. December, pp. 2–5, 2012.
[24] N. M. Kassim, N. A. Ngatiman and M. R. Yusoff, “Localization of Multiple Harmonic Sources for Inverter Loads Utilizing Periodogram,” J. Teknol., vol. 8, no. 2, pp. 87–91, 2016.
[25] T. Sutikno and M. F. Habban, “An Accurate Classification Method