The nature and trends of agricultural research development in Africa:
an informetric study
Dennis N. Ocholla
1Department of Library and Information Science, University of Zululand, Private Bag X1001, KwaDlangezwa 3886, South Africa
and
Omwoyo Bosire Onyancha
2 [email protected]Recei ved: 15th July 2006 Accepted: 30th September 2006
The study recognizes agriculture as the mainstay activity of most economies in Africa and analyses research nature and trends in the discipline by using descriptive informetrics and focusing on seven indicators, by using the AGRICOLA and ISI-E databases from 1991 to 2005. We observed that research output in the discipline is much higher in South Africa and Kenya, and research collaboration is greater than non-collaborative research output and collaboration is less among African countries. The most popular research domains were found to exist in environmental science, soil science, plant/ crop production and [agricultural] economics. Helpful conclusions and recommendations for an agricultural policy, capacity and research orientation have been made.
Key Words: Agricultural Research; Africa; informetrics; Research
1 Introduction
Statistically, the African continent occupies about 11 million square miles of the planet’s land mass, and is inhabited by approximately 690 million people (see http://www.maryknollafrica.org/Facts.htm). Most (70%) of the African population live in the rural areas where agriculture is the predominant economic activity. It employs 70% of the continen’ts economically active population and accounts for about 25% of the gross domestic product and 60% of the export income ( Kiplang’at, 2004:328 & 348; Diouf 2003). Whereas there are many ways of improving agricultural production in Africa, research is considered to play a significant role. A widely held view is that research would solve problems existing in the sector, integrate and interrogate its existing theories and hypotheses, create new knowledge, provide new knowledge and information for decisions informed by empirical evidence and rational thinking, and strengthen capacity building for agricultural research whilst developing the sector. A number of methods are used to determine research capacity that also applies to agriculture. Among them are the determination of the number of research workers, research institutions, research output (e.g research publication), research policy, research structures and knowledge, and information systems and services. Arunachalam & Umarani (2001:905) observe that the future of a country’s agriculture is dependent on research, public policy and the farming community’s cooperative action. Related studies have been conducted in Mexico (De Arenas, Sandoval & Arenas 2003), Saskatchewan (Phillips 2001) and India (Arunachalam & Umarani 2001) but none, to the best of our knowledge, has been conducted in Africa. The aim of this study is to determine the nature of and trends in agricultural research development in Africa between 1991 and 2005 through an informetric/bibliometric analysis on the AGRICOLA (on-line) and Thompson Scientific Science Citation Index Expanded databases. AGRICOLA is considered to be the largest subject based agricultural research database in the world, whilst the Thompson Scientific Science Citation Index Expanded database represents the largest collection of high impact research output in the domain. The study determines the research indicators relating to geographic region or country of publication, national, institutional and individual levels of collaboration, subject, nature of records and research trends over 15 years. With a view of triangulation, the study also makes comparisons in coverage between AGRICOLA and the Thompson Scientifics’ Science Citation Index Expanded database.
1. Dennis Ocholla (PhD) is Professor and Head of the Department of Library and Information Science, University of Zululand, South Africa
2 Method and procedure
Content analysis conducted using descriptive informetric approaches enabled us to analyse research in Agriculture in Africa between 1991 and 2005 in two databases, namely, AGRICOLA and the Science Citation Index Expanded (SCI-E). AGRICOLA (AGRICultural OnLine Access) is a bibliographic database of citations for agricultural literature created by the National Agricultural Library (NAL) and its co-operators. The records describe publications and resources encompassing all aspects of agriculture and its allied disciplines as reflected in Table 2. The database includes journal articles, book chapters, short reports, and reprints. The SCI-E, on the other hand, is a multidisciplinary index for scientific journal literature. It comprehensively indexes 5,900 major journals across 150 scientific disciplines – 2,100 more journals than print and CD-ROM versions of the SCI. The Index includes all cited references captured from indexed articles. Additionally, the index provides access to both current information and retrospective data dating back to 1945 and covers approximately 423,000 new cited references per week. Its subject coverage in agriculture that includes full-length, English-language-based texts is reflected in Table 2. Data was extracted from the two databases using a uniform search strategy that combined two keywords. First, the keywords ‘Agriculture AND Africa’ were used to extract data that was specific to agricultural research in Africa as a whole. Then, we conducted a search using the Boolean indicator ‘NOT’:-applying the key word ‘Agriculture’ AND each of the 53 countries (e.g. South Africa) NOT Africa’. This process significantly minimised the number of duplicate entries. In the case of AGRICOLA, records were stored as text files (i.e. *.txt) and after the removal of the duplicate records, data was analysed using BIBEXCEL computer-aided bibliographic software. Thereafter, data was captured, merged and stored in Excel spreadsheets and analysed using the indicators/ output based on institutional and individual collaboration, subject category, nature of records and research trends over 15 years. Similarly, the SCI-E data was downloaded and stored as text files and analysed using two computer programs (SITKIS v. 1.5 ©2005 and CITESPACE v. 2.0.1 ©2003-2005). SITKIS, developed by Henri Schildt from the Helsinki University of Technology3, consists of citation data processing software that can be used to import ISI Web of Science files into a Microsoft Access database, thus enabling ease during modification. SITKIS also exports data from the database into UCINET compatible network graphs and Excel-compatible reports. The purpose of the program is to enable researchers to download and analyse bibliometric records quickly and easily, effectively simplifying what would otherwise be a considerably time-consuming process. Similarly, CiteSpace consists of citation data processing computer software that was developed by Chaomei Chen to assist in the preparation of author co-authorship networks, document co-citation networks, journal co-citation networks, author co-citation networks, and term co-occurrence networks. Microsoft ®Excel 2003 was used to process and represent the quantitative data
3 Results
This section reports on the distribution of documents by year of publication, the distribution of documents by document type and the subject category of documents by region/country of publication, by author’s country of affiliation, by sources, by language, and by collaboration.
3.1 Distribution of documents by year of publication
A total of 2368 documents and 1254 papers were extracted from AGRICOLA and the SCI-E respectively. Six hundred and twenty seven (627) records found in the AGRICOLA database were excluded from the analysis according to the year of publication. The dates of these records were unclear, i.e. were in the following format: ‘between 1996 and 1998’, and ‘1996 or 1997<1992-1995>’ OR contained question marks (?) Where there were two copyright dates of publication, only the most recent date was considered for analysis. This analysis yielded 1741 AGRICOLA records, whilst the SCI-E generated 1254 records (see Table One). Table 1 show that there has been an incremental growth in the number of records indexed in the SCI and a negative growth in the case of AGRICOLA. The number of records fell from 157 in 1991 to 13 in 2005 in AGRICOLA’s case, whilst SCI-E’s papers rose from 36 to 149 during the same period. Nevertheless, columns six and seven show that cumulatively, the total number of records increased to the current 2368 for AGRICOLA, and 1254 for SCI-E.
3.2 Distribution of documents by document type
Agricultural information on Africa and her 53 countries was published in several different document types, amounting to 14 different categories. Ranked first were journal articles, which had 1175 and 1180 postings, followed by books (986), book chapters (151) and book reviews (56). Others, in descending order, were serials (47), editorials (9), meeting abstracts (5), audio-visual materials (4), manuscript collections (2), notes (2), machine-readable data files (2), maps (1), biographical items (1), and news items (1). Worth noting is the large representation of books and book chapters.
3.3 Distribution of documents by subject category
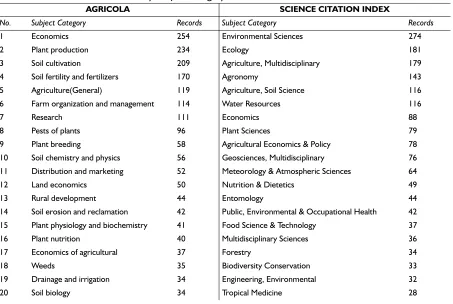
The grouping of documents by subject category was useful for establishing the size, scope and nature of subject coverage by the database on Agricultural research, and the various disciplines that are utilising agricultural information. It is important to note that the SCI-E categorises its records according to broader disciplines (subject categories) than AGRICOLA. The dominant subject areas/categories include Environmental sciences (274), Economics (254), Plant production (234), Soil cultivation (209), Agriculture, Multidisciplinary (179), Soil Fertility (170), Agronomy (143) and Agriculture [general] (119). Others are Soil science (116), Water resources (116) and Farm organization and management (114). We have observed that Animal production does not feature among the top categories.
Table 1 Distribution of documents by year of publication
Year of publication Documents % increase/decrease Cumulative % increase
AGRICOLA SCI-E AGRICOLA SCI-E AGRICOLA SCI-E AGRICOLA SCI-E
2005 13 149 -61.76 16.78 1741 1254 0.75 11.88
2004 34 124 -34.62 0.81 1728 1105 2.01 11.22
2003 52 123 -37.35 8.94 1694 981 3.17 12.54
2002 83 112 -43.15 9.82 1642 858 5.32 13.05
2001 146 101 25.86 0.99 1559 746 10.33 13.54
2000 116 100 -5.69 19.00 1413 645 8.94 15.50
1999 123 81 -3.91 7.41 1297 545 10.48 14.86
1998 128 75 5.79 9.33 1174 464 12.24 16.16
1997 121 68 5.22 1.47 1046 389 13.08 17.48
1996 115 67 -11.54 1.49 925 321 14.20 20.87
1995 130 66 28.71 19.70 810 254 19.12 25.98
1994 101 53 -22.31 5.66 680 188 17.44 28.19
1993 130 50 -32.29 2.00 579 135 28.95 37.04
1992 192 49 -25.29 26.53 449 85 74.71 57.65
1991 257 36 - 257 36
-TOTAL 1741 1254 - -
-Table 2 Distribution of documents by Subject Category
AGRICOLA SCIENCE CITATION INDEX
No. Subject Category Records Subject Category Records
1 Economics 254 Environmental Sciences 274
2 Plant production 234 Ecology 181
3 Soil cultivation 209 Agriculture, Multidisciplinary 179
4 Soil fertility and fertilizers 170 Agronomy 143
5 Agriculture(General) 119 Agriculture, Soil Science 116
6 Farm organization and management 114 Water Resources 116
7 Research 111 Economics 88
8 Pests of plants 96 Plant Sciences 79
9 Plant breeding 58 Agricultural Economics & Policy 78
10 Soil chemistry and physics 56 Geosciences, Multidisciplinary 76
11 Distribution and marketing 52 Meteorology & Atmospheric Sciences 64
12 Land economics 50 Nutrition & Dietetics 49
13 Rural development 44 Entomology 44
14 Soil erosion and reclamation 42 Public, Environmental & Occupational Health 42
15 Plant physiology and biochemistry 41 Food Science & Technology 37
16 Plant nutrition 40 Multidisciplinary Sciences 36
17 Economics of agricultural 37 Forestry 34
18 Weeds 35 Biodiversity Conservation 33
19 Drainage and irrigation 34 Engineering, Environmental 32
3.4 Distribution of documents by geographic region
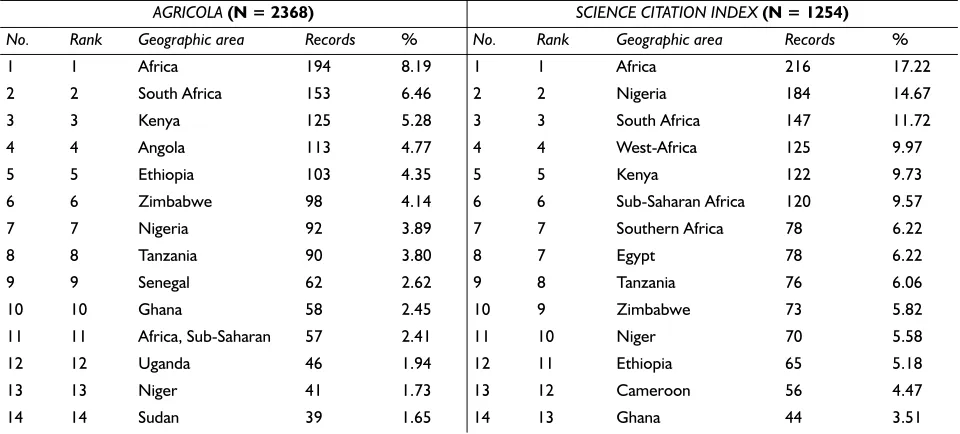
The distribution of documents by geographic region or country reflects the countries as subjects of research, i.e. the geographic areas of research focus. The analysis sought to determine the most researched country or geographic region in Africa. Table 3 indicates that as far as country output is concerned, South Africa was first and posted 153 (6.46%) records in AGRICOLA, and 147 (11.72%) in the SCI. Other regions/countries that ranked highly in both databases, included Kenya, Nigeria, Angola, Ethiopia, Sub-Saharan Africa, Southern Africa, Zimbabwe and Tanzania.
21 Development aid: Aims, Policies, Etc 33 Zoology 28
22 Food composition 30 Veterinary Sciences 27
23 Plant diseases 30 Geography, Physical 24
24 Animal production 29 Parasitology 22
25 Natural resources 29 Marine & Freshwater Biology 19
26 Rural sociology 27 Agriculture, Dairy & Animal Science 18
27 Water resources and management 22 Biotechnology & Applied Microbiology 16
28 Economics and administration 18 Energy & Fuels 14
29 Food science 16 Engineering, Civil 13
30 Education and training 15 Horticulture 13
31 Farm equipment 15 Ornithology 12
32 General agriculture and rural 15 Limnology 11
33 Animal nutrition 13 Agricultural Engineering 9
34 Extension and advisory work 12 Chemistry, Analytical 9
35 Food processing 12 Chemistry, Applied 9
36 Meteorology and climatology 11 Toxicology 9
37 Pests of animals 11 Biology 8
38 Human nutrition, General 10 Evolutionary Biology 8
39 Social sciences and humanities 10 Anthropology 7
40 History 9 Oceanography 7
41 Protection of stored plant 9 Paleontology 7
42 Agricultural production costs 8 Remote Sensing 7
43 Microbiology of food processing 8 Engineering, Chemical 6
44 Pesticides, General 8 Imaging Science & Photographic Technology 6
45 Animal genetics 7 Pathology 6
46 Documentation 7 Computer Science, Interdisciplinary Applications 5
47 General agricultural economics 7 Mycology 5
48 Land resources 7 Biochemistry & Molecular Biology 4
49 Pollution, General 7 Computer Science, Software Engineering 4
Table 3 Distribution of documents by Geographic region/territory
AGRICOLA (N = 2368) SCIENCE CITATION INDEX (N = 1254) No. Rank Geographic area Records % No. Rank Geographic area Records %
1 1 Africa 194 8.19 1 1 Africa 216 17.22
2 2 South Africa 153 6.46 2 2 Nigeria 184 14.67
3 3 Kenya 125 5.28 3 3 South Africa 147 11.72
4 4 Angola 113 4.77 4 4 West-Africa 125 9.97
5 5 Ethiopia 103 4.35 5 5 Kenya 122 9.73
6 6 Zimbabwe 98 4.14 6 6 Sub-Saharan Africa 120 9.57
7 7 Nigeria 92 3.89 7 7 Southern Africa 78 6.22
8 8 Tanzania 90 3.80 8 7 Egypt 78 6.22
9 9 Senegal 62 2.62 9 8 Tanzania 76 6.06
10 10 Ghana 58 2.45 10 9 Zimbabwe 73 5.82
11 11 Africa, Sub-Saharan 57 2.41 11 10 Niger 70 5.58
12 12 Uganda 46 1.94 12 11 Ethiopia 65 5.18
13 13 Niger 41 1.73 13 12 Cameroon 56 4.47
3.5 Distribution of documents by country of publication/author’s country of affiliation
The distribution of documents by country of publication and the author’s country of affiliation was based on the analysis of 1006 AGRICOLA and 1254 SCI records. Focus was placed on the country in which the document was published and the author’s country of affiliation (i.e. where the author resides or works). Whereas the former provided information on where research in agriculture regarding Africa is published, the latter analysis provided information on the country conducting research on agriculture in Africa (i.e. the country from which the document originated). In other words, the former can be treated as the publisher (publishing country), whilst the latter refers to the country as the author/producer of the record. Leading in both cases (i.e. publisher and author/producer) is the USA, which published 222 records and authored 297 papers. The second ranked country-publisher is France, which posted 100 records, followed by England (85, 8.45%), Egypt (77, 7.65%), South Africa (66, 6.56%), Italy (45, 4.47%), and Ethiopia (41, 4.08%). Besides the USA, the most productive country-authors’ were England (160, 12.80%), South Africa (132, 10.50%), Nigeria (109, 8.70%), Kenya (73, 5.80%), Netherlands (68, 5.40%), Germany (65, 5.20%), France (61, 4.90%), Australia (55, 4.40%) and Egypt (48, 3.80%). We observed that most African countries that appeared as authors do not appear as major publishers, suggesting that documents associated with them are not necessarily published within the country.
15 15 Cameroon 36 1.52 15 14 Uganda 43 3.43
16 16 Burkina Faso 33 1.39 16 15 East Africa 38 3.03
17 17 West Africa 31 1.31 17 16 Sudan 34 2.71
18 18 Malawi 30 1.27 18 17 Morocco 33 2.63
20 19 Benin 21 0.89 20 17 Burkina Faso 33 2.63
21 20 Mali 20 0.84 21 17 Central Africa 33 2.63
22 20 Tropics 20 0.84 22 18 Senegal 31 2.47
24 21 Algeria 18 0.76 24 18 Malawi 31 2.47
25 22 Southern Africa 17 0.72 25 19 Zambia 29 2.31
26 23 Botswana 16 0.68 26 20 Madagascar 28 2.23
27 24 Burundi 15 0.63 27 21 Cote D'ivoire 24 1.91
28 24 Mozambique 15 0.63 28 22 Botswana 21 1.67
29 25 Guinea 14 0.59 29 23 Benin 20 1.59
30 26 Zambia 13 0.55 30 24 Mali 20 1.59
31 27 Swaziland 12 0.51 31 24 Togo 12 0.96
32 27 Zaire 12 0.51 32 24 Gambia 12 0.96
33 28 Central Africa 11 0.46 33 24 Eastern Africa 12 0.96
34 28 Tunisia 11 0.46 34 25 Congo 11 0.88
35 29 Africa south of Sahara 10 0.42 35 26 Gabon 7 0.56
36 29 Togo 10 0.42 36 26 Lesotho 7 0.56
Table 4 Sources publishing agricultural research on Africa, 1991-2005
No. Source AGRICOLA SCI
1 Agriculture, ecosystems and environment 197 42
2 Experimental agriculture 143 15
3 Tropical agriculture 115 9
4 Journal of sustainable agriculture 69 41
5 Outlook on agriculture 81 20
6 Journal of the science of food and agriculture. 79 1
7 Agricultural economics 32 40
8 Agricultural systems 20 32
9 Food policy 24 19
10 Agriculture and human values 37
-11 Applied soil ecology 36 1
12 Physics And Chemistry of The Earth - 27
13 Biological agriculture and horticulture 22 3
14 Nutrient cycling in agro ecosystems 10 15
15 Horticultural products review FHORT 23
3.6 Sources publishing agricultural research on Africa
A total of 151 AGRICOLA and 442 SCI sources published agricultural research on Africa and her countries. The top ranking 39 sources that produced 4 or more records (in each database) are presented in Table 6. The top 10 most productive sources include Agriculture, ecosystems and environment (197, 42), Experimental agriculture (143, 15), Tropical Agriculture (115, 9), Journal of Sustainable Agriculture (69, 41), Outlook on Agriculture (81, 20), Journal of the Science of Food and Agriculture (79, 1), Agricultural Economics (32, 40), Agricultural Systems (20, 32), Food Policy (24, 19) and Agriculture and Human Values (37, 0)
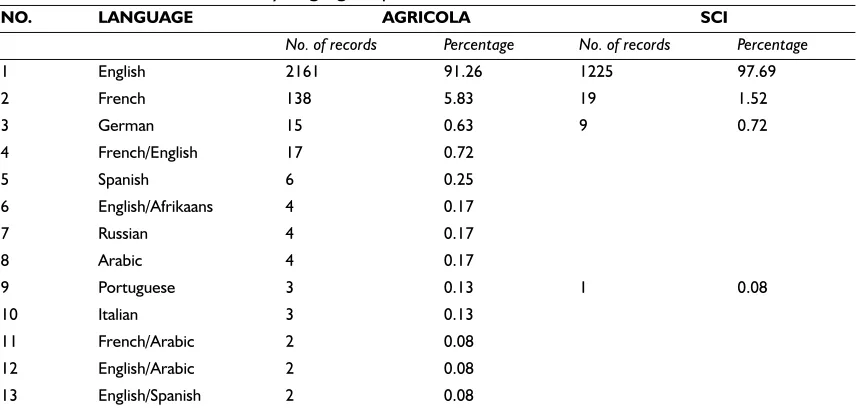
3.7 Language of publication
English is dominant. The language was used to publish 2161 (91.26%) papers in AGRICOLA while SCI indexed 1225 (97.69%) agricultural records published in English. Other languages that were used in publishing agricultural research included French, German, Spanish, Afrikaans, Russian, Arabic, Portuguese, Italian, Ukranian, Hungarian, Swahili and Dutch. It was noted that AGRICOLA indexes documents in a variety of languages, while the SCI-E largely prefers English-based papers. The distribution of the documents by the language of publication is provided in Table 5
17 Land Degradation and development - 19
18 Journal of Arid Environments - 16
19 Applied engineering in agriculture 15
-20 American journal of agricultural Economics 6 8
21 Biodiversity and Conservation - 14
22 Agricultural Water Management - 13
23 Ambio - 13
24 Geoderma - 13
25 Soil & Tillage Research - 13
26 Climatic Change - 12
27 South African Journal of Science - 12
28 Biological Conservation - 11
29 Economic Botany - 11
30 Environmental geology 4 7
31 Plant and Soil - 11
32 Ecological Economics - 10
33 Crop protection 4 4
34 Science 4 4
35 American journal of alternative agriculture 7
-36 Ecology, economy & environment 7
-37 Journal of hydrology 4 3
38 Journal of stored products research 4 3
39 Proceedings of the Natl Acad of Sci of the U.S.A 4 3
Table 5 Distribution of records by language of publication
NO. LANGUAGE AGRICOLA SCI
No. of records Percentage No. of records Percentage
1 English 2161 91.26 1225 97.69
2 French 138 5.83 19 1.52
3 German 15 0.63 9 0.72
4 French/English 17 0.72
5 Spanish 6 0.25
6 English/Afrikaans 4 0.17
7 Russian 4 0.17
8 Arabic 4 0.17
9 Portuguese 3 0.13 1 0.08
10 Italian 3 0.13
11 French/Arabic 2 0.08
12 English/Arabic 2 0.08
3.8 Research Collaboration
AGRICOLA produced a total of 2269 (95.8) records that provided information on authors’ names, while the SCI provided author names in 1253 (99.9) records. The distribution of the records according to the number of authors for each record is shown in Fig 1. In the case of AGRICOLA, one-author records were 934, followed by two-author records which numbered 596, three-author records (394), and four-author records (166), etc.
Institutional collaboration is presented in Table 6, which provides the leading collaborating institutions that produced 3 or more papers in the SCI. The high pattern of co-authorship was witnessed between the UNIV IBADAN, Nigeria and INT INST TROP AGR, Nigeria (8), INT INST TROP AGR and INT LIVESTOCK RES INST – Ethiopia, Kenya, Niger, and Nigeria – (6), TEXAS TECH UNIV, USA and UNIV GUELPH, Canada (6). Others include CSIR, South Africa and UNIV PORT ELIZABETH, South Africa (4), FENG CHIA UNIV, Taiwan and UNIV KANSAS (4), HARVARD UNIV, England and UNIV WISCONSIN, USA (4), and HARVARD UNIV and UNIV WISCONSIN (4), etc. The Food and Agriculture Organization, based in different countries (e.g. Austria, Burkina Faso, Italy, Togo, and Zimbabwe) contributed a large number of papers in conjunction with other institutions such as UNIV OXFORD (6), RUG (5), ITG IMT (3), TROP INST (3), and ITG (2). Visualizing the SCI co-authored papers produced 25 collaborative networks that met the following threshold requirements: citations (c) = 2, co-citation (cc) = 2, co-citation coefficient = 0.1 These collaboration networks are shown in Fig 2. The size of the nodes and fonts indicates the size of contributions made by each author in the network. The largest network consists of 7 authors while the smallest network is made up of two authors. Major co-authorship contributions involved COWLING RM and RICHARDSON DM (6), IKOTUN T and FOKUNANG CN (5), FOKUNANG CN and DIXON AGO (5), NAPALA A and HENDRICKX G (5), IKOTUN T and DIXON AGO (5), KOLAWOLE GO and TIAN G (5), to name just a few.
14 Afrikaans 2 0.08
15 Ukranian 1 0.04
16 Hungarian 1 0.04
17 German/English 1 0.04
18 English/Swahili 1 0.04
19 Dutch 1 0.04
TOTAL 2368 100.00 1254 100.00
0 100 200 300 400 500 600 700 800 900 1000
Authors
R
eco
rd
s
.
AGRICOLA 934 596 394 166 86 34 21 13 10 11 2
SCI-E 308 351 251 154 84 46 19 8 15 7 10
1 2 3 4 5 6 7 8 9 10 11+
Table 6 Institutional co-authorships
Institute A Institute B Records
UNIV IBADAN INT INST TROP AGR 8
INT INST TROP AGR INT LIVESTOCK RES INST 6
TEXAS TECH UNIV UNIV GUELPH 6
CSIR UNIV PORT ELIZABETH 4
FENG CHIA UNIV UNIV KANSAS 4
HARVARD UNIV UNIV WISCONSIN 4
KANSAS STATE UNIV UNIV KANSAS 4
KASTENS INC FARMS UNIV KANSAS 4
KATHOLIEKE UNIV LEUVEN RMCA 4
RIVERS STATE UNIV SCI & TECHNOL WORLD AGROFORESTRY CTR ICRAF 4
TUFTS UNIV UNIV GEORGIA 4
UNIV CAPE TOWN UNIV PORT ELIZABETH 4
UNIV KANSAS FENG CHIA UNIV 4
UNIV PORT ELIZABETH CSIR 4
UNIV PORT ELIZABETH NEW S WALES NATL PARKS & WILDLIFE SERV 4
UNIV PRETORIA US ECON RES SERV 4
BATTELLE MEM INST USAMRIID 3
BROUWER ENVIRONM & AGR CONSULTANCY FREE UNIV AMSTERDAM 3
CROPS RES INST NOVA SCOTIA AGR COLL 3
CTR HOSP UNIV IBN EL JAZZAR KAIROUAN INST PASTEUR TUNIS 3
GRAZ UNIV RUSSIAN ACAD SCI 3
ICRAF WAGENINGEN UNIV AGR 3
ILLINOIS DEPT AGR USAMRIID 3
ILLINOIS DEPT PUBL HLTH USAMRIID 3
KENYA AGR RES INST WAGENINGEN UNIV AGR 3
4 Discussions and conclusions
We observed, first, that the distribution of documents by year of publication over the duration of 15 years, whilst exhibiting a cumulative growth of records in 1999, does also show largely negative growth, as is the case with AGRICOLA in 2005, reflected in Table 1. This negative growth in turn suggests that either research output is indexed in databases other than AGRICOLA or ISI, or, those published are indexed in non subject gateway databases (e.g those on the web), or indexed in national/regional databases. There could of course be a general decline in the amount of agricultural research output and support in Africa. Unfortunately, besides the South African based SABINET databases, recognisable databases in other parts of Africa are not known, and this in turn affects the visibility of Africa’s research. The limited growth between 2002 and 2005 could also be attributed to an indexing time lag factor [the period between the publication of a paper in the public domain and the date it is captured in abstracting and indexing journals] (see Diodato 1994). Second, most indexing and abstracting databases largely index journal articles. AGRICOLA, however, makes use of a unique approach involving the inclusive indexing of a variety of document types, particularly books. Among the 14 document types identified, articles (SCI and AGRICOLA) and books (only AGRICOLA) are dominant. We observe that there is a positive, albeit complex, attempt at incorporating inclusive indexing, which involves the inclusion of books and book chapters as reflected in the AGRICOLA database, that should augur well in diffusing criticism on the over-reliance of journal articles for measuring research output. The small number of documents captured from the other 12 document types is not unusual. Third, a subject category that was created and sequenced/ordered by the frequency of occurrence of records in the particular subject area is illustrated in Table 2. Although a total of 98 subject areas were identified, when some of these domains were grouped into broader concepts or logically within a larger subject field, the dominant subject categories emerging were soil science; plant[crop] production; environmental science; [agricultural] economics; general agriculture; farm administration and management; research and animal production. One of the initial research assumptions was that crop/plant production and animal production would be dominant in the research domain. Regrettably, research in animal production is insignificant. This perhaps shows that less research is conducted in animal production, even though we believe that it is one of the largest agricultural sectors in Africa. A bibliometric assessment of South African research publications as indexed in the Thomson ISI databases by Pouris (2006), however, reveals that plant sciences was the most published discipline with a total of 2182 publications between 2000 and 2004, followed by animal sciences (2108), and environment ecology (1187). It can be noted that Pouris’ findings greatly differ from the results reported by this study in that the latter produced a relatively large volume of publications on the subject area of plant sciences and animal science among others. The pattern reported in our study can be attributed to our limiting the search to only agricultural publications. But this could also mean that research output is not indexed in popular databases. Although there are other speculative reasons why Agricultural research would be higher in some countries in Africa (such as South Africa and Kenya), stronger research output is observed in less popular agricultural areas such as Angola, Ethiopia and Nigeria, suggesting growing interest in increasing agricultural production in the formerly marginalised but potential agricultural areas. Fifth, a list of journals that publish agricultural research on Africa in Table 4 captured some 39 sources out of an identified 595. It illustrated that most journals indexed by AGRICOLA are also indexed by ISI. However, the number of indexed records from the same source is fairly varied (e.g SCI indexes less records). This could be attributed to the large variety of document types indexed by AGRICOLA. Sixth, as is widely known, Africa consists of 53 independent countries whose major non-African languages, according to individual histories, besides the local languages, are 26 English speaking [Anglophone], 29 French speaking [Francophone], 5 Portuguese speaking [Lucophone], 7 Arabic speaking and 2 Spanish speaking. In some countries, however, one or more of the above languages is or are spoken as official and national languages alongside popular African local languages, and ultimately research output is published in these non-African languages. The dominant language of publication with regard to agricultural publications on Africa is English, although publication does occur in other languages as well. English was leading in both databases. 91.26% of
METROPOLITAN WATER RECLAMAT DIST GREATER CHICAGO UNIV IBADAN 3
MICHIGAN STATE UNIV UNIV GUELPH 3
MICHIGAN STATE UNIV UNIV TENNESSEE 3
NATL BOT INST UNIV CAPE TOWN 3
NEW MEXICO STATE UNIV WAGENINGEN UNIV AGR 3
ORSTOM SECTEUR GRANDES ENDEMIES 3
ORSTOM UNIV CAD 3
POTCHEFSTROOM UNIV CHRISTIAN HIGHER EDUC UNIV GUELPH 3
PURDUE UNIV WAGENINGEN UNIV AGR 3
RUSSIAN ACAD SCI UFZ 3
UNIV DAR ES SALAAM UNIV NAIROBI 3
UNIV NAIROBI AGR UNIV WAGENINGEN 3
AGRICOLA records and 97.69% of SCI papers were published in English, whilst French and German were ranked second and third as illustrated in Table 5. Other languages used in agricultural publications on Africa are Spanish, Afrikaans, Russian, Arabic, Portuguese, Italian, Ukranian, Hungarian, Swahili and Dutch. In some instances, documents were published in two languages, thus catering for a larger audience. This may also have been necessitated by collaboration amongst researchers from different countries, hence requiring the incorporation of multiple languages. Seventh, this study also focused on collaborative research output. There are several benefits of research collaboration as outlined by Katz & Martin (1997). Among them according to the two authors are: the fact that it enables researchers to share skills and techniques and is one way of transferring knowledge (especially tacit knowledge); through clashing views it may bring about the cross-fertilisation of ideas, which may in turn generate new insights or perspectives that individuals, working on their own, would not have grasped; collaboration provides intellectual companionship (i.e. within a practising community); collaboration plugs the researcher into a wider contact network in the scientific community; and it enhances the potential visibility of the work. Thus, collaboration helps speed up problem solving, stimulates creativity and enables inter-disciplinary boundary crossing, which in turn enriches knowledge development and transfer. Co-authored records totaled 1335 producing a collaboration degree (calculated as percentage proportion of co-authored records to single-authored records) of 58.84 and a collaboration coefficient (the ratio of the number of collaborative records to the total number of records published in a domain) of 0.564 or [56.4]. The SCI produced 308 one-author records, 351 two-author records, 251 three-author records and 154 four author-records. The collaboration degree for the SCI was 75.42, with the collaboration coefficient slightly lower, i.e. 0.7536 (75.36). Generally, universities recorded the highest pattern of collaboration, either among the universities or between universities and non-academic institutions (e.g. agricultural research institutions/centers). We noted that research collaboration amongst African based researchers and individuals is very minimal. Finally, we recommend that the research agenda in Africa focuses on how to: support, balance and increase agricultural research; increase research partnership or collaboration in general and among African countries in particular; create and support national indexing databases that would strongly reflect national or regional research output; and audit and map research outputs outside the public domain caused by non-existent indexing services. Further, AGRICOLA and SCI based results be compared with national database indexing records (e.g SABINET based databases such as Current and Completed Research [C&CR] and the Union of Completed Theses and Dissertations [UCTD]) in order to show how national agricultural research trends (reflected in SABINET for South Africa) can be utilised alongside internationally popular databases such as SCI.
Acknowledgement
The original version of this paper was presented at the International Workshop on Webometrics, Informetrics and Scientometrics & Seventh COLLNET Meeting, May 26-28th, Nancy, France. We wish to acknowledge the financial support given by the University of Zululand Research Committee towards the project and travel to the conference by one of the authors.
References
Arunachalam, S. & Umarani, K. 2001. Mapping agricultural research in India: a profile based on CAB Abstracts 1998. Current Science, 81(8): 896-906
De Arenas, J. L., Sandoval, M., & Arenas, M. (2003). Agricultural Research in Mexico: a gender-focused bibliometric study. Anales de Documentacion, no.6: 145-154
Diodato, V. 1994. Dictionary of Bibliometrics. New York: Haworth.
Diouf, Jacques 2003 Food Security in Least Developed Countries. Africa Focus Bulletin, N.16 (031116). [Online]. Retrieved March 14th, 2006, from http://allafrica.com/stories/200311110664.html
Katz, J.S. & Martin, B.R. 1997. What is research collaboration? Research policy, 26(1):1-18
Kiplang’at, J. 2004. Use of wireless technology and other forms of ICTs in bridging the digital divide in the communication of agricultural information in Sub-Saharan Africa. In: TJD Bothma & A Kaniki, 2002. ProLISSA 2002. Proceeding of the 2nd biennial ProLISSA Conference, Pretoria, 24 - 25 October 2002. Pretoria: Infuse, pp. 347-368
Phillips, P. W. B. 2001. Managing Knowledge-based Agri-Food Development. Retrieved March 21st, 2006, from www.ag.usask.ca/ departments/agec/cmtc/pdfs/Langford_Phillips_helix_new.pdf
Ocholla, D.N.2000. Training for Library and Information Studies: a comparative overview of LIS education in Africa. Education for Information, 18, 33-52
Pouris, A. (2006). A Bibliometric Assessment of South African Research Publications included in the Internationally Indexed Databases of Thomson ISI. In Report on Strategic
Approach to Research Publishing in South Africa, 9-28. [Online]. http://www.naci.org.za/OECD/ assaf_strategic_research_publishing.pdf .Accessed 3 October 2006