www.nat-hazards-earth-syst-sci.net/15/461/2015/ doi:10.5194/nhess-15-461-2015
© Author(s) 2015. CC Attribution 3.0 License.
GIS modeling of seismic vulnerability of residential fabrics
considering geotechnical, structural, social and physical distance
indicators in Tehran using multi-criteria decision-making
techniques
F. Rezaie and M. Panahi
Department of Geophysics, Young Researchers and Elites Club, North Tehran Branch, Islamic Azad University, Tehran, Iran Correspondence to: F. Rezaie ([email protected])
Received: 25 July 2014 – Published in Nat. Hazards Earth Syst. Sci. Discuss.: 12 September 2014 Revised: 7 January 2015 – Accepted: 3 February 2015 – Published: 9 March 2015
Abstract. The main issue in determining seismic vulnerabil-ity is having a comprehensive view of all probable damages related to earthquake occurrence. Therefore, taking into ac-count factors such as peak ground acceleration at the time of earthquake occurrence, the type of structures, population dis-tribution among different age groups, level of education and the physical distance to hospitals (or medical care centers) and categorizing them into four indicators of geotechnical, structural, social and physical distance to needed facilities and from dangerous ones will provide us with a better and more exact outcome. To this end, this paper uses the ana-lytic hierarchy process to study the importance of criteria or alternatives and uses the geographical information system to study the vulnerability of Tehran to an earthquake. This study focuses on the fact that Tehran is surrounded by three ac-tive and major faults: Mosha, North Tehran and Rey. In order to comprehensively determine the vulnerability, three scenar-ios are developed. In each scenario, seismic vulnerability of different areas in Tehran is analyzed and classified into four levels: high, medium, low and safe. The results show that, regarding seismic vulnerability, the faults of Mosha, North Tehran and Rey make, respectively, 6, 16 and 10 % of Tehran highly vulnerable, while 34, 14 and 27 % is safe.
1 Introduction
Greater Tehran (Iran’s capital) has a population of around 12 million people. As a result of the city being located in the vicinity of three active faults, the Mosha, North Tehran and Rey faults, it has high seismic vulnerability potential. The study of the earthquakes’ catalogs proves this claim. There-fore, developing an earthquake vulnerability map for Tehran is of utmost importance.
Since several factors determine the seismic vulnerabil-ity of a cvulnerabil-ity and all of them have to be studied simultane-ously, multi-criteria decision-making (MCDM) techniques can be used in order to fill this gap. MCDM follows a collection of methods through which techniques and algo-rithms utilized to solve complex decision-making covering a wide range of choices and assessed by multiple, conflicting and incommensurable criteria as well as developing, assess-ing and prioritizassess-ing of decision-makassess-ing alternatives can be used (Malczewski, 1999; Suárez-Vega et al., 2011). Since geographical information system (GIS) facilitates vulnera-bility studies and natural hazards analysis as a useful tool for managing, controlling, processing and analyzing the spa-tial data (Rashed and Weeks, 2003; Gamper et al., 2006; Almasri, 2008), utilizing GIS-based multi-criteria decision-making (GIS-MCDM) developed by Malczewski (2006) pro-vides the possibility of prioritizing and combining the spatial criteria from different location and description viewpoints and eventually making comprehensive decisions. Different GIS-MCDM techniques are available depending on the re-quired operations in order to acquire the final assessment from alternative solutions; analytic hierarchy process (AHP) is one of them.
AHP is one of the most comprehensive algorithms devel-oped for decision-making with multi-criteria because it al-lows for hierarchically formulizing the complex problems; there is also the possibility of considering different qual-ity and quantqual-ity criteria simultaneously (Chen et al., 2008). Thus, for solving complex spatial problems the combina-tion of AHP with GIS resolves many issues. As a result, a great body of research has been conducted to assess the vulnerability of cities to natural events including earthquake via AHP and GIS, among which Chen et al. (2001), Rashed and Weeks (2003), Cutter et al. (2003), Servi (2004), Ebert et al. (2009), Schmidtlein et al. (2008), Botero Fernán-dez (2009) and Nefeslioglu et al. (2013) are only examples.
This study takes into account three seismic scenarios for the faults of the Mosha, North Tehran and Rey in order to assess the seismic vulnerability of Tehran. To this end, not only the geotechnical index but also a review of the litera-ture, expert opinions and the experience of past earthquakes in Iran, other influential factors in seismic vulnerability of cities including the type of structures, population distribu-tion in different age groups, level of educadistribu-tion and distance to road network (further categorized in three indicators: struc-tural, social, and physical distance to needed facilities and distance from dangerous ones) are taken into account. Each of these criteria (indicators) is divided into alternatives
(sub-indicators). In the next step, to get the weight of each crite-rion or alternative, AHP and pairwise comparison of criteria and alternatives are used. Then, using GIS, the criteria or al-ternatives are combined regarding the gained weight. Finally, three seismic vulnerability maps are developed for Tehran based on three possible earthquakes resulting from the activ-ity of each aforementioned fault.
2 The study area
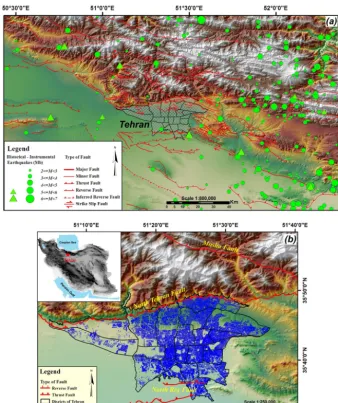
Tehran lies at latitudes 51◦150 and 51◦350E and longitudes 35◦330and 35◦500N. The city has experienced a major wave of migration due to economic, welfare and cultural issues during the last 3 decades. The metropolitan’s population has increased from around 11 million in 2006 to 12 million in 2011 (average growth of 1.44 per year) (Seifolddini and Mansourian, 2014). Tehran officials have taken many factors into consideration in addition to the population and divided the city into 22 districts to provide better services to the citi-zens. Tehran is located in the southern foothills of the Alborz mountain range in the vicinity of three active faults, Mosha, North Tehran and Rey, that make the city seismically a mat-ter of concern. The analysis of the earthquakes up to 100 km away (Fig. 1a and b) shows the seismic status of the scope.
As the catalogs of earthquakes and seismotectonic studies show, earthquake occurrences in Tehran are partly the result of movement on three active faults.
1. The Mosha Fault, first described as a reverse fault dip-ping north by Berberian et al. (1985) and Tchalenko et al. (1974), is∼175 km long at the southern edge of the Alborz mountains. The Mosha Fault is composed of three segments with slightly different orientations (Landgraf et al., 2009). The strike of this fault changes in the western segment from∼EW to WNW–ESE in the central segment. The eastern segment strikes WNW– ESE (Tatar et al., 2012) and has left-lateral motion along a north-dipping plane (Allen et al., 2004; Bachmanov et al., 2004) but with a slight normal component (Ritz et al., 2006). The Mosha has been the cause of big historical earthquakes with magnitudes of over 6.5 in AD 958 (Ms∼7.7), AD 1665 (Ms∼6.5) and AD 1830 (Ms∼7.1) (Berberian and Yeats, 2001).
Figure 1. The study area and the distribution of historical and instrumental earthquakes up to 100 km away from Tehran.
855–856 (exact year is uncertain) and 1177, respec-tively, occurred due to ruptures of this fault (Ashtari Ja-fari, 2010).
3. The faults of North and South Rey, named originally by Berberian et al. (1985), are 20 and 16.5 km, re-spectively. They are 3 to 5 km away from each other. Since the eastern and western strikes of these faults are buried under the young fluvial sediments, their dip is unrecognizable from the ground; however, the geomet-ric shape of it on the ground shows north-dipping thrust faults. According to the studies conducted by Berberian and Yeats (1999, 2001), the occurrence of the histori-cal earthquakes of 855 (Ms∼7.1), 864 (Ms∼5.3), 958 (Ms∼7.7) and 1177 (Ms∼7.2) could be the result of these faults’ movements.
Due to the high seismic activity rate and the high probabil-ity of earthquakes occurring with high magnitude in Tehran on one hand, and the density of structures, violation of con-struction codes and standards, improper distribution of ser-vices and facilities as well as dense population in some parts on the other hand, the city has increased seismic vulnerabil-ity. Therefore, developing a vulnerability map of earthquakes for Tehran in order to identify the vulnerable and safe areas in the city and suitably plan to prevent or decrease the potential effects of earthquake occurrence is of utmost importance.
3 Methodology and data analysis 3.1 Indicators
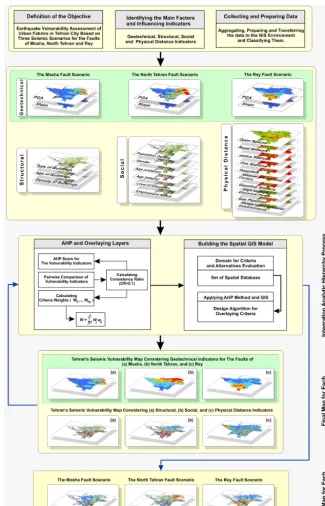
Figure 2. The process of seismic vulnerability assessment using AHP technique.
seismic vulnerability must be studied by taking all influential factors into account (Fig. 2). Thus, after reviewing the litera-ture, regulations, viewpoints and experiences of experts and taking the available data for influential indicators including geotechnical, structural, social and physical distance from needed facilities and away from dangerous ones into consid-eration for each residential fabric in census units (Fig. 1b), the main sub-indicators are extracted as follows.
3.1.1 Geotechnical indicators
on a complex combination of the earthquake’s magnitude, duration, frequency content, the distance between the earth-quake’s hypocenter and site, soil condition in the scope, etc. Thus, one of the important criteria while designing the struc-tures, and also one of the main reasons for the building dam-ages, is the peak ground acceleration (PGA) while an earth-quake occurs (Ghodrati Amiri et al., 2010; Babayev et al., 2010; Arma¸s, 2012; Moradi et al., 2013; Panahi et al., 2014). In Iran, the peak ground acceleration which had destroyed or damaged the structures was 0.1g(during the Golbaf earth-quake in 1981) and about 1gduring the Zanjiran (1994) and Bam (2003) earthquakes (Jafargandomi et al., 2004). Surface slope is another geotechnical factor that must be taken into consideration since it is one of the influential factors in the instability of steep slopes and landslide occurrence in allu-vial and sand soil, especially under a structure’s foundation, while an earthquake occurs (Keefer, 1984; Plafker and Gal-loway, 1989; Harp and Wilson, 1995; Jibson et al., 2000; Lee and Talib, 2005; Lee and Pradhan, 2006; Jibson, 2007; Mah-davifar et al., 2002; Safari and Moghimi, 2010; Sarvar et al., 2011). This issue can lead to destruction and an increase in damages.
3.1.2 Structural indicators
Regarding the fact that many structures in Tehran are quite old and constructed by traditional methods, and also be-cause most newly constructed structures have violated the construction codes and regulations (BHRC, 2005) and there has been inconsistent application of building regulations, the structures are quite vulnerable to earthquakes. This is made clear by a glimpse at the earthquakes which have happened over the last few decades in Iran. Therefore, considering the studies done and regarding the limitation of accumu-lated data in Tehran, using structural factors such as types of buildings per census unit (structure and building mate-rials), age of buildings and density of buildings per census unit can have a determining role on seismic vulnerability (Tavakoli and Tavakoli, 1993; JICA and CEST, 2000; Cut-ter et al., 2003; Chakraborty et al., 2005; Ebert and Kerle, 2008; Ghayamghamian and Khanzade, 2008; Ebert et al., 2009; Lantada et al., 2009; Ishita and Khandaker, 2010; ¸Sen, 2010; Alinia and Delavar, 2011; Martins et al., 2012; Arma¸s, 2012; Panahi et al., 2014).
3.1.3 Social indicators
Demographic context of a society during an earthquake oc-currence or after is very important since these factors have a direct relationship with the increase or decrease in tolls and facilitation of relief operations. Unfortunately, during recent years earthquake experts have not paid enough attention to this issue and not enough studies have been conducted with this viewpoint on the last earthquakes. To resolve this, we
studied seismic vulnerability articles with population as the main issue; the main sub-indicators extracted are as follows: 1. population density (Chakraborty et al., 2005; Bac-Bronowicz and Maita, 2007; Ishita and Khandaker, 2010; Martins et al., 2012; Peng, 2012; Arma¸s and Gavri¸s, 2013),
2. gender (Fothergill, 1996; Granger et al., 1999; Ford-ham, 2000; Wisner, 2003; Cutter et al., 2003; Haki et al., 2004; Arma¸s, 2012; Martins et al., 2012),
3. age (children) (King and MacGregor, 2000; Cutter et al., 2003; Dwyer et al., 2004; Steinführer and Kuhlicke, 2007; Birkmann et al., 2008; Holand et al., 2011; Kuh-licke et al., 2011; Arma¸s, 2012),
4. age (elderly) (King and MacGregor, 2000; Cutter et al., 2003; Dwyer et al., 2004; Steinführer and Kuhlicke, 2007; Thieken et al., 2007; Birkmann, 2007; Reid et al., 2009; Flanagan et al., 2011; Holand et al., 2011; Åström et al., 2011; Rocklöv et al., 2011; Arma¸s, 2012; Zebar-dast, 2013),
5. level of education (Buckle, 2000; Cutter et al., 2003; Adger et al., 2004; Haki et al., 2004; Velasquez and Tan-hueco, 2005; Schneiderbauer, 2007; Ebert and Kerle, 2008; Holand et al., 2011; Kuhlicke et al., 2011; Arma¸s, 2012; Martins et al., 2012),
6. employment status (Dwyer et al., 2004; Haki et al., 2004; Bac-Bronowicz and Maita, 2007; Ebert and Kerle, 2008; Holand et al., 2011; Kuhlicke et al., 2011; Zebardast, 2013).
3.1.4 Indicator of physical distance to needed facilities and away from dangerous facilities
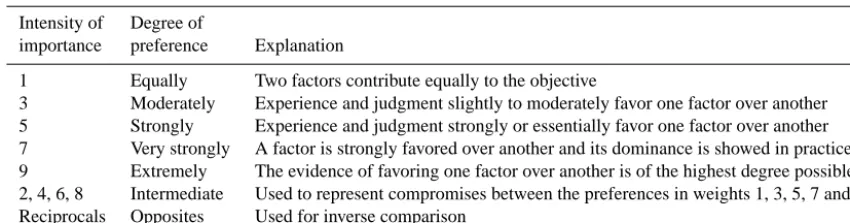
Table 1. Scale of preference between two parameters in AHP (Saaty, 1977).
Intensity of Degree of
importance preference Explanation
1 Equally Two factors contribute equally to the objective
3 Moderately Experience and judgment slightly to moderately favor one factor over another 5 Strongly Experience and judgment strongly or essentially favor one factor over another 7 Very strongly A factor is strongly favored over another and its dominance is showed in practice 9 Extremely The evidence of favoring one factor over another is of the highest degree possible 2, 4, 6, 8 Intermediate Used to represent compromises between the preferences in weights 1, 3, 5, 7 and 9 Reciprocals Opposites Used for inverse comparison
Table 2. Random inconsistency indices (RI) forn=1, 2, . . . , 12 (Saaty, 1980, 2000).
N 1 2 3 4 5 6 7 8 9 10 11 12
RI 0.00 0.00 0.58 0.90 1.12 1.24 1.32 1.41 1.45 1.49 1.52 1.54
of Tehran: accessibility and distance to open spaces (parks and barren areas), road networks, police stations, fire sta-tions, hospitals and disaster management centers and dis-tance from gasoline stations, high-voltage electrical power transmission lines, gas pipelines and danger-prone industrial establishments (Rashed and Weeks, 2003; Servi, 2004; Al-tan et al., 2004; Hellström, 2007; Ebert and Kerle, 2008; Hizbaron et al., 2011; Arma¸s, 2012; Nan and Hong, 2013). 3.2 Methodology
The combined method of GIS–AHP is a suitable tool for spa-tial issues including seismic vulnerability of cities. A range of qualitative and quantitative indicators must be taken into account to investigate the seismic vulnerability of an area; as Fig. 2 shows, one of the main steps to realize this goal is using AHP to consider the indicators simultaneously with regard to the importance of each and using GIS to manage, integrate and analyze the data.
AHP, originally introduced by Saaty (1977), is a multi-criteria decision-making technique. AHP is a weighted linear summation method in which the weight is gained through pairwise comparison of elements in a level of decision-making. AHP allows the decision-makers to change a com-plex problem to a hierarchical structure by identifying the elements of decision-making such as goal, criteria (indica-tors) and alternatives (sub-indica(indica-tors), prioritizing and re-lating them to each other and simplifying the analysis and decision-making. Generally, AHP has three stages:
1. developing a tree structure for indicators and sub-indicators
2. pairwise comparison of indicators and sub-indicators and identifying the weight of each
3. estimation of consistency between judgments and weights.
With AHP, after identifying the influential indicators and sub-indicators (Fig. 2) for determining the weight of each factor, a systematic and structured comparison is used. This kind of comparison reduces the conceptual complexity of the problem under investigation; furthermore, the weight of each factor is determined regarding its level of importance, as shown in Table 1 and introduced by Saaty (1977). In other words, in AHP, weights show the dominance and intensity of importance of each factor in relation to the others in a hierar-chical structure.
The most important issue in AHP and weighting the fac-tors is the consistency between judgments and weights. In order to determine this, consistency index (CI) is used as de-fined by Saaty (2000):
CI=λmax−N
N−1 , (1)
whereλmaxis the largest or principal eigenvalue of the pair-wise comparison matrix andN is the order of the matrix. Saaty (1980) has identified the average random consistency index (RI) according to Table 2 and calculated the consis-tency ratio (CR) as follows:
CR=CI
RI. (2)
If CR=0, the pairwise comparison matrix is completely con-sistent, and if CR>0.1, the matrix is inconsistent and pair-wise comparison must be repeated between indicators and sub-indicators.
The final weight is gained by linear adding of given weights to indicators and sub-indicators (according to Eq. 3) and overlaying weighted raster layers.
W= n X
j=1
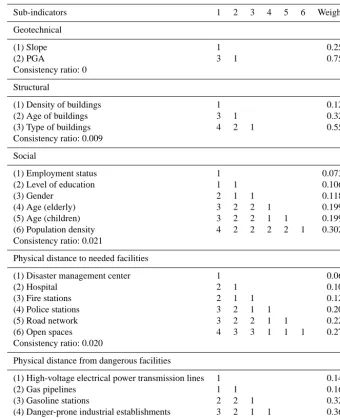
Table 3. Pairwise comparison matrix, sub-indicator weights and consistency ratio of the data layers.
Sub-indicators 1 2 3 4 5 6 Weights
Geotechnical
(1) Slope 1 0.250
(2) PGA 3 1 0.750
Consistency ratio: 0
Structural
(1) Density of buildings 1 0.122
(2) Age of buildings 3 1 0.320
(3) Type of buildings 4 2 1 0.558
Consistency ratio: 0.009
Social
(1) Employment status 1 0.0733
(2) Level of education 1 1 0.1063
(3) Gender 2 1 1 0.1183
(4) Age (elderly) 3 2 2 1 0.1999
(5) Age (children) 3 2 2 1 1 0.1999
(6) Population density 4 2 2 2 2 1 0.3022
Consistency ratio: 0.021
Physical distance to needed facilities
(1) Disaster management center 1 0.064
(2) Hospital 2 1 0.109
(3) Fire stations 2 1 1 0.126
(4) Police stations 3 2 1 1 0.202
(5) Road network 3 2 2 1 1 0.223
(6) Open spaces 4 3 3 1 1 1 0.272
Consistency ratio: 0.020
Physical distance from dangerous facilities
(1) High-voltage electrical power transmission lines 1 0.147
(2) Gas pipelines 1 1 0.163
(3) Gasoline stations 2 2 1 0.326
(4) Danger-prone industrial establishments 3 2 1 1 0.362
Consistency ratio: 0.006
Table 4. Pairwise comparison matrix, indicator weights and
consis-tency ratio of the data layers.
Indicators 1 2 3 4 Weights
Physical distance 1 0.150
Social 1 1 0.200
Structural 2 1 1 0.282
Geotechnical 3 2 1 1 0.368
Consistency ratio: 0.027
whereWshows the weight of each pixel in the vulnerability map,Wj shows the normalized weight of each indicator,wij is the weight of theith sub-indicator with respect to thejth indicators andnis the total influential indicators.
4 Results
Using AHP and determining the importance of each used sub-indicator and indicator in the study, with respect to four main indicators (Tables 3 and 4), the results (Figs. 3 and 4) are as follows.
4.1 Geotechnical indicators
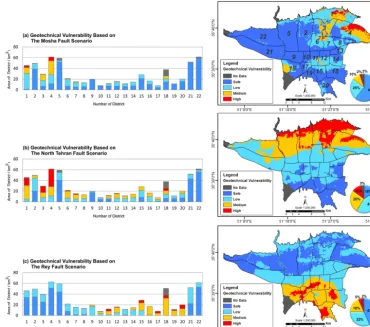
Figure 3. Tehran’s seismic vulnerability map considering geotechnical indicator for the faults of (a) Mosha, (b) North Tehran and (c) Rey.
Fault becomes more active, Tehran will experience the PGA of 200g(JICA and CEST, 2000). According to Fig. 3a, if an earthquake occurs as a result of this fault’s movement, the geotechnical vulnerability in parts of districts 4, 1, 3, 6 and 7 (2 %) will be high due to their vicinity to the fault. Nonethe-less, 60 % of Tehran will be safe.
Since the North Tehran Fault passes through all north-ern districts of Tehran, and a part of residential structures in districts 1, 3 and 4 are constructed on it or its hanging wall, these areas are prone to direct disruption of the earth-quake fault. The investigations show in the case of activity at this fault, the amount of PGA in the northern area will be around 400g. The more we move towards the south, the more the PGA decreases due to distance from the source of earthquake, reaching around 200g(JICA and CEST, 2000). Studies also show that the slope changes from 30 to 0◦from north towards south. This makes structures in the northern areas more instable. Therefore, according to Fig. 3b, 12 % of the city scope has a high geotechnical vulnerability, mostly in northern Tehran and near the active North Tehran Fault. However, districts 22, 21, 5, 2 and 9 (16 %) are least vulnera-ble due to a decrease in PGA as a result of distance from fault
and decrease in probability of hillside downfall as a result of decreased slope.
Finally, the existence of the Rey Fault and lineaments in south and southwestern Tehran shows that southern parts of the metropolitan including districts 20, 18, 15, 17, 11, 19 and 12 (5 %) will experience major damage in the case that the Rey Fault becomes active (Fig. 3c). One reason for this vul-nerability is not only because southern parts of Tehran are near earthquake source but also because of the alluvial na-ture of these areas and high underground water level; PGA is high there. As a result, geotechnical vulnerability will in-crease when an earthquake occurs. In districts 22, 4, 5, 2, 1, 3, 21 and 6, despite high slope in some parts, the low PGA and location on bedrock will decrease vulnerability.
4.2 Structural indicators
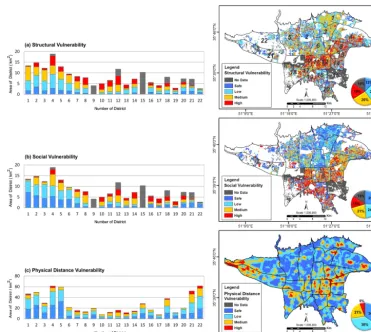
Figure 4. Tehran’s seismic vulnerability map considering (a) structural, (b) social and (c) physical distance indicators.
and cement block or stone), sun-dried mud brick and wooden structures are common, leading to increased vulnerability of these areas. Another point is that these areas are host to peo-ple with lower incomes. Thus, cheap and low-quality struc-tures as well as the lack of inspections have multiplied the structural vulnerability of the area.
However, a great part of districts 2, 4, 5, 3, 1, 6, 20, 21 and 22 are less vulnerable despite the existence of old and tra-ditional areas, because there has been proper space for con-struction and affluent people have constructed structures in accordance with standard 2800 (BHRC, 2005). The result is newly built structures constructed with concrete and steel by professional engineers. In addition, low-density construction in these areas has helped reduce structural vulnerability.
4.3 Social indicators
The social vulnerability map (Fig. 4b) and extracted statis-tics show a considerable part of districts 12, 14, 4, 16, 10, 17, 18, 19, 20 and 8 (15 %) is highly vulnerable. Due to low in-comes, the residents live in small houses and, consequently, population density is high. Also, due to the high birth rate, children density increased in these areas (SCI, 2015).
Contrastingly, parts of districts 1, 2, 4, 3, 6, 5 and 7 are among the safest and least vulnerable areas since the resi-dents have high incomes and bigger houses, which leads to a lower population density. Also, the new and almost modern context of the neighborhood has included fewer old people. The trend toward keeping distance from traditional culture and living a modern life among residents has made them less willing to marry and, as a result, to have children.
4.4 Physical distance indicators
Figure 5. Seismic vulnerability map of Tehran related to three scenarios of (a) the Mosha, (b) the North Tehran and (c) the Rey faults.
5 Discussion
Tehran is located among a number of seismic faults with the high potential of earthquake occurrence. Its residential ar-eas are highly vulnerable to earthquakes due to dense pop-ulation, too many structures and violations of construction codes. Thus, in the case of an earthquake, the possibility of a severe damage will increase dramatically. Therefore, devel-oping a seismic vulnerability map is a useful step to take in order to decrease the severity of a major earthquake impact in the area; construction of the vital structures such as hos-pitals and schools. In highly vulnerable areas can be limited and establishment of vital roads can be banned or subject to observing all earthquake engineering principles, seismic reg-ulations and construction codes.
This study has extracted information layers in the form of geotechnical, structural, social and physical distance indica-tors according to three scenarios. Then, using AHP and GIS, three vulnerability maps have been developed for Tehran in case an earthquake occurs as a result of movements on the Mosha, North Tehran and Rey faults. The safe and vulnera-ble areas in each scenario are as follows.
1. The Mosha Fault scenario: in this scenario, the seis-mic vulnerability is low due to the distance of the fault from Tehran (around 36 km). Thus, as in Fig. 5a, 6 % of the city has high, 16 % medium and 29 % low vulnerability, and 34 % is safe. Therefore, with regard to area, districts 12, 4 and 11 have high vulnerability and districts 5, 2, 4, 21, 20, 6, 3, 1 and 19 are safer.
2. The North Tehran Fault scenario: regarding the North Tehran Fault, the northern part of the city will experience a great deal of damage since the fault is located on the northern margin of the city and a great population resides on the fault or its hanging wall. Therefore, as in Fig. 5b 16, 27 and 28 % of Tehran areas have high, medium and low vulnerability, respectively, and 14 % are safe. Thus, districts 1, 3, 4, 12, 5, 8, 10, 2 and 11 are highly vulnerable, while districts 20, 6, 16, 4, 14, 19 and 21 are safest.
and southern areas. Regarding the results (Fig. 5c), the level of seismic vulnerability in the scope of Tehran is 10 % with high, 21 % with medium and 27 % with low vulnerability. 27 % is also safe. Thus, districts 12, 11, 10, 18, 17, 14, 20 and 16 have high vulnerability, and districts 2, 1, 4, 3, 5, 6, 21 and 22 are among the safest areas.
6 Conclusions
Developing a seismic vulnerability map is one of the most efficient methods for developing cities in seismically active areas. To this end, and since various factors are involved, four factors of geotechnical, structural, social and physical distance must be investigated simultaneously. For realizing this, developing a spatial GIS model and using the proper algorithm for categorization of factors and weighting them according to AHP seem vital. In this paper, three scenarios were investigated due to Tehran’s location in the vicinity of the three active faults of Mosha, North Tehran and Rey. To cover the probable damages as a result of each fault’s activity, each one is investigated separately with the following results: 1. The spatial GIS model is a proper tool for creating a database and developing a proper algorithm regarding the relationship among influential factors in determin-ing the seismic vulnerability. The final outcome of this process will be more comprehensive and more close to reality.
2. After the identification of each area’s vulnerability in each scenario, proper planning and paying close atten-tion to low-cost methods such as increasing the poten-tial for rescue, training, providing facilities for relocat-ing densely populated areas and seismic retrofittrelocat-ing of available structures must be at hand.
3. In all scenarios, parts of central Tehran including dis-tricts 10, 11 and 12 are vulnerable. Since these areas have included business centers, high priority must be given to them.
4. The lack of suitable data regarding districts 15 and 18 has led to failure in determining the seismic vulnerabil-ity. However, regarding low income of families, immi-gration and existence of geotechnical hazards in these areas, field studies must be performed to acquire needed data and determine the seismic vulnerability of these ar-eas.
5. The inclusion of factors such as peak ground velocity, surface fault rupture, subsidence, landslide and lique-faction that have a determining role in seismic vulnera-bility makes the map closer to reality.
Edited by: O. Katz
Reviewed by: one anonymous referee
References
Adger, W. N., Brooks, N., Bentham, G., Agnew, M., and Eriksen, S.: New indicators of vulnerability and adaptive capacity, in: Rep. 7, Tyndall Centre for Climate Change Research, Norwich, UK, 128 pp., 2004.
Alinia, H. S. and Delavar, M. R.: Tehran’s seismic vulnerability classification using granular computing approach, Appl. Geo-mat., 3, 229–240, doi:10.1007/s12518-011-0068-7, 2011. Allen, M., Jackson, J., and Walker, R.: Late Cenozoic
reorgani-zation of the Arabia-Eurasia collision and the comparison of short-term and long-term deformation rates, Tectonics, 23, 1–16, doi:10.1029/2003TC001530, 2004.
Almasri, M. N.: Assessment of intrinsic vulnerability to contamina-tion for Gaza coastal aquifer, Palestine, J. Environ. Manage., 88, 577–593, doi:10.1016/j.jenvman.2007.01.022, 2008.
Altan, M., Özturk, F., and Ayday, C.: Preliminary earthquake risk management strategy plan of Eskisehir, Turkey by using GIS, in: 7th AGILE Conference on Geographic Information Science, 29 April–1 May 2004, Heraklion, Greece, 83–89, 2004.
Arma¸s, I.: Multi-criteria vulnerability analysis to earthquake haz-ard of Bucharest, Romania, Nat. Hazhaz-ards, 63, 1129–1156, doi:10.1007/s11069-012-0209-2, 2012..
Arma¸s, I. and Gavri¸s, A.: Social vulnerability assessment us-ing spatial multi-criteria analysis (SEVI model) and the So-cial Vulnerability Index (SoVI model) – a case study for Bucharest, Romania, Nat. Hazards Earth Syst. Sci., 13, 1481– 1499, doi:10.5194/nhess-13-1481-2013, 2013.
Ashtari Jafari, M.: Statistical prediction of the next great earthquake around Tehran, Iran, J. Geodyn., 49, 14–18, doi:10.1016/j.jog.2009.07.002, 2010.
Åström, D. O., Forsberg, B., and Rocklöv, J.: Heat wave impact on morbidity and mortality in the elderly popu-lation: a review of recent studies, Maturitas, 69, 99–105, doi:10.1016/j.maturitas.2011.03.008, 2011.
Babayev, G., Ismail-Zadeh, A., and Le Mouël, J.-L.: Scenario-based earthquake hazard and risk assessment for Baku (Azerbaijan), Nat. Hazards Earth Syst. Sci., 10, 2697–2712, doi:10.5194/nhess-10-2697-2010, 2010.
Bac-Bronowicz, J. and Maita, N.: Mapping social vulner-ability to earthquake hazards by using analytic hierar-chy process (AHP) and GIS in Tehran City, available at: http://www.gisdevelopment.net/application/natural_hazards/ earthquakes/ma0777.htm (last access: 18 July 2014), 2007. Bachmanov, D. M., Trifonov, V. G., Hessami, K. T., Kozhurin, A.
I., Ivanova, T. P., Rogozhin, E. A., Hademi, M. C., and Jamali, F. H.: Active faults in the Zagros and central Iran, Tectonophysics, 380, 221–241, doi:10.1016/j.tecto.2003.09.021, 2004.
Berberian, M.: Active faulting and tectonics of Iran, in: Za-gros, Hindu Kush, Himalaya: Geodynamic Evolution, edited by: Gupta, H. K. and Delany, F. M., Geodynamics Series 3, Ameri-can Geophysical Union, Washington, D.C., 33–69, 1981. Berberian, M. and Yeats, R. S.: Patterns of historical earthquake
rupture in the Iranian Plateau, B. Seismol. Soc. Am., 89, 120– 139, 1999.
Berberian, M., Qorashi, M., Arzhangravesh, B., and Mohajer Ash-jai, A.: Recent tectonics, seismotectonics, and earthquake-fault hazard study of the Greater Tehran region: contribution to the seismotectonics of Iran, Part V, Geol. Surv. of Iran, Rep. 56, Ge-ological Survey of Iran, Iran, 1985.
BHRC (Building and Housing Research Center): Iranian Code of Practice for Seismic Resistant Design of Buildings, publication PNS-253, 3rd Edn., Building and Housing Research Center Iran, Iran, 135 pp., 2005.
Birkmann, J.: Risk and vulnerability indicators at different scales: applicability, usefulness and policy implications, Environ. Haz-ards, 7, 20–31, doi:10.1016/j.envhaz.2007.04.002, 2007. Birkmann, J., Krings, S., and Renaud, F.: Assessment of
vulner-ability to floods at local level with a special focus on human-environmental systems and critical infrastructures, in: Proceed-ings of the 4th International Symposium on Flood Defense, 6–8 May 2008, Toronto, 2008.
Botero Fernández, V.: Geo-information for measuring vulnerability to earthquake: a fitness for use approach, PhD thesis, ITC, the Netherlands, 158 pp., 2009.
Buckle, P.: Assessing resilience and vulnerability in the context of emergencies: guidelines, Dept. of Human Services, Victoria, Melbourne, Australia, 20 pp., 2000.
Chakraborty, J., Tobin, G. A., and Montz, B. E.: Population evac-uation: assessing spatial variability in geophysical risk and so-cial vulnerability to natural hazards, Nat. Hazards Rev., 6, 23–33, 2005.
Chen, K., Blong, R., and Jacobson, C.: MCE-Risk: integrat-ing multi-criteria evolution and GIS for risk decision-makintegrat-ing in natural hazards, Environ. Modell. Softw., 16, 387–397, doi:10.1016/S1364-8152(01)00006-8, 2001.
Chen, M. F., Tzeng, G. H., and Ding, C. G.: Combining fuzzy AHP with MDS in identifying the preference sim-ilarity of alternatives, Appl. Soft. Comput., 8, 110–117, doi:10.1016/j.asoc.2006.11.007, 2008.
Cutter, S. L., Boruff, B. J., and Shirley, W. L.: Social vulnera-bility to environment hazards, Soc. Sci. Quart., 84, 242–261, doi:10.1111/1540-6237.8402002, 2003.
Dwyer, A., Zoppou, C., Nielsen, O., Day, S., and Roberts, S.: Quan-tifying social vulnerability: a methodology for idenQuan-tifying those at risk to natural hazards, Australian Government, Geoscience Australia, Rep. 2004/14, 101 pp., available at: http://www.ga. gov.au/image_cache/GA4267.pdf, last access: 21 June 2014. Ebert, A. and Kerle, N.: Urban social vulnerability assessment
using object-oriented analysis of remote sensing and GIS data. A case study for Tegucigalpa, Honduras, in: Proceed-ings of the XXIth ISPRS Congress, Beijing, China, 3–11 July 2008, XXXVII, 1307–1311, available at: http://www.isprs.org/ proceedings/XXXVII/congress/7_pdf/7_WG-VII-7/02.pdf (last access: 18 July 2014), 2008.
Ebert, A., Kerle, N., and Stein, A.: Urban social vulnerability as-sessment with physical proxies and spatial metrics derived from air- and spaceborne imagery and GIS data, Nat. Hazards, 48, 275–294, doi:10.1007/s11069-008-9264-0, 2009.
Flanagan, B. E., Gregory, E. W., Hallisey, E. J., Heitgerd, J. L., and Lewis, B.: A Social vulnerability index for disaster man-agement, J. Homeland Security and Emergency Manman-agement, 8, 1547–7355, doi:10.2202/1547-7355.1792, 2011.
Fordham, M.: The place of gender in earthquake vulnerability and mitigation, in: Proceedings of Second EuroConference on Global Change and Catastrophic Risk Management: Earthquake Risks in Europe, 6–9 July 2000, Luxemburg, Austria, 2000.
Fothergill, A.: Gender, risk, and disaster, Int. J. Mass Emerg. Dis-ast., 14, 33–56, 1996..
Fu, B., Lei, X., Hessami, K., Ninomiya, Y., Azuma, T., and Kondo, H.: A new fault rupture scenario for the 2003 Mw 6.6 Bam
earthquake, SE Iran: insights from the high-resolution Quick-Bird imagery and field observations, J. Geodyn., 44, 160–172, doi:10.1016/j.jog.2007.02.002, 2007.
Gamper, C. D., Thöni, M., and Weck-Hannemann, H.: A conceptual approach to the use of Cost Benefit and Multi Criteria Analysis in natural hazard management, Nat. Hazards Earth Syst. Sci., 6, 293–302, doi:10.5194/nhess-6-293-2006, 2006.
Ghayamghamian, M. R. and Khanzade, K.: Buildings classifica-tion and determinaclassifica-tion of damage funcclassifica-tion for non-engineering in Bam city, J. Seismol. Earthq. Eng., 39, 2–10, 2008.
Ghodrati Amiri, G., Kazemiashtiani, V., and Razavian Amrei, S. A.: Seismic hazard analysis and obtaining peak ground acceleration (PGA) for Arak Region, Iran, Asian J. Civ. Eng., 11, 183–206, 2010.
Granger, K., Jones, T., Leiba, M., and Scott, G.: Community risk in Cairns: a multi-hazard risk assessment, Geol. Surv. of Aus-tralia, Rep. 1, available at: http://www.ga.gov.au/image_cache/ GA4164.pdf (last access: 21 July 2014), 19 pp., 1999.
Haki, Z., Akyüerek, Z., and Düezgüen, ¸S.: Assessment of social vulnerability using geographic information systems: Pendik, Is-tanbul case study, in: 7th AGILE Conference on Geographic Information Science, Heraklion, Greece, 29 April–1 May, 413–423, available at: http://www.agile-online.org/Conference_ Paper/CDs/agile_2004/papers/4-3-4_Haki.pdf (last access: 18 July 2014), 2004.
Harp, E. L. and Wilson, R. C.: Shaking intensity thresholds for rock falls and slides: evidence from the 1987 Whittier Narrows and superstition hills earthquake strong-motion records, B. Seismol. Soc. Am., 85, 1739–1757, 1995.
Hellström, T.: Critical infrastructure and systemic vulnerabil-ity: towards a planning framework, Saf. Sci., 45, 415–430, doi:10.1016/j.ssci.2006.07.007, 2007.
Hessami, K., Koyi, H., Talbot, C. J., Tabasi, H., and Shabanian, E.: Progressive unconformities within an evolving foreland fold-thrust belt, Zagros Mountains, J. Geol. Soc. London, 158, 969– 981, doi:10.1144/0016-764901-007, 2001.
Hessami, K., Nilforoushan, F., and Talbot, C. J.: Active deformation within the Zagros Mountains deduced from GPS measurements, J. Geol. Soc. Lond., 163, 143–148, 2006.
Hizbaron, D. R., Baiquni, M., Sartohadi, J., Rijanta, R., and Coy, M.: Assessing social vulnerability to seismic hazard through spa-tial multi-criteria evaluation in Bantul District, Indonesia, in: Conference of Development on the Margin, 5–7 October 2011, Bonn, Germany, 2011.
Holand, I. S., Lujala, P., and Rød, J. K.: Social vulnerability assess-ment for Norway: a quantitative approach, Norw. J. Geogr., 65, 1–17, doi:10.1080/00291951.2010.550167, 2011.
Jafargandomi, A., Fatemi Aghda, S. M., Suzuki, S., and Nakamura, T.: Strong ground motions of the 2003 Bam Earthquake, South-east of Iran (Mw=6.5), B. Earthq. Res. I. Tokyo, 79, 47–57,
2004.
Jibson, R. W.: Regression models for estimating coseis-mic landslide displacement, Eng. Geol., 91, 209–218, doi:10.1016/j.enggeo.2007.01.013, 2007.
Jibson, R. W., Harp, E. L., and Michael, J. A.: A method for pro-ducing digital probabilistic seismic landslide hazard maps, Eng. Geol., 58, 271–289, doi:10.1016/S0013-7952(00)00039-9, 2000. JICA (Japan International Cooperation Agency) and CEST (Cen-ter for Earthquake and Environmental Studies of Tehran, Tehran Municipality): The Study on Seismic Microzoning of the Greater Tehran Area in the Islamic Republic of Iran, Final Report, Iran, 403 pp., 2000.
Keefer, D. K.: Landslides caused by earthquakes, Bull. Geol. Soc. Am., 95, 406–421, 1984.
King, D. and MacGregor, C.: Using social indicators to measure community vulnerability to natural hazards, Aust. J. Emerg. Manage., 15, 52–57, 2000.
Kuhlicke, C., Scolobig, A., Tapsell, S., Steinführer, A., and De Marchi, B.: Contextualizing social vulnerability: findings from case studies across Europe, Nat. Hazards, 58, 789–810, doi:10.1007/s11069-011-9751-6, 2011.
Landgraf, A., Ballato, P., Strecker, M. R., Friedrich, A., Tabatabaei, S. H., and Shahpasandzadeh, M.: Fault-kinematic and ge-omorphic observations along the North Tehran Thrust and Mosha Fasham Fault, Alborz mountains Iran: implications for fault-system evolution and interaction in a changing tectonic regime, Geophys. J. Int., 177, 676–690, doi:10.1111/j.1365-246X.2009.04089.x, 2009.
Lantada, N., Pujades, L. G., and Barbat, A. H.: Vulnerability index and capacity spectrum based methods for urban seis-mic risk evaluation. A comparison, Nat. Hazards, 51, 501–524, doi:10.1007/s11069-007-9212-4, 2009.
Lee, S. and Pradhan, B.: Probabilistic landslide hazards and risk mapping on Penang Island, Malaysia, J. Earth Syst. Sci., 115, 661–672, doi:10.1007/s12040-006-0004-0, 2006.
Lee, S. and Talib, J. A.: Probabilistic landslide susceptibil-ity and factor effect analysis, Environ. Geol., 47, 982–990, doi:10.1007/s00254-005-1228-z, 2005.
Mahdavifar, M. R., Solaymani, S., and Jafari, M. K.: Landslides triggered by the Avaj, Iran earthquake of 22 June 2002, Eng. Geol., 86, 166–182, doi:10.1016/j.enggeo.2006.02.016, 2002. Mahdi, T. and Mahdi, A.: Reconstruction and retrofitting of
build-ings after recent earthquakes in Iran, Procedia Eng., 54, 127–139, doi:10.1016/j.proeng.2013.03.012, 2013.
Malczewski, J.: GIS and multi-criteria decision analysis, John Wi-ley, Toronto, 1999.
Malczewski, J.: GIS-based multi-criteria decision analysis: a sur-vey of the literature, Int. J. Geogr. Inf. Sci., 20, 703–726, doi:10.1080/13658810600661508, 2006.
Martins, V. N., Silva, D. S., and Cabral, P.: Social vulnerability as-sessment to seismic risk using multi-criteria analysis: the case study of Vila Franca do Campo (São Miguel Island, Azores, Portugal), Nat. Hazards, 62, 385–404, doi:10.1007/s11069-012-0084-x, 2012.
Moradi, M., Delavar, M. R., and Moshiri, B.: Sensitivity analysis of ordered weighted averaging operator in earthquake
vulnerabil-ity assessment, in: Proceedings of SMPR 2013 Conference, 5–8 October 2013, Tehran, Iran, 277–282, 2013.
Nan, Z. and Hong, H.: Social vulnerability for public safety: a case study of Beijing, China, Chinese Sci. Bull., 58, 2387–2394, doi:10.1007/s11434-013-5835-x, 2013.
National Report of the Islamic Republic of Iran on Disaster Reduc-tion; in: World Conference on Disaster Reduction, 18–22 Jan-uary 2005, Kobe, Hyogo, Japan, available at: http://www.unisdr. org/2005/mdgs-drr/national-reports/Iran-report.pdf (last access: 24 July 2014), 2005.
Nazari, H.: Analyse de la Tectonique Récente et Active Dans l’Alborz Central et la Région de Téhéran: Approche Morphotec-toniqueet Paléoseismologique, PhD thesis, University of Mont-pellier II, 247 pp., 2006.
Nefeslioglu, H. A., Sezer, E. A., Gokceoglu, C., and Ayas, Z.: A Modified Analytical Hierarchy Process (M-AHP) approach for decision support systems in natural hazard assessments, Comput. Geosci., 59, 1–8, doi:10.1016/j.cageo.2013.05.010, 2013. Panahi, M., Rezaie, F., and Meshkani, S. A.: Seismic
vulnera-bility assessment of school buildings in Tehran city based on AHP and GIS, Nat. Hazards Earth Syst. Sci., 14, 969–979, doi:10.5194/nhess-14-969-2014, 2014.
Peng, Y.: Regional earthquake vulnerability assessment using a combination of MCDM methods, Ann. Oper. Res., 15, 1–16, doi:10.1007/s10479-012-1253-8, 2012.
Plafker, G. and Galloway, J. P.: Lessons learned from the Loma Pri-eta, California earthquake of 17 October 1989, Geol. Surv. of US, Circular No. 1045, 56 pp., available at: http://pubs.usgs.gov/circ/ 1989/1045/report.pdf (last access: 20 June 2014), 1989. Rashed, T. and Weeks, J.: Assessing vulnerability to earthquake
hazards through spatial multi-criteria analysis of urban areas, Int. J. Geogr. Inf. Sci., 17, 547–576, 2003.
Reid, C. E., O’Neill, M. S., Gronlund, C. J., Brines, S. J., Brown, D. G., Diez-Roux, A. V., and Schwartz, J.: Mapping community determinants of heat vulnerability, Environ. Health Persp., 117, 1730–1736, doi:10.1289/ehp.0900683, 2009.
Ritz, J. F., Nazari, H., Ghassemi, A., Salamati, R., Shafei, A., Solay-mani, S., and Vernant, P.: Active Transtension in Central Alborz: a new insight of the Northern Iran–Southern Caspian Geodynam-ics, Geology, 34, 477–480, doi:10.1130/G22319.1, 2006. Rocklöv, J., Ebi, K., and Forsberg, B.: Mortality related to
tem-perature and persistent extreme temtem-peratures: a study of cause-specific and age-stratified mortality, Occup. Environ. Med., 68, 531–536, doi:10.1136/oem.2010.058818, 2011.
Saaty, T. L.: A scaling method for priorities in hierarchical structures, J. Math. Psychol., 15, 234–281, doi:10.1016/0022-2496(77)90033-5, 1977.
Saaty, T. L.: The analytic hierarchy process: Planning, Priority Set-ting, Resource Allocation, McGraw-Hill, New York, 287 pp., 1980.
Saaty, T. L.: The Fundamentals of Decision Making and Priority Theory with the Analytic Hierarchy Process, RWS Publications, Pitsburg, USA, 478 pp., 2000.
Safari, A. and Moghimi, A.: Geomorphologic assessment of urban development and vulnerability caused by landslide in mountain-ous hillsides of Tehran metropolis, J. Phys. Geogr. Res., 41, 53– 71, 2010.
combina-tion of RADIUS, TOPSIS and AHP models, J. Civil Eng. Urban., 1, 39–48, 2011.
Schmidtlein, M. C., Deutsch, R. C., Piegorsch, W. W., and Cutter, S. L.: A sensitivity analysis of the Social Vulnerability Index, Risk Anal., 28, 1099–1114, doi:10.1111/j.1539-6924.2008.01072.x, 2008.
Schneiderbauer, S.: Risk and vulnerability to natural disasters-from broad view to focused perspective: theoretical background and applied methods for the identification of the most endangered populations in two case studies at different scales, PhD thesis, Freien Universität, Berlin, Germany, 121 pp., 2007.
SCI (Statistical Center of Iran): available at: http://www.amar.org. ir/Default.aspx?tabid=133, last access: 4 March 2015.
Seifolddini, F. and Mansourian, H.: Spatial–temporal pattern of urban growth in Tehran megapole, J. Geogr. Geol., 6, 70–80, doi:10.5539/jgg.v6n1p70, 2014.
Sella, G. F., Dixon, T. H., and Mao, A.: REVEL: a model for recent plate velocities from space geodesy, J. Geophys. Res., 107, ETG 11-1–ETG 11-30, doi:10.1029/2000JB000033, 2002.
¸Sen, Z.: Rapid visual earthquake hazard evaluation of existing buildings by fuzzy logic modeling, Expert Syst. Appl., 37, 5653– 5660, doi:10.1016/j.eswa.2010.02.046, 2010.
Servi, M.: Assessment of vulnerability to earthquake hazards using spatial multi-criteria analysis: Odunpazari, Eskisehir case study, MS thesis, Middle East Technical University, Turkey, 94 pp., 2004.
Steinführer, A. and Kuhlicke, C.: Social vulnerability and the 2002 Flood, Country Report Germany (Mulde River), Leipzig, Rep. T11-07-08, 164 pp., available at: http://www.floodsite.net/html/ partner_area/project_docs/task_11_m11.3_p44_final.pdf (last access: 21 June 2014), 2007.
Suárez-Vega, R., Santos-Peñate, D.R., Dorta-González, P., and Rodríguez-Díaz, M.: A multi-criteria GIS based procedure to solve a network competitive location problem, Appl. Geogr., 31, 282–291, doi:10.1016/j.apgeog.2010.06.002, 2011.
Tatar, M., Hatzfeld, D., Abbassi, A., and Yamini Fard, F.: Mi-croseismicity and seismotectonics around the Mosha fault (Central Alborz, Iran), Tectonophysics, 544–545, 50–59, doi:10.1016/j.tecto.2012.03.033, 2012.
Tavakoli, B. and Tavakoli, S.: Estimating the vulnerability and loss functions of residential buildings, Nat. Hazards, 7, 155–171, doi:10.1007/BF00680428, 1993.
Tchalenko, J. S., Berberian, M., Iranmanesh, H., Baily, M., and Arsovsky, M.: Tectonic framework of the Tehran region, Geol. Surv. of Iran, Rep. 29, available at: http://manuelberberian. com/Tchalenkoetal,1974-Tehran.pdf (last access: 18 June 2014), 1974.
Thieken, A. H., Kreibich, H., Müller, M., and Merz, B.: Coping with floods: preparedness, response and recovery of flood-affected residents in Germany in 2002, Hydrolog. Sci. J., 52, 1016–1037, doi:10.1623/hysj.52.5.1016, 2007.
Velasquez, G. and Tanhueco, R. M. T.: Social risk and disaster risk assessment, in: Know Risk, International Strategy for Disaster Reduction, United Nations, Tudor Rose, Geneva, 91–92, 2005. Vernant, Ph., Nilforoushan, F., Hatzfeld, D., Abbassi, M. R., Vigny,
C., Masson, F., Nankali, H., Martinod, J., Ashtiani, A., Bayer, R., Tavakoli, F., and Chéry, J.: Present-day crustal deformation and plate kinematics in the Middle East constrained by GPS measure-ments in Iran and northern Oman, Geophys. J. Int., 157, 381–398, doi:10.1111/j.1365-246X.2004.02222.x, 2004.
Wisner, B.: Turning knowledge into timely and appropri-ate action: Reflections on IADB/IDEA Program on Dis-aster Risk Indicators, IDB/IDEA Program of Indicators for Risk Management, National University of Colombia, Manizales, available at: http://idea.unalmzl.edu.co/documentos/ BenWisnerEMBarcelonaNov2003.pdf (last access: 21 June 2014), 2003.