© 2017 IJSRST | Volume 3 | Issue 3 | Print ISSN: 2395-6011 | Online ISSN: 2395-602X Themed Section: Science and Technology
A Stress Test for Stock Price : In Indonesia Example
Aris Wahyu Kuncoro and Rinni Meidiyustiani
Lecture Universitas Budi Luhur, Jakarta, Indonesia
ABSTRACT
This study aims to see how the application of the endurance test application can be used in calculating the price of shares in 10 companies in Indonesia. This study uses a model of test method of resistance, better known by the name of stress testing, at 10 Integration stock companies that are considered a good category in Indonesia. From the research that has been done can be concluded that firms should make better use of stress testing.
Keywords: Financial Crisis, Risk Management, Stress Tests, Value At Risk.
I.
INTRODUCTION
Endurance testing is a simulation technique often used in the banking industry. It is also used on the portfolio of assets and liabilities to determine their reactions to different financial situations. In addition, the endurance test is used to measure how a particular stress will affect the company, industry, or specific portfolios. The stress test is a simulation model that is typically computer-generated to test hypothetical scenarios; however, a highly customized stress testing methodology is also often used.
Stress testing for risk management in the management of the investment portfolio, the endurance test is also commonly used to determine the risk of the portfolio and setting the hedging strategy to reduce losses. Portfolio managers use a proprietary internal stress testing and test program to manage their portfolios against market events and potential events.
Assets and liabilities match the stress test is also widely used in business and investment management. Assets and liabilities match the stress tests can be used by companies to ensure that proper internal controls and procedures are being taken. Pension and insurance portfolio also abundantly utilize stress testing to ensure an efficient stream of cash flows and the level of payments.
Federal regulators have prescribed three scenarios of economic and financial markets, but encourages
agencies to use at least five scenarios that reflect improbable events, including those that are considered impossible by management. In the future, we can also expect to see a test of endurance ordered as a follow-up report regularly scheduled periodically. Regulators look at vulnerabilities in the report that may start asking for additional stress tests based on these results. Stress test scenario, therefore, can be very specific to each bank. Furthermore, the Bank will be expected to provide rapid test results often in a few days. Regulators, therefore, will assume that the Bank will organize their risk data in a way that enables a quick response.
In this study, the authors divides the structure of the paper as follows. In the first part, the author presents the introduction, then Section 2 briefly reviews the theory. Section 3 discusses the data and methodology of the study. The analysis is in Section 4. Section 5 discusses the conclusions of the study.
II.
METHODS AND MATERIAL
A. Literature Review
The Basel Committee is very clear about the importance of stress testing for market risk management. Pillar 2 of Basel II originals (BIS, 2006) states that the bank must ensure that it has sufficient capital to cover the results of the endurance test, providing capital stress the benefits of supervisory discretion. But all of that was done before the subprime crisis. The last revision of the market risk framework proposes to make capital stress probabilistic (ie VaR-based) and take it under one’s pillar (BIS, 2009b).
Most of the stress tests worldwide is probabilistic. For example, BIS (2005) published the results of the stress tests among 64 Banks and securities companies from 16 countries. This indicates that the sensitivity analysis is the most common form of the endurance test, followed by a hypothetical scenario generation and history of each. It also noted that the general practitioner who loaned was ambivalent about the need to assign a probability (BIS, 2005). Additional survey, conducted by the FSA in the United Kingdom (FSA, 2005), also showed that there was no consensus on the estimated probability of extreme scenarios. In contrast, the Bank prefers to capture the effects of stress by combining hypothetical scenarios and historical data, such as historical price changes ons. More recently, RMA also conducted a survey of 45 large financial institutions regarding market risk (Garritt et al., 2007). He found that, in addition to just one, all of them used scenario analysis (especially history) to catch the tail risk.
Special Endurance Test nations also focus on the analysis of scenarios and sensitivity. Stress tests on French banks (De Bandt and oung, 2004) and the components of their income (Coffinet et al., 2009) have been based on sensitivity analyzes. Some sensitivity stress tests have been performed on the Bank of
Germany (Deutsche Bundesbank, 2003, 2004). A survey of stress tests in the European country, by the IMF (International Monetary Fund) (Moretti et al., 2008), also showed that only 8 of the 42 countries have used stress tests to estimate VaR interest rate risk. Only 6 of the 31 participants using VaR for the foreign exchange risk. However, in the past, researchers at the Bank of England (Haldane et al., 2007) and our Fed (of Indonesia) (Federal Reserve, 2009) have attached a probability estimate of stress scenarios.
So, on the one hand, the Bank uses VaR in the normal market. On the other hand, they chose a scenario analysis of abnormal losses, but it can not compare the two estimates. This is because they do not know how the original distribution is affected by stressful event (s). To resolve this problem, Berkowitz (1999) showed that the probability must be assigned to the stress scenarios, showing their relative loads in the distribution of the composite. The new distribution is the probability-weighted combination of the original return and resilience scenario. It is now easy to figure out the stress of quantile VaR desired. But Aragones et al. (2001) and Dowd (2005, Chapter 4) also known that stress shocks may be so great that even the 99% VaR may not be able to capture the impact. Therefore, VaR should complemented with ES, which considers only losses beyond VaR.
Can VaR model composites be used for the test of endurance? A survey by Perignon and Smith (2010b) found that 73% of the global bank ma-first tooth expressed their VaR methodology between 1996 and 2005, using a simple HS. The author offers two reasons for its popularity. First, the banks want to avoid the risk models. For large and complex portfolios driven by thousands of risk factors, they do not want to rely on the estimated time of various volatilities and correlations. Instead, they used the nonparametric estimation HS as VaR method flexible. Second, the Bank and the regulator does not want internal estimates of capital differ much from day to day. Since HS is simple using the same conditional distribution again, changed for one or two years, estimates of internal capital remained stable.
B. Research Method
The following stock data are to be analyzed in this study: Table 1: List of stocks and quantity
Stock Code Quantity Price Volume Stock
Rp Rp %
PT Kalbe Farma KLBF 100 314.795 31,480 11.6%
PT Bank Mandiri BMRI 500 4.168 2,084 0.8%
PT Bank BNI BBNI 2000 15.94 31,880 11.8%
PT Wijaya Karya WIKA 1000 69.88 69,880 25.8%
PT Adaro ADRO 2000 13.31 26,620 9.8%
PT Bank BCA BBCA 1230 28.14 34,612 12.8%
PT Bank BRI BBRI 250 43 10,750 4.0%
PT Bank agro BRI AGRO 127 84.69 10,756 4.0%
PT Indofarma INAF 100 64.61 6,461 2.4%
PT Kimia Farma KAEF 1500 31.16 46,740 17.2%
Total 271,262 100.0%
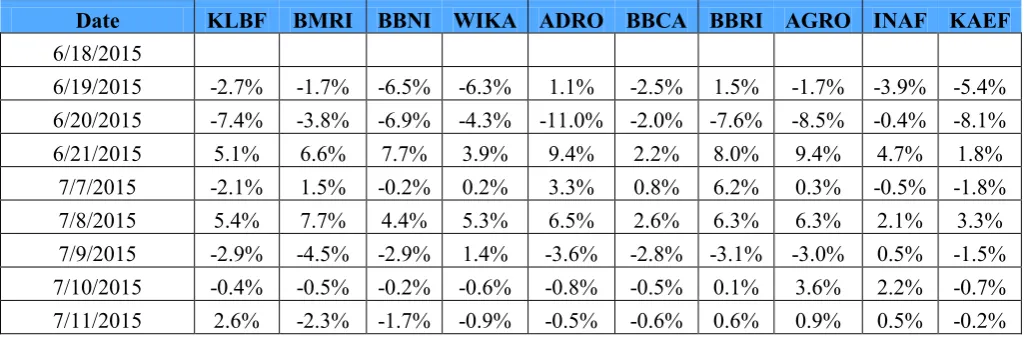
The following attachments are of stock price changes as of the time that will be analyzed 06/18/2015 until 07/08/2015.
Table 2: List of stocks per time transactions
Date KLBF BMRI BBNI WIKA ADRO BBCA BBRI AGRO INAF KAEF
6/18/2015
6/19/2015 -2.7% -1.7% -6.5% -6.3% 1.1% -2.5% 1.5% -1.7% -3.9% -5.4% 6/20/2015 -7.4% -3.8% -6.9% -4.3% -11.0% -2.0% -7.6% -8.5% -0.4% -8.1%
6/21/2015 5.1% 6.6% 7.7% 3.9% 9.4% 2.2% 8.0% 9.4% 4.7% 1.8%
7/7/2015 -2.1% 1.5% -0.2% 0.2% 3.3% 0.8% 6.2% 0.3% -0.5% -1.8%
7/8/2015 5.4% 7.7% 4.4% 5.3% 6.5% 2.6% 6.3% 6.3% 2.1% 3.3%
7/9/2015 -2.9% -4.5% -2.9% 1.4% -3.6% -2.8% -3.1% -3.0% 0.5% -1.5% 7/10/2015 -0.4% -0.5% -0.2% -0.6% -0.8% -0.5% 0.1% 3.6% 2.2% -0.7%
7/11/2015 2.6% -2.3% -1.7% -0.9% -0.5% -0.6% 0.6% 0.9% 0.5% -0.2%
B. Technical Data Analysis
In this study the authors used data analysis techniques stress testing. From the data analysis model that is in use, we will be able to calculate the level of volatility within one day and 10 days with Name R Software.
III. RESULTS AND DISCUSSION
From the available data and in doing testing using stress testing analysis model, we obtain the following results for the average stock exchange every week by standard deviation, as presented in Table 3 below:
Table 3: Results of average weekly stock exchange
KLBF BMRI BBNI WIKA ADRO BBCA BBRI
AGR
O INAF KAEF
Average change in weeks
0.687 %
0.233 %
0.086 %
0.481 %
0.914 %
0.455 %
0.200 %
1.199 %
0.941 %
-0.051
% Standard
deviation
4.165 %
3.693 %
4.313 %
2.750 %
5.098 %
1.725 %
4.590 %
4.583 %
1.999 %
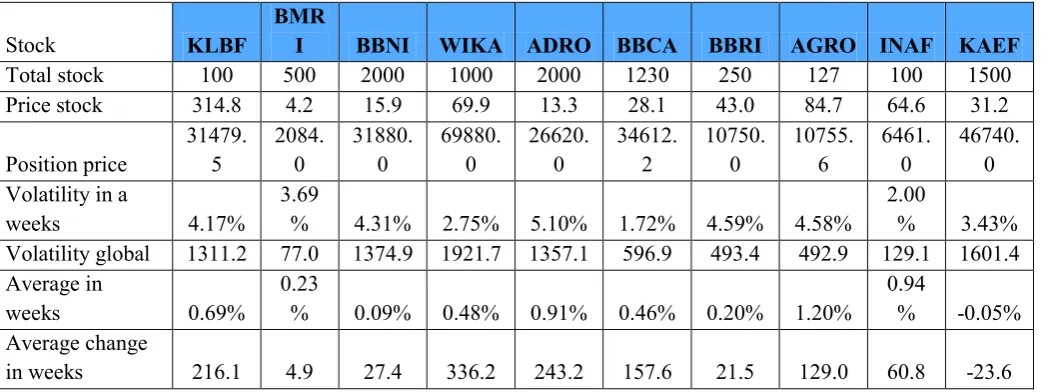
Table 4: Results of the average stock exchange volatility weekly basis
Stock KLBF
BMR
I BBNI WIKA ADRO BBCA BBRI AGRO INAF KAEF
Total stock 100 500 2000 1000 2000 1230 250 127 100 1500
Price stock 314.8 4.2 15.9 69.9 13.3 28.1 43.0 84.7 64.6 31.2
Position price
31479. 5
2084. 0
31880. 0
69880. 0
26620. 0
34612. 2
10750. 0
10755. 6
6461. 0
46740. 0 Volatility in a
weeks 4.17%
3.69
% 4.31% 2.75% 5.10% 1.72% 4.59% 4.58%
2.00
% 3.43%
Volatility global 1311.2 77.0 1374.9 1921.7 1357.1 596.9 493.4 492.9 129.1 1601.4 Average in
weeks 0.69%
0.23
% 0.09% 0.48% 0.91% 0.46% 0.20% 1.20%
0.94
% -0.05% Average change
in weeks 216.1 4.9 27.4 336.2 243.2 157.6 21.5 129.0 60.8 -23.6
Table 5: Results of the average stock exchange every 10 week basis volatility
10 volatility in weeks total
4146.45 5
243.34 7
4347.92
4 6077.06
4291. 4
1887. 6
1560. 3
1558. 8
408.3 6
5064. 2
Average change
in 10 weeks 2161.31
48.526 7
274.265 2
3362.18 6
2432. 3
1576.
4 215
1289. 8
608.2 4
-236.1
7
Table 6: Results of the correlation matrix of the value of shares Matrix Correlation
Name stock price KLBF BMRI BBNI WIKA ADRO BBCA BBRI AGRO INAF KAEF
KLBF 1.00 0.75 0.69 0.90 0.97 0.75 -0.04 0.91 0.82 0.83
BMRI 0.75 1.00 0.66 0.82 0.84 0.52 0.33 0.72 0.66 0.62
BBNI 0.69 0.66 1.00 0.64 0.74 0.77 0.12 0.81 0.69 0.72
WIKA 0.90 0.82 0.64 1.00 0.93 0.74 0.09 0.89 0.89 0.75
ADRO 0.97 0.84 0.74 0.93 1.00 0.78 0.06 0.94 0.86 0.79
BBCA 0.75 0.52 0.77 0.74 0.78 1.00 -0.11 0.90 0.91 0.72
BBRI -0.04 0.33 0.12 0.09 0.06 -0.11 1.00 0.05 0.00 -0.08
AGRO 0.91 0.72 0.81 0.89 0.94 0.90 0.05 1.00 0.95 0.76
INAF 0.82 0.66 0.69 0.89 0.86 0.91 0.00 0.95 1.00 0.65
KAEF 0.83 0.62 0.72 0.75 0.79 0.72 -0.08 0.76 0.65 1.00
Table 7: Results of volatility for 1 week
Volatility ($) 1 weeks
10 weeks
KLBF 1311.22 4146.45
BMRI 76.95 243.35
BBNI 1374.93 4347.92
WIKA 1921.74 6077.06
ADRO 1357.05 4291.38
BBCA 596.90 1887.56
BBRI 493.40 1560.26
AGRO 492.93 1558.79
INAF 129.13 408.36
Table 8 : Results of the average volatility of the stock and the stock exchange for 1 & 10 weeks
1 weeks 10 weeks
Volatility portfolio 8089.673 25581.8 Average change in
portfolio 1173.199 11732
Portfolio VaR -12133.1 -30346.3
From the results in the table above it can be concluded that: the possibility of loss of the portfolio on 10 stocks of companies in the analysis is not more than (in US $) -12.133 or -4.47% for the week, and the possibility of loss on the portfolio of 10 stocks of companies which are used in the analysis is not more than (in US $) 30.346, or 11.19% for a period of 10 weeks, with the probabilty in use 0.95.
IV. CONCLUSION
Terms testing stress testing is a new reality for financial organizations. While some other communities welcomed it more prescriptively in terms of supervision and operating expenses historically, it can be understood more fully now. One of the new focuses of risk management is to present approaches that can be considered to make an input bias to financial institutions, in order to thinking about risk management approaches that are biased in use. Stress testing, in particular, can be a strategic tool that gives a view that is valuable and timely in the possibility of vulnerability, as well as in the opportunity of profitability, and even for product performance. Many organizations are still hampered by legacy processes and a set of point solutions that hinder adherence to testing stress testing and other requirements, as well as discouraging support agility in using a risk management approach. It is time for financial institutions to rethink their risk management architecture to lead to the provision of strategic benefits.
V.
REFERENCES
[1]. Alexander, C. (2008b). Market Risk Analysis. Value-At-Risk Models, vol. IV. John Wiley and Sons, Chichester, England.
[2]. Alexander, C., and Sheedy, E. (2008). Developing a stress testing framework based on market risk models. Journal of Banking and Finance 32 (10), 2220–2236.
[3]. Allen, L., et, al. (2004). Understanding Market, Credit and Operational Risk: The Value at Risk Approach. Blackwell Publishing, Oxford, UK. [4]. Bank of International Settlements. (2009).
Principles for sound stress testing practices and supervision - final paper”; website http://www.bis.org, pp. 2-18
[5]. Bali, T.G. (2003). An extreme value approach to estimating volatility and value-at-risk. Journal of Business 76 (1), 83–108.
[6]. Bali, T.G., and Theodossiou, P. (2007). A conditional-SGT-VaR approach with alternative GARCH models. Annals of Operations Research 151 (1), 241–267.
[7]. Bams, D., et, al. (2005). An evaluation framework for alternative VaR models. Journal of International Money and Finance 24 (6), 944– 958.
[8]. Basu, S. (2006). The impact of stress scenarios on VaR and expected shortfall, SSRN Working Paper No. 1091462.
[9]. Basu, S. (2009). Stress testing for market risk: A comparison of VaR methods, SSRN Working Paper No. 1370965.
[10]. Berkowitz, J. (1999). A coherent framework for stress-testing, Board of Governors of the Federal Reserve, July.
[11]. Bhattacharyya, M., et, al. (2008). Conditional VaR estimation using Pearson’s type IV distribution. European Journal of Operational Research 191 (2), 386–397.
[12]. BIS. (2005). Stress testing at major financial institutions: Survey results and practice, January, Bank for International Settlements.
[13]. BIS. (2006). International convergence of capital measurement and capital standards: A revised framework, June, Bank for International Settlements.
[14]. BIS. (2009a). Principles for sound stress testing practices and supervision, May, Bank for International Settlements.
[16]. BIS. (2009c). Analysis of the trading book quantitative impact study, October, Bank for International Settlements.
[17]. BIS. (2010). Guidance on the application of the 2004 CPSS-IOSCO Recommendations for Central Counterparties to OTC derivatives CCPs, Consultative Report, May, Bank for International Settlements.
[18]. Coffinet, J., et, al. (2009). Stress Testing French Banks’ Income Subcomponents, Working paper No. 242, Banque de France, August.
[19]. De Bandt, O., and Oung, V. (2004). Assessment of ‘‘stress tests’’ conducted on the French banking system, Financial Stability Review, Banque de France, No. 5, pp. 55–72.
[20]. Duffie, D., and Pan, J.. (1997). An Overview of Value-at-Risk, Journal of Derivatives, Spring, pp. 7–49.
[21]. Gençay, R., et, al.. (2003). High volatility, thick tails and extreme value theory in value-at-risk estimation. Insurance: Mathematics and Economics 33 (2), 337–356.
[22]. Gibson, M.S. (2001). Incorporating Event Risk into Value-at-Risk, Finance and Economics Discussion Series 2001-17, Board of Governors of the Federal Reserve, April.
[23]. Krokhmal, P., et, al. (2011). Modeling and optimization of risk. Surveys in Operations Research and Management Science 16 (2), 49– 66.
[24]. Ma, C., and Wong, W.K. (2010). Stochastic dominance and risk measure: A decision-theoretic foundation for VaR and C-VaR. European Journal of Operational Research 207 (2), 927–935.
[25]. Pérignon, C., and Smith, D. (2010a). Diversification and value-at-risk. Journal of Banking and Finance 34 (1), 55–66.
[26]. Pérignon, C., and Smith, D. (2010b). The level and quality of value-at-risk disclosure by commercial banks. Journal of Banking and Finance 34 (2), 362–377.
[27]. Zangari, P. (1997). What risk managers should know about mean reversion and jumps in prices. RiskMetrics Monitor, Fourth Quarter, pp. 12–41.
Additional website :