National Conference on Advances in Engineering and Applied Science (NCAEAS) 29th January 2018
Organized by : Anjuman College of Engineering and Technology (ACET) Nagpur, Maharashtra, India, In association with
International Journal of Scientific Research in Science and Technology
Transmission Pricing in Deregulated Power System for IEEE 30
bus
Mrs. Archana Shirbhate*, Mr. V. K. Chandrakar, Mr. R. M. Mohril
Department of Electrical Engineering, RTM Nagpur University, Nagpur, Maharashtra, India
ABSTRACT
Transmission pricing has become a major issue in the discussions about the deregulated electricity markets. Consequently, open access to the transmission system is one of the basic topics to allow competition among participants in the energy market. Transmission costs have an important impact on relative competition among participants in the energy market as well as on short- and long-term economic efficiencies of the whole electricity industry, although they represent only close to 10% of the energy market price. This paper deals with the design and tests of a transmission pricing method based on the optimal circuit prices derived from the economically adapted network (EAN). The computation and the analysis of the nodal prices have been realized with a modified version of MATPOWER. In addition this paper analyses the consequences of system participants’ bid behaviour and its effect on the systems congestion. Prices derived from the EAN have the advantage of being in tune with the maximum revenue allowed to the owner of transmission assets and simplifying the optimal allocation of transmission costs among participants. Beginning from the conceptual design, the proposed method is tested on a three-bus network and on the IEEE 30-bus reliability test system.
Keywords: OPF, Power Market, Transmission Pricing, IEEE bus
I.
INTRODUCTION
The move of the electric power industry in the last years from a monopolistic to a deregulated form has resulted in various changes in the operation of the electrical networks. Among them the congestion management has been a very important concern for an ISO. The management of such situations consists of two basic elements, which are interdependent. The first concerns the redispatching of generation or even more partial curtailment of loads, which may be necessary. The second is the pricing of the congestion and the proper cost allocation among the market participants. In order to deal with this
International Journal of Scientific Research in Science and Technology (www.ijsrst.com)
Volume 4 | Issue 3 | IJSRST/Conf/NCAEAS/ACET/2018/01
288
the analysis of the nodal prices have been realized with a modified version of MATPOWER program Moreover, the consumers’ elasticity has been also taken into consideration in this version. This paper explores the share of market participants in the nodal congestion component. In particular, producers’ impact is focused on. In addition the paper deals with the gaming of the producers. The consequences of their bid behaviour and its effect on the system congestions are discussed. Results from simulated experiments are presented on a 30-bus test system as well as on a realistic high voltage network In the restructured electricity market, Transmission Company plays a vital role due to its involvement in the determination of charges for transmission pricing. In the traditional regulated power market, pricing have accounted for a small portion of the overall transmission network capacity usage. However, recent trends are stimulated renewed interest in pricing of transmission or distribution facilities of a system to transmit power of and for another entity. It is also states that, pricing is the use of some seller to buyer involving transmission network of a third party. Transmission cost is due to re-dispatching of generators and transmission losses [7] [8].
Transmission pricing is carried out:
1. To recover the capital and operating costs 2. To encourage efficient use and investments. 3. To provide equal opportunity to all users. 4. To offer a simple and understandable price
structure.
5. To easy implementation.
This paper analyses all eight pricing methodologies. Previously all these methods have been evaluated [7] but best method for pricing is not identified. Particularly, in this paper, we have tested pricing methodologies under various load conditions and Moreover, it is clear that Unused reverse MW-Mile method gives minimum pricing method even when
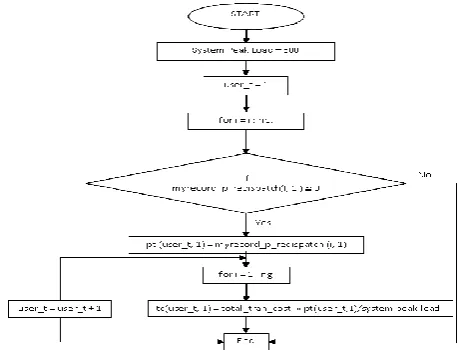
the load changes. The proposed has been tasted on IEEE 14 bus and IEEE 30 bus system using MATPOWER simulation programs. The working flow charts of eight pricing method has been presented in this paper. We have done the calculation in an optimal Power Flow solution. A Graphical representation of the allocation obtained by this method which is given in figures.
II.
METHODS OF TRANSMISSION PRICING
This section provides principles for transmission pricing. Although transmission costs represent only about 2 percent of investor-owned utilities operating expenses, they are nonetheless important. Workable competitive power markets require ready access to a network of transmission and distribution lines that connect regionally dispersed end-users with generators. Because power flows at one location impact electric transmission costs across the network, transmission pricing may not only determine who gets access and at what price but also encourage efficiencies in the power generation market [8].
Transmission constraints can prevent the most efficient plants from operating. These constraints also can determine the location of generation that affect the amount of power losses for transmission. Transmission prices that ignore these concepts will produce an inefficient system. Transmission pricing that considers transmission constraints (congestion pricing) should encourage the building of new transmission and/or generating capacity that will improve system efficiency.
2.1 Pricing Options
congested so that no more power can be transferred from a point of delivery to a point of receipt of power, thus more expensive generation may have to operate on one side of the transmission than the other. For a competitive market, regardless of the form of transmission pricing utilized, this would result in a difference in generation prices between the two locations. (If any low cost power generated on one side of a constraint could be sold at the higher price on the other side of the constraint, assuming the difference is more than the transmission cost, in the absence of the congestion.) The differences in electricity prices is the "economic price of transmission", which is related to the congestion cost and cost of losses. For such absence of congestion pricing for transmission service, the "economic rents" would represent a windfall to the generation suppliers that are able to sell through the congested interconnection. Hence, transmission prices will recover congestion rents from suppliers who are able to complete transactions through the constrained interface .
There are various ways to allocate revenues from congestion pricing. For example in California, such types of revenues are used to reduce the access fees that all transmission customers pay. Another proposal thought is to create a system of transmission congestion contracts. These would establish set of rights to either make power transfers or receive compensation for the inability to do so through redistribution of congestion rentals to the holders of transmission congestion contracts.
This paper evaluates the following eight transmission pricing algorithms:
a) Postage Stamp; b) MW-Mile (original); c) Unused absolute MW-Mile; d) Unused reverse MW-Mile;
e) Unused zero counter-flow MW-Mile; f) Used absolute MW-Mile;
g) Used reverse MW-Mile and
h) Used zero counter-flow MW-Mile.
a. The Postage Stamp Method
One of the traditional methods is the postage stamp method (PS), also known as the rolled-in method [12]. According to this method, the network usage from the side of a transaction is measured by the magnitude of the transaction Pi, without taking into account how the transaction affects the power flows over the various lines in the network[7]. The amount to be paid by transaction is:
∑
Where
K : the total cost to be covered by the market participants
PSi : the amount charged to participant according to the postage stamp method
Obviously, since the postage stamp method does not take distances into account, it leads to cross-subsidization of long-distance transactions by short-distance transactions. Despite this fact, this method is widely implemented because of its simplicity.
International Journal of Scientific Research in Science and Technology (www.ijsrst.com)
Volume 4 | Issue 3 | IJSRST/Conf/NCAEAS/ACET/2018/01
290
III.
RESULTS OF TRANSMISSION PRICING
PARAMETERS FOR IEEE 30 BUS CASE
STUDY
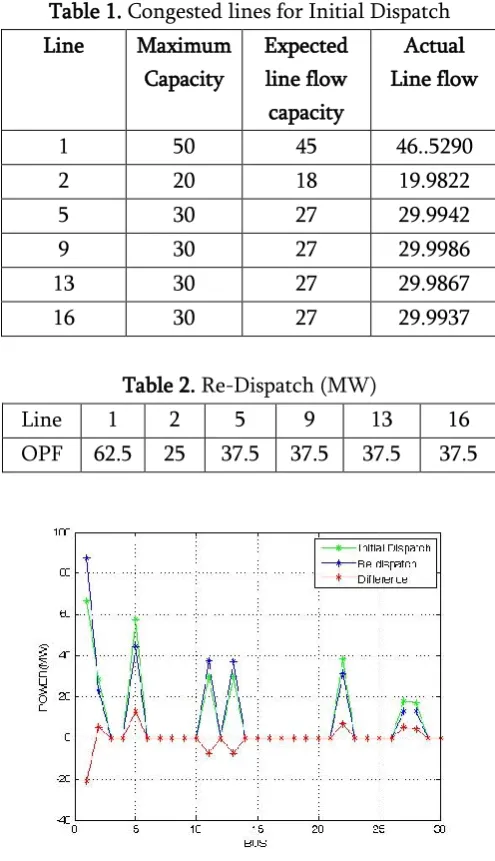
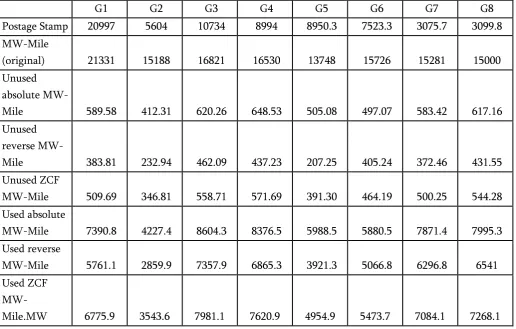
The single line diagram of IEEE-30 bus test system is shown in Figure 2. The system consists of 8 synchronous generators and the system has 21 load points. Associated flow results along with Transmission Pricing are given in Figures and Table as shown below. Table 1 and 2gives the idea about initial dispatch and re-dispatch value which is given in Fig.3 it also gives their differences. Table 8 provide the contribution of each generator and each load to the line flows under all methods. It illustrate the different results and characteristics between the pricing schemes for each pricing method. The obtained results are shown in Fig 4 This figure gives the solution for the minimum power transaction problems. Unused reverse Mw-mile method gives the minimum price. Fig4gives Transmission Pricing based on different pricing methods at Generator Buses tested under three conditions like on actual load, 5% increase in load and 10 % increase in load.. Tabular representation is given in table 8,table9 and table10. Analysis is that Unused reverse Mw-mile method gives the minimum price even if the load changes. Numerical examples are provided to compare the results using different pricing methodology. The both the case study, result indicates that unused reversed MW-mile method for transmission pricing is most suitable method.
Figure 2. Single Line Diagram of IEEE 30 bus test system
Table 1. Congested lines for Initial Dispatch
Line Maximum
Capacity
Expected line flow capacity
Actual Line flow
1 50 45 46..5290
2 20 18 19.9822
5 30 27 29.9942
9 30 27 29.9986
13 30 27 29.9867
16 30 27 29.9937
Table 2. Re-Dispatch (MW)
Line 1 2 5 9 13 16
OPF 62.5 25 37.5 37.5 37.5 37.5
National Conference on Advances in Engineering and Applied Science (NCAEAS) 29th January 2018
Organized by : Anjuman College of Engineering and Technology (ACET) Nagpur, Maharashtra, India, In association with
International Journal of Scientific Research in Science and Technology
Table 3. Tabulated Transmission Pricing based on different methods when load demand is actual
G1 G2 G3 G4 G5 G6 G7 G8
Postage Stamp 20997 5604 10734 8994 8950.3 7523.3 3075.7 3099.8
MW-Mile
(original) 21331 15188 16821 16530 13748 15726 15281 15000
Unused absolute
MW-Mile 589.58 412.31 620.26 648.53 505.08 497.07 583.42 617.16
Unused reverse
MW-Mile 383.81 232.94 462.09 437.23 207.25 405.24 372.46 431.55
Unused ZCF
MW-Mile 509.69 346.81 558.71 571.69 391.30 464.19 500.25 544.28
Used absolute
MW-Mile 7390.8 4227.4 8604.3 8376.5 5988.5 5880.5 7871.4 7995.3
Used reverse
MW-Mile 5761.1 2859.9 7357.9 6865.3 3921.3 5066.8 6296.8 6541
Used ZCF
MW-Mile.MW 6775.9 3543.6 7981.1 7620.9 4954.9 5473.7 7084.1 7268.1
Figure 4. Transmission Pricing based on different pricing methods at Generator Buses when load
demand is actual
IV.
CONCLUSION
International Journal of Scientific Research in Science and Technology (www.ijsrst.com)
Volume 4 | Issue 3 | IJSRST/Conf/NCAEAS/ACET/2018/01
292
scheduled, which is highly appreciated by both suppliers and customers. The results were tasted IEEE 30 bus system. Simulation were carried out in MATLAB. Here we find the TLR sensitivity and decide where we have to apply for solving congestion and then we verify the simulation results. It has been observed that from simulation results on various systems, clear possibility of optimized location of and relaxation of congestion. Perfect location of ease out congestion proves to be of technical as well as economical benefits.. For location leads to better results. The results are verified by MATPOWER.
V.
REFERENCES
[1]. Alireza Sedaghati , "Cost of Transmission System Usage Based on an Economi Measure” , IEEE Trans Power System vol. 21 , no. 2 , pp. 466-473 , May 2006
[2]. K. L. Lo , M. Y. Hassan ,"Assessment of MW-mile method for pricing transmission services : a negative flow-sharing approach", IET Journal,Transm,Distrib.,2007,1(6),pp.904-911 [3]. Fco. Javier Rubio-Oderiz & Ignacio J. Perez-Arriaga , "Marginal Pricing of Transmission Services: A Comparitive Analysis of Network Cost Allocation Methods", IEEE Trans Power System vol. 15 , no. 1 , pp. 448-454 , February 2000
[4]. M. W. Mustafa , H. Shareef ,"An Improved Usage Allocation Method for Deregulated Transmission Systems”. Conference Paper at Malaysia(e-mail:[email protected]).
[5]. Jiuping Pan , Yonael Teklu ,"Review of Usage-Based Transmission Cost Allocation Methods under Open Access "IEEE Trans Power System vol. 15 , no. 4 , pp. 1218-1224 , November 2000
[6]. L. G. Manescu , D. Rusinaru ,"Usage Based Allocation for Transmission Costs under Open Access” , IEEE Trans Power System vol. 15 , no. 4 , pp. 1-7 , Sep 2009
[7]. G. A. Orfanos , G. T. Tziasiou ,"Evaluation of Transmission Pricing Methodlogies for Pool Based Electricity Markets", IEEE Trans Power System vol. 15 , no. 4 , pp. 1218-1224 , November 2011
[8]. V. Sarkar , S. A. Khaparde , "Introduction to Loss-Hedging Financial Transmission Rights", IEEE Trans Power System vol. 24 , no. 2 , pp. 621-630 , May 2009 .
[9]. Milos Pantos , David Grgic ,"New Transmission Service Pricing Technique Based on Actual Power Flows” , Power Tech Conference, June 2003 .
[10]. A. R. Abhyankar , S. A. Soman ,"Optimization Approach to Real Power Tracing : An Application to Transmission Fixed Cost Allocation "IEEE Trans Power System vol. 21 , no. 3 , pp. 1350-1361 , Aug 2006 .