VARIATION IN LIQUID WASTE COMPOSITION SUPPLYING SELECTED
COLLECTION POINT
Elżbieta Halina Grygorczuk-Petersons1, Józefa Wiater1
1 Department of Technology in Engineering and Environmental Protection, Bialystok University of Technology, Wiejska 45, 15-351 Bialystok, Poland, e-mail: [email protected]; [email protected]
INTRODUCTION
Even at the present time, there is a specific
solution of the sewage system in the cities, i.e.
the no-outflow sewage system also called the
“no-network system”. In most cases, it serves as a temporary solution to the sewage system, at
a time when investments are ahead of the con -struction of the sewerage system or if there is no
economic justification for its construction [Kisiel, Bień 2005; Błażejewski, Nawrot 2009]. One of
the elements of such system is collection points. The obligation of their construction,
mainte-nance, and operation (individual or shared with other municipalities) is governed by the act re
-quiring municipalities to maintain cleanliness and order in their locations [Act 1996]. Preferably, the collection point should be located at a smallest distance from the accumulation of liquid wastes, and the best solution is considered to locate it in the sewage treatment plant. The advantage of the collection point located in the sewage system at a distance from sewage treatment plant is that in
-troduced impurities are mixed with sewage with -Volume 16, Issue 1, Jan. 2015, pages 147–152
DOI: 10.12911/22998993/600 Research Article
ABSTRACT
The problem of liquid wastes is still current not only in Poland, but also in the world. The primary source of liquid wastes are single-family and multi-family houses. To a lesser extent, public service or production facilities, mainly in urban areas, are equipped with no-outlet reservoirs. Low concentrations in liquid wastes and their high density are often some difficulty to work with not only by sewage treatment plants, but also collection points. Therefore, the knowledge of the composition of liquid wastes sup
-plied to the collection points is important. The paper presents the results of research as well as variability of concentrations of selected parameters of liquid wastes supplied to the collection point in Bialystok, that accepts both municipal and industrial sewage. Statistical processing of the obtained results and those derived from The Waterworks Bialystok showed the presence of high variability of total suspended matter and elec
-trolytic conductivity as well as organic impurities expressed as BOD5 and COD. Keywords: collection points, liquid wastes, composition variability, permissible value Received: 2014.08.28
Accepted: 2014.10.17 Published: 2015.01.02
in the network, thus they are diluted and homog
-enized [Tomczuk 2011b].
Liquid wastes transported to the collection point are mixtures of various organic and inor
-ganic matter dispersed in water, occurring in all states of matter. The degree of fragmentation of substances contained is very uneven. These may be large solid particles, fine particles of suspend
-ed solids, and emulsifi-ed colloidal and dissolv-ed substances. The pH of the liquid waste can be very different: from the acid through neutral to alkaline, depending on their chemical composi
-tion [Maksymowicz, Opęchowski 2006].
Concentrations of selected parameters of liq
-uid wastes, municipal and municipal-like ones,
are usually far above the concentration in the
wastewater influent through the sewage network,
because spontaneously occurring biological
pro-cesses leading to the degradation of organic mat
sediments of a very high hydration degree [Barto
-szewski et al. 2011].
Liquid wastes with large loads of biodegrad
-able organic compounds emit odor of hydrogen sulfide, have black-gray color, and after filtration,
are much less transparent than «fresh»
wastewa-ters [Maksymowicz, Opęchowski 2006].
At the same time, in such wastes under the influence of anaerobic processes occurring in no-outflow reservoirs (rotting processes), an increas
-ing in the concentration of selected parameters occurs. From sanitary point of view, this kind of wastes is very dangerous, because they contain
large amounts of rotting or fermenting organic
sub-stances, pathogenic bacteria and viruses, as well as all types of human and animal-origin parasites.
Liquid wastes from service facilities, public buildings, or industry, may also contain infectious organisms, hazardous and toxic substances of or
-ganic and inor-ganic character.
It should be noted that liquid wastes accu
-mulated in no-outflow reservoirs can be supplied to the collection point if this does not endanger
the health of the station’s service, construction,
and proper operation of equipment, or the sewage treatment plant. For this reason, knowledge of the composition of liquid waste delivered to the col
-lection point is extremely important.
Therefore, the work was undertaken, the pur
-pose of which was to determine the variability of the physicochemical composition of liquid wastes supplied to the collection point in Bialystok, that accepts both municipal and industrial sewage, mainly from the food industry.
MATERIALS AND METHODS
Characteristics of Liquid Wastes Collection point in Bialystok
Liquid wastes generated in Bialystok and the surrounding areas, should go to The Liquid Wastes Collection point, that was taken over from the City Government of Bialystok in 1992 by Bialystok Waterworks Ltd. The Collection point was a well sized 3.20×3.20 m, to which the liquid wastes were poured directly from vacuum trucks. They were then mixed with municipal-farming sewage sup
-plied by a collector with a diameter of 800 mm, from part of the district Jaroszówka, Wyżyny es
-tates, and the town Wasilkowo. As mixed wastes, they flew (also through a collector with a diameter of 800 mm) to the wastewater treatment plant.
A new-generation container of the collection point with corresponding equipment (flow-meter Danfoss, device for sampling and measurement
of wastewater pH, computer with appropriate
software) was installed in the collection point in March 2000.
In 2010–2013, the liquid wastes from average of 23 vacuum trucks were discharged into the col
-lection point during a day. The average monthly amount of wastes supplied to the collection point was approximately 2500 m3 at the permitted
quantity of 3500 m3/month [Memo 2011].
The collection point accepts liquid wastes gen
-erated by households and industrial plants (domi
-nated by the food industry), the provided docu
-mentation of the source of their origin and when they are not a threat to the safety and health of persons servicing the collection point and waste -water facilities. These wastes come mainly from
Bialystok, but a small part of them is transported from nearby communities (Wasilków, Zaścianki, Juchnowiec Kościelny, Choroszcz, Sokółka, Turośń Kościelna, Dobrzyniewo Duże).
The amount of introduced liquid wastes is de
-termined on the basis of indications of the mea
-suring device owned by the Company.
Waterworks Bialystok lead the control of liq
-uid wastes delivered to the collection point. This is done by control sampling during emptying the tank of the vacuum truck. Samples of liquid wastes from vacuum trucks are taken randomly. Sampling is done manually on the gravity pipe
-line. In case of exceeding the permitted contami
-nation indices in liquid wastes as defined in An
-nex 2 and 3 to the agreement on the supplying of liquid wastes to the collection point [Contract 2011], the company pays an extra fee and bears the cost of the analyses. When the permissible limits of contaminants are not exceeded, the sup
-plier bears only the cost of the liquid waste sup -plying to the collection point.
Methods
The study used the results of own research and those obtained from the Waterworks Bialys
Each time, 10 samples of liquid wastes from successively emptied vacuum trucks were col
-lected, which were then transported to the labora
-tory of Technical University in Bialystok to deter
-mine selected indicators of contamination. In order to reduce any errors in the research work, each sample was described by specifying the date, time, declared sources of liquid wastes and its address, the capacity of the vacuum truck, and the provider of liquid wastes.
The analyses included determining the fol
-lowing parameters performed in accordance with Polish norm: potentiometric pH with a pH-me
-ter Hach Session 4, electrolytic conductivity by means of conductivity method, total suspended solids by gravimetric method, organic substances measured by using the biochemical oxygen de
-mand (BOD5 by dilution method), and chemical oxygen demand by dichromate method (CODCr).
The results of the liquid wastes parameters were compared with acceptable indicators determined in the agreement on the introduction of liquid
wastes into the collection point in Bialystok
be-ing in force in 2012 [Contract 2011].
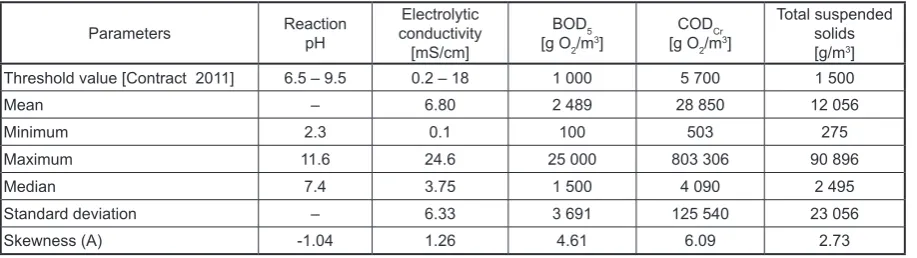
The results obtained during the research (80 samples) are presented in tabular, graphical, and descriptive forms. Table 1 shows the statistics characterizing tested waste accumulation indica
-tors calculated using STATISTICA v. 10.0 soft
-ware: arithmetic mean, median, standard devia
-tion, minimum, maximum, skewness (A).
In order to determine the compliance of the studied traits (determination results of pollution indicators) with normal distribution, the null hy
-pothesis H0 was tested: the distribution of the test indicator is the normal distribution, against the alternative hypothesis H1: the distribution is not a normal one. To verify the hypothesis, the χ2 test was applied, assuming the null hypothesis H0 at
the significance level of p > 0.05. Since the tested
characteristics did not show any conformity with
normal distribution, their compatibility with other types of distributions were analyzed, similarly as
in the previous case.
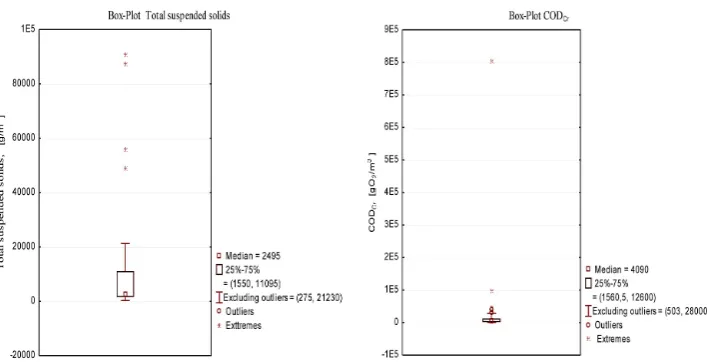
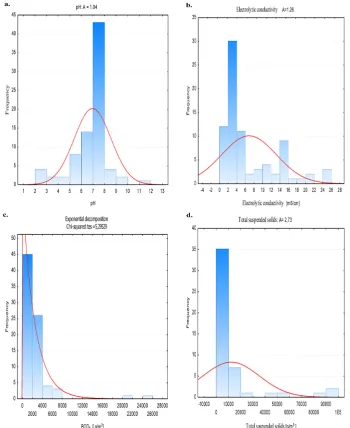
Graphics shows “box with a mustache” type plots (Figure 1) and histograms (Figure 2) plotted using STATISTICA v.10.0 software, which show statistical differences between the tested parameters.
RESULTS AND DISCUSSION
The average value of electrolytic conductiv
-ity of liquid wastes delivered to the collection point (Table 1) was within the range of permis
-sible limit values set by the Waterworks Bialys
-tok and contained in the contract [Contract 2011] to their supply, while mean values of BOD5 and CODCr as well as total suspended solids signifi
-cantly exceeded those levels. The average BOD5 value determined for 2012 amounted to 2489 g/m3
(Table 1), i.e. it exceeded the permissible level by almost 2.5-fold; the mean value of the suspension exceeded “the norm” more than 8-fold and the av
-erage chemical oxygen demand 4.5-fold.
Analyzing values of the minimum indicators of pollutants in liquid wastes, it should be noted that in all cases they reached values below the limit (Table 1), while the maximum values ex
-ceeded them many times as similar as average values. The maximum electrolytic conductivity was 24.6 mS/cm, BOD5 – 25 000 g O2/m3, maxi
-mum CODCr up to 803 306 g O2/m3 (141 times
higher than acceptable limit), and the maximum content of total suspended solids 90896 g/m3 (61
times higher than permissible level).
Such a large excess, in particular in the case of suspensions, is evidence that the septic tanks may be leaking hence liquid infiltration into the ground occurs, which results in concentrating the liquid wastes. The second reason may be to pro
-vide to the collection point highly concentrated, industrial liquid wastes and leachates from the
Table 1. Statistics characterizing supplied liquid wastes
Parameters ReactionpH conductivityElectrolytic [mS/cm]
BOD5
[g O2/m3]
CODCr
[g O2/m3]
Total suspended solids [g/m3]
Threshold value [Contract 2011] 6.5 – 9.5 0.2 – 18 1 000 5 700 1 500
Mean – 6.80 2 489 28 850 12 056
Minimum 2.3 0.1 100 503 275
Maximum 11.6 24.6 25 000 803 306 90 896
Median 7.4 3.75 1 500 4 090 2 495
Standard deviation – 6.33 3 691 125 540 23 056
Waste Treatment Plant in Hryniewicze charac
-terized by, among others, high electrolytic con
-ductivity value and high levels of pollutants ex
-pressed as COD [Leszczyński 2011 and 2013]. Statistical processing of results (Table 1) showed the existence of large disparities between pollutant concentrations expressed as the contents of BOD5 and CODCr, total suspended solids, and electrolytic conductivity, due to the very large difference between the median values and mean values of the analyzed parameters.
Based on the minimum and maximum values (Table 1, Figure 1), very large differences be
-tween obtained values of the individual param
-eters of liquid wastes were recorded. Standard deviations show their considerable dispersion. Also, graphs of “boxes with a mustache” type ex
-hibit large fluctuations in the analyzed indicators of impurities in the liquid wastes supplied to the collection point (Figure 1).
It was found that span values of the analyzed
parameters were remarkable. In all cases, the
oc-currence of outliers and extreme for pH, electro
-lytic conductivity, BOD5, CODCr and total sus
-pended solids, was observed (Figure 1).
It was found that the resulting properties (results of pollution indices determination) in the liquid wastes were not to conform with the normal distribution, therefore, the compatibil
-ity of the distribution of analyzed features with other distributions were verified. Following dis
-tributions were taken into account: exponential, gamma, lognormal, and χ2. The assessment of the compliance with those distributions was carried out on the basis of the χ2 test.
The hypothesis on the compliance with the
exponential distribution was assumed for BOD5
(Figure 2c). Other characteristics (pH, conductiv
-ity, COD, and suspended solids), due to the low probability of the test (less than 0.05) showed no statistically significant compliance with any of the analyzed distribution.
On the basis of the presented histograms, it can be also specified a range of the most frequently achieved results and the significant range of the indicator occurrence (Figure 2). Therefore, it was concluded that liquid wastes were characterized by:
• in 79.1% pH from the range of 6–8 pH (Fig
-ure 2a),
• in 68.3% CODCr from the range of 503 – 10 000 gO2/m3 ,
• in 61% electrolytic conductivity from the range of 0.1 – 6 mS/cm, including in 36.6% values from 2 to 4 mS/cm (Figure 2b);
• in 86.6% BOD5 from the range of 100 – 4000 g O2/m3, including in 54.6% values from 100
to 2000 g O2/m3 (Figure 2c),
• in 72.9% total suspended solids from the range of 275 – 20 000g/m3 (Figure 2d).
In the case of electrical conductivity, total sus
-pended solids, BOD5, and COD(Cr) histograms, the
existence of a strong the right-hand asymmetry of the distribution was showed, which means that for these indicators of pollution, there are individual high and very high values (Figure 2, Table 1), while the vast majority of results ranged below the average. Only in the case of pH, a strong left-hand asymmetry (A = –1.04) was observed indicating that most of the analyzed samples of liquid wastes had a pH above average (Table 1, Figure 2a).
A comparison of indicators of liquid waste de
-livered and municipal wastewater shown that the minimum values of parameters of liquid wastes
supplied to the collection point in Bialystok had
much smaller values than the municipal sewage
quoted by various authors: Maksymowicz and Opęchowski [2001] as well as Simpson [2008] (Table 2). At the same time, the maximum values exceeded them repeatedly. For example, accord
-ing to own research, BOD5 for liquid wastes ac
-cepted a value from 100 to 25 000 g O2/m3, while
BOD5 for municipal wastewater according to re
-search by Maksymowicz and Opęchowski from 150 to 500 g O2/m3, and the research by Simson
- from 346 to 527 g O2/m3 (Table 2).
The analysis of liquid waste pollution indica
-tors showed the existence of large span between values of the analyzed parameters (Table 2). The variation range of selected parameters was high
-er than that in the studies by Maksymowicz and Opęchowski [2001] (Table 2), and the mean val
-ues several times higher than val-ues obtained by Tomczuk [2011a] (Table 1 and 2).
Largely dispersed values of the analyzed con
-tamination indicators of liquid wastes delivered to the collection point in Bialystok confirm, among others, the diversity of liquid waste sources (sin
-gle-family and multi-family residences, waste
treatment plant in Hryniewicze, service facilities,
industrial plants), no sealing of some no-outflow reservoirs, and low frequency of their transport.
CONCLUSIONS
1. Liquid wastes delivered to the collection point in Bialystok in 2012 were characterized by a high variability of composition. This resulted mainly from the diversity of the liquid waste
Table 2. Characteristics of sewage and liquid wastes
Index
Volues
Municipal sewage Liquid wastes Simson
2008 Opęchowski 2001Maksymowicz. Opęchowski 2001Maksymowicz. Tomczuk 2011a(mean) WaterworksOwn and Total suspended solids
[g/m3] 417 – 676 1 200 – 3 200 2 500 – 50 000 116 275 – 90 896
BOD5
[gO2/m3] 346 – 527 150 – 500 1 000 – 7 000 1080 100 – 25 000
CODCr
[gO2/m3] 796 – 1 239 250– 1000 2 500 – 15 000 1790 503 – 803 306
Electrolytic conductivity
[mS/cm] – – – 2.9 0.1 – 24.6
Reaction pH 6.8 – 7.9 – – 7.7 2.3 – 11.6
types originating both from municipal
hous-ing, and public facilities, service establish
-ments, or industry.
2. The values of the limit parameters set by the Waterworks Bialystok, which are indicated in
the agreements between the collection point
administrator and waste suppliers are notori
-ously exceeded.
3. The results of the study consist of determined, real parameters of liquid wastes delivered
to the collection point in Bialystok, which
demonstrate the need for their more frequent checks. Such tests are performed too rarely,
which means that Suppliers of the wastes in a
situation of exceeded permissible levels speci
-fied in the contract [Contract 2011] do not bear the actual costs associated with the introduc
-tion of impurities determined by the exceeding levels of pollutants contained therein.
REFERENCES
1. Bartoszewski K. at al. 2011. Poradnik eksploata
-tora oczyszczalni ścieków. Wyd. PZIiTS, Oddz. Wlkp. Poznań. [In Polish].
2. Błażejewski R., Nawrot T. 2009. Jak uszczelnić system gromadzenia i dowożenia nieczystości ciekłych?. GWiTS, 9. [In Polish].
3. Grygorczuk-Petersons E., Tałałaj I. 2007. Kształto-wanie gospodarki odpadami w gminie. Podlaska Agencja Zarządzania Energią. Białystok. [In Polish].
4. Heidrich Z. 2005. Gospodarka wodno-ściekowa. Centrum Informacyjne Lasów Państwowych. [In Polish].
5. Kisiel J., Bień J. 2005. Wspołdzialanie retencyj
-nego zbiornika stacji zlewnej z oczyszczalnią ścieków. [In:] Zintegrowane, inteligentne systemy wykorzystywania energii odnawialnej. Mat. Konf. Częstochowa-Podlesice. [In Polish].
6. Leszczyński J. 2011. Podczyszczanie odcieków ze składowiska odpadów stałych metodą koagulacji. Inżynieria Ekologiczna, 25, 242–250. [In Polish].
7. Leszczyński J. 2013. Zastosowanie procesu Fento
-na do podczyszczania odcieków składowiskowych. Instal, 6(341), 52–54. [In Polish].
8. Maksymowicz B., Opęchowski S. 2006. Zasady gospodarowania nieczystościami ciekłymi. Porad
-nik. Łódź. [In Polish].
9. Maksymowicz B., Opęchowski S. 2001. Zasady sporządzania przez gminy programów postępowa-nia z nieczystościami ciekłymi z terenów nies
-kanalizowanych z uwzględnieniem dyrektyw Unii Europejskiej. Poradnik praktyczny dla gmin. OB
-REM, Łódź. [In Polish].
10. Memo 2011. Notatka służbowa Wodociągów Białostockich Sp. z.o.o.. Białystok. Unpublished typescript. [In Polish].
11. PN-ISO 5667-10: 1997. Jakość wody. Pobranie próbek. Wytyczne pobierania próbek ścieków. [In Polish].
12. Simson G. 2008. Pierwsze doświadczenia –
test technologiczny z zastosowaniem preparatu
BRENNTAPLUS VP1, jako zewnętrzne źródło węgla organicznego do intensyfikacji procesu de
-nitryfikacji w Białostockiej Oczyszczalni. Forum Ekspoatatora, 6, 21–23. [In Polish].
13. Tomczuk B. 2011a. Ścieki dowożone czy nieczys-tości ciekłe? Forum Eksploatatora, 2(53), 82–83. [In Polish].
14. Tomczuk B. 2011b. Stacje zlewne nieczystości ciekłych – przegląd dostępnych rozwiązań. Forum Eksploatatora, 3(54), 70–71. [In Polish].
15. Contract 2011. Umowa o wprowadzanie nieczystości ciekłych do stacji zlewnej. 2011. Białystok. Maszyn. niepubl [In Polish].