Comparative study on HSI Classification with GF
and RF
Ms. Vidya R Menon Mr. Shibi Thambi k
PG Student (M. Tech) PG Student (M. Tech)
Department of Applied Electronics & Communication Department of Applied Electronics & Communication Thejus Engg. College, Kerala, India Thejus Engg. College, Kerala, India
Mr. Sreerag. S
PG Student (M. Tech)
Department of Applied Electronics & Communication Thejus Engg. College, Kerala, India
Abstract
In the area of remote sensing as well as the geosciences, whenever we are capturing a particular scene, it becomes very difficult to identify each and every object in the image of a particular scene. Here comes the advantage of using hyperspectral imaging as well as the feature extraction method. In hyper spectral imaging, the recorded spectra have fine wavelength resolution and cover a wide range of wavelengths. The goal of hyper spectral imaging is to obtain the spectrum for each pixel in the image of a scene. And it is done with the purpose of finding objects, identifying materials or detecting processes. Feature extraction is an effective way in order to reduce computational complexity and to increase the accuracy of hyper spectral image classification. Here, a comparative study on two simple and efficient feature extraction methods has been proposed. The work is based on image fusion and two different filtering approaches i.e.; recursive filtering and guided filtering. First, the partitioning of hyper spectral image into multiple subsets of adjacent hyper spectral bands was done. Then, the bands in each subset are getting fused together by a simplest image fusion method called averaging. After that, the fused bands are processed with transform domain recursive filtering as well as guided filtering in order to get the resulting features for classification. Finally, we will get a classification map which will indicate each and every object in the image of a particular scene. The performance of these two methods has been compared using various performance measures.
Keywords: Feature extraction, guided filtering, hyperspectral image, image classification, image fusion (IF), recursive filtering
________________________________________________________________________________________________________
I.
I
NTRODUCTIONImage processing is a method in order to convert an image into digital format and to perform some operations on it; so that the result will be either an enhanced image or we can extract some useful information from it. Image processing can also be applied to Hyper Spectral images (HSI). These types of images are available with hyperspectral satellite sensors, like the Airborne Visible/Infrared Imaging Spectrometer (AVIRIS). These images will provide detailed spectral information regarding the physical nature of the materials in that particular image and thus can be used to distinguish different land areas. Efficient methods to process hyperspectral images with more than hundred channels are becoming a difficult objective. Spectral imaging is the process of dividing the spectrum into many more bands. And this technique can be extended beyond the visible range. In hyperspectral imaging, the recorded spectra will be having fine wavelength resolution and it can easily cover a wide range of wavelengths. In order to solve the problems occurred in hyper spectral imaging, feature selection and extraction [2] are known to be important techniques in hyperspectral image classification. Feature selection [3] is a method of finding the best subset of hyperspectral bands which shown the highest class separability. And it is having an important advantage of preserving the physical meaning of the data. A general theoretic limitation is that it needs an exhaustive search of all the feature subset combinations in order to find the best subset of features for the classifier. Feature extraction can be defined as an effective way to reduce the dimension of the data. In feature extraction, a hyperspectral image will be projected into another feature space by applying one of the linear transformations. Then the significant components will be retained for the classification purposes. Serpico et.al introduced a procedure which can be used to extract the spectral channels in an image [2].
a classification map which will indicate each and every object in the image of a particular scene. The remainder of this paper is organized as follows. In Section II, the related works have been discussed. In Section III, the proposed method is described. The experimental part is shown in Section IV, results in section V and finally, the conclusion is given in Section VI.
II.
R
ELATED WORKSA segmentation and classification scheme which is based on watershed has been proposed to analyse hyper spectral data. The watershed transformation can be seen as a powerful technique of mathematical morphology used for image segmentation [5]. It will consider a two-dimensional one-band image as a topographic relief with the value of a pixel h standing for its elevation. A new method for segmentation and classification of hyperspectral images using markers has been proposed [6]. Image classification can be defined as identification of objects in a scene captured by a vision system, and it can be considered as one of the important tasks of a robotic system. The method was based on the construction of a minimum spanning forest from region markers. M. Pal et.al proposed SVM classifiers to classify t he hyper spectral data . Support vector machines (SVM) can be widely used for the classification of remotely sensed data [4]. The accuracy of a classification will decline significantly with the number of features, particularly if a small training sample is used. This shows the dependence of the accuracy of classification on the dimensionality of the data. X. Jia et.al presented an overview of both conventional and advanced feature reduction methods, with a few techniques that are commonly used for analysis of hyper spectral data [7].
A novel and rigorous framework, which integrates SVMs and Markov random field models in a unique formulation for spatial contextual classification, has been proposed [8]. A relevant aspect of these methods in the context of supervised classification techniques can be their ability to perform with limited training sets [4], [7]. The good generalization capability of machine learning techniques such as the support vector machine (SVM) [4] and multinomial logistic regression (MLR) is enhanced by reducing the input data dimensionality [13], [14], which will help in addressing ill-posed problems based on limited training samples [7], [16]. Benediktsson et al. propose that the morphological transforms are able to model the spatial structures in hyperspectral images [13]–[16]. They first performed the PCA on the original hyperspectral image to obtain the significant PCs of the image. Then, the PCs have been processed with iterative opening, closing, and reconstruction operations to model the spatial structures of different scales. Their approaches can be improved by considering the attribute information [12]. Furthermore, Zhang et al. described that the hyperspectral data can be represented using a tensor representation [8] in order to make full use of the spatial information. From all of the aforementioned studies, it is clear that combining spectral and spatial information together in the feature extraction process will be an effective way in increasing classification accuracy. Recently, edge -preserving filtering [2], [14] has been applied in many applications like high dynamic imaging, stereo matching, image fusion (IF), de hazing and de noising only because of the fact that it can smooth an image while preserving well its edge structures.
III.
P
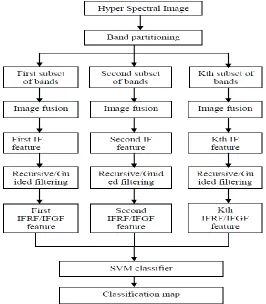
ROPOSED SYSTEMFig. 1: Block diagram of RF/GF-based classification method
Band Partitioning: A.
Hyper spectral image consist of a large number of bands. The kth (k ∈ (1, . . . ,K)) subset can be obtained as ; Pk= {(xk . . . x (k+/D/K/) if k + /D/K/ ≤ D (xk . . . xD), if k + /D/K/ > D (1)
where x = (x1. . . xD) denotes the original hyperspectral image with D-dimensional feature vectors. And J pixels, and /D/K/ represents the floor operation used to calculate the largest integer not greater than D/K. In the mathematical terms, it can be said that the hyperspectral image is spectrally partitioned into K subsets of hyperspectral bands in the first stage.
Image Fusion: B.
Then in image fusion the adjacent bands in the kth subset are fused by the averaging method. The advantage of using the averaging method is that it calculates the average image of each subset which aims at removing the nois y pixels and the redundant information for each subset. The kth fused band, i.e., the kth IF feature Fk, will be calculated as follows:
(2)
Where Pkn refers to the nth band of the kth subset of hyperspectral bands and Nk refers to the tota l number of bands in the kth subset.
Recursive Filtering: C.
Then recursive filtering is performed to obtain the kth feature. Recursive filters can be said as an efficient way of achievi ng a long impulse response, without performing a long convolution. They execute very rapidly, but will be having a less performance and flexibility than other digital filters. Recursive filters can also be called as Infinite Impulse Response (IIR) filters, since their impulse responses will be composed of decaying exponentials. It will be having a strong edge preserving property.
The recursive filtering operation should be performed on each fused band to obtain the kth feature. It can be given as; = RF ( ) (3)
Guided Filtering: D.
In guided filters, the filtering output can be locally a linear transform of the guidance image. Guidance image is the input image itself or a different version of the input image. These filters are also having a good edge preserving property. It generates the filtering output by considering the content of guidance image. And it will transfer the structures of the guidance image to the filtering output.
=G, ( ) (4)
Where GF represents the guided filtering operation, r and İ are the parameters of the guided filter and Q is the resulting feature image obtained by IFGF.
SVM Classifier: E.
Finally the resulting features are classified with the help of a SVM classifier. It can be considered as one of the most widely used pixel wise classifiers and will have a good performance in terms of classification accuracy. It will simultaneously mini mize the empirical classification error and it can maximize the geometric margin. SVM shall map input vector to a higher dimensional space where a maximal separating hyper plane has been constructed. Two parallel hyper planes will be constructed on each side of hyper plane that separates the data. The separating hyper plane can be seen as the hyper plane that maximizes the distance between the two parallel hyper planes. Whenever the margin or distance between these parallel hyper planes increases, the generalization erro r of classifier will also be increased. Guided filtering will also be performed on each fused band to obtain the kth feature as shown below;
IV.
E
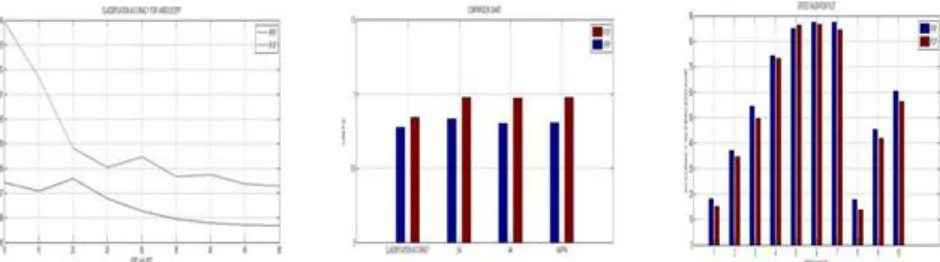
XPERIMENTAL RESULTSThe experiment can be performed on hyperspectral data set of the Indian Pines image. The Indian Pines image is for the agricultural Indian Pine test site of north western Indiana. It was acquired by the AVIRIS sensor. The image will be having 220 bands of size 145 × 145, with a spatial resolution of 20 m per pixel and it also has a spectral coverage ranging from 0.4 to 2.5 μm. And in order to evaluate the performance of this method, three widely used quality indexes, i.e., overall accuracy (OA), average acc uracy (AA), and kappa coefficient, are adopted. Among these three, OA will measure the percentage of pixels that are correctly classified. AA is the mean of the percentage of correctly classified pixels for each class. In order to make the measurement more o bjective, the kappa coefficient has been used. It will calculate the percentage of correctly classified pixels corrected by the number of agreements that would be expected purely by chance.
Fig. 2: a) 50th band of HSI data. b) Image fusion output. c) Classification map using GF d) Classification map using RF
Table-1:
Performance comparison of two EPFs
Parameters Guided Filter Recursive Filter
Classification
accuracy 0.7728 0.8412
OA 0.8304 0.9772
AA 0.8030 0.9722
Kappa 0.8065 0.9738
Time elapsed 33.124 sec 27.422 sec
V.
C
ONCLUSIONIn this paper, a comparative study on hyperspectral image feature extraction has been proposed. The proposed approach is based on the application of IF to reduce the dimension of the data, the use of recursive filtering as well as guided filtering to combine spatial information into the resulting IFRF and IFGF features. Experiment has been carried out on Indian Pine hyperspectral image. And the comparative study has been made. The results of the experiments showed the effectiveness of the proposed method, can provide better results than those of the widely used pixel wise classifiers and the spectral– spatial classifiers. Moreover, the recursive filter based method has several other advantages like; the feature can well preserve the physical meaning of the hyperspectral data. i.e., the pixel values in the feature image still reflect the spectral response of a pixel in a specific range and it is time efficient since it is based on a very fast EPF. The reason is that there i s a large region around the optimal number of features for which the proposed method has similar results and outperforms other classification methods in terms of accuracy. Both the methods can be widely used for the hyper spectral image classification. Both are of simple in implementation. The comparative study s hows that the use of recursive filter will result in more accurate and robust classification.
R
EFERENCES[1] Y. Tarabalka, J. A. Benediktsson, and J. Chanussot, “Spectral–spatial classification of hyperspectral imagery based on partitional clustering techniques,” IEEE Trans. Geosci. Remote Sens., vol. 47, no. 8, pp. 2973– 2987, Aug. 2009.
[2] S. B. Serpico and G. İoser, “Extraction of spectral channels from hyperspectralimages for classification purposes,” IEEE Trans. Geosci. Remote Sens., vol. 45, no. 2, pp. 484–495, Feb. 2007.
[3] Bruzzone and C. Persello, “A novel approach to the selection of spatially invariant features for the classification of hyperspectral images with improved generalization capability,” IEEE Trans. Geosci. Remote Sens., vol. 47, no. 9, pp. 3180–3191, Sep. 2009.
[4] M. Pal and G. ε. Foody, “Feature selection for classification of hyperspectral data by SVİ,” IEEE Trans. Geosci. Remote Sens., vol. 48, no. 5, pp. 2297–2307, May 2010.
[5] Y. Tarabalka, J. Chanussot, and J. A. Benediktsson, “Segmentation and classification of hyperspectral images using watershed transformation,”Pattern Recognition., vol. 43, no. 7, pp. 2367–2379, Jul. 2010.
[6] Y. Tarabalka, J. Chanussot, and J. A. Benediktsson, “Segmentation and classification of hyperspectral images using minimum spanning forest grown from automatically selected markers,” IEEE Trans. Syst., Man, Cybern. B, Cybern., vol. 40, no. 5, pp. 1267–1279, Oct. 2010.
[7] X. Jia, B.-C. Kuo, and İ. İ. Crawford, “Feature mining for hyperspectral image classification,” Proc. IEEE, vol. 101, no. 3, pp. 676–697, Mar. 2013. [8] G. İoser and S. B. Serpico, “Combining support vector machines and İarkov random fields in an integrated framework for contextual image
classification, ” IEEE Trans. Geosci. Remote Sens., vol. 51, no. 5, pp. 2734–2752, May 2013.
[9] B. Guo, S. R. Gunn, R. I. Damper, and J. D. B. Nelson, “Band selection for hyperspectral image classification usi ng mutual information,” IEEE Geosci. Remote Sens. Lett., vol. 3, no. 4, pp. 522–526, Oct. 2006.
[10] D. ε. εura, A. Villa, J. A. Benediktsson, J. Chanussot, and δ. Bruzzone, “Classification of hyperspectral images by usi ng extended morphological attribute profiles and independent component analysis,” IEEE Geosci. Remote Sens. Lett., vol. 8, no. 3, pp. 542–546, May 2011.
[11] R. Huang and İ. He, “Band selection based on feature weighting for classification of hyperspectral data,” IEEE Geosci. Remote Sens. Lett., vol. 2, no. 2, pp.156–159, Apr. 2005.
[12] J. A. Benediktsson, J. A. Palmason, and J. R. Sveinsson, “Classification of hyperspectral data from urban areas based on extended morphological profiles,” IEEE Trans. Geosci. Remote Sens., vol. 43, no. 3, pp. 480–491, Mar. 2005.
[13] W. įiao, A. Pizurica, P. Scheunders, W. Philips, and Y. Pi, “Semisupervised local discriminant analysis for feature extraction in hyperspectral images,” IEEE Trans. Geosci. Remote Sens., vol. 51, no. 1, pp. 184–198, Jan. 2013.
[14] J. Benediktsson, İ. Pesaresi, and K. Amason, “Classification and feature extraction for remote sensing images from urban areas based on morphological transformations,” IEEE Trans. Geosci. Remote Sens., vol. 41, no. 9, pp. 1940–1949, Sep. 2003.
[15] J. Li, J. M. Bioucas-Dias, and A. Plaza, “Spectral–spatial hyperspectral image segmentation using subspace multinomial logistic regression and εarkov random fields,” IEEE Trans. Geosci. Remote Sens., vol. 50, no. 3, pp. 809–823, Mar. 2012.
[16] Y. Tarabalka, J. A. Benediktsson, J. Chanussot, and J. C. Tilton, “İultiple spectral–spatial classification approach for hyperspectral data,” IEEETrans. Geosci. Remote Sens., vol. 48, no. 11, pp. 4122–4132, Nov. 2010.
[17] E. S. į. Gastal andİ.İ. Oliveira, “Domain transform for edge-aware image and video processing,” ACM Trans. Graph., vol. 30, no. 4, pp. 69:1– 69:12, Jul. 2011.
[18] J. A. Richards, Remote Sensing Digital Image Analysis. New York, NY, USA: Springer-Verlag, 2012.