OGD Heartbeat: Cities’ Commitment to Open Data
Karine Nahon*, Alon Peled**, Jennifer Shkabatur***
* The Information School, University of Washington and Lauder School of Government, Diplomacy and Strategy, Interdisciplinary Center at Herzliya, [email protected]
** Political Science department, Hebrew University of Jerusalem, [email protected]
*** Lauder School of Government, Diplomacy and Strategy, Interdisciplinary Center at Herzliya and World Bank, [email protected]
Abstract: This paper develops and tests a theoretical model, which proposes to examine cities’ commitment to the concept of open government data (OGD) according to three typical levels. Level 1, Way of Life, indicates high commitment to OGD; Level 2, On the Fence, represents either a low or erratic commitment; Level 3, Lip Service, refers to either scarce or no commitment. This study shows that these types exhibit distinct behavior in four key indicators: (1) Rhythm, (2) Coverage, (3) Categorization, and (4) Feedback. This theoretical framework is examined using longitudinal mixed-method analysis of the OGD behavior of 16 US cities over a period of four years, using a corpus of municipal quantitative metadata and primary qualitative data. This methodology allows us to represent, for the first time, cities’ evolving OGD commitment, or “OGD heartbeat”.
Keywords: open government data, cities, transparency, access, open cities, open data benchmarking
1.
Introduction: Measuring Cities’ Support of Open Government Data
(OGD)
notice of municipal authorities and hundreds of cities around the world have followed suit and launched their own OGD programs.
While OGD is fast becoming an integral part of government authorities’ routine activities, there is a dearth of measures to assess and compare the OGD behavior or commitment of agencies or cities. Only few rigorous OGD commitment measures exist (e.g., Open Data Barometer (World Wide Web Foundation 2015); OGP Independent Reporting Mechanism (Khan & Foti 2014); and OpenTheGovernment.org’s measurement tool (Bertot et al. 2012)), and studies that benchmark the adoption and implementation of OGD have only started to emerge (Veljkovic et al. 2014; Behkamal et al. 2014; Sayogo et al. 2014; Susha et al. 2015). At city level, empirical studies of OGD are even scarcer (Conradie & Choenni 2014; Ganapati & Reddick 2014), and no rigorous measures exist as yet. What are the components of the OGD behavior of a government authority? How can we assess government entities’ commitment to the release of OGD? Can we monitor the evolution of OGD behavior and commitment over time? Can we compare the OGD behavior and commitment of different governmental entities?
To address these questions on the municipal level, we developed a theoretical, mixed-method, longitudinal index that measures the so-called “OGD heartbeat” of cities over time. This index measures cities’ commitment to the concept of OGD, and was developed using different municipal OGD indicators: the rate of providing open government information, the variety of aspects in citizens’ lives represented in the OGD, description of the information, and a feedback mechanism for a particular dataset.
We analyzed and empirically tested the OGD heartbeat model in 16 US cities over a period of four years using a unique corpus of OGD metadata generated using dedicated software and other quantitative and qualitative measures. This information enabled us to measure their actual day-to-day OGD behavior against our theoretical model. The results show a clear distinction between three types of city behavior, which represent three incremental levels of municipal commitment to OGD: “Way of Life,” “On the Fence,” and “Lip Service.”
The proposed model contributes theoretically and empirically by suggesting a way to assess OGD policy implementation, focusing on the supply side. This paper lays the foundation for a new theory that describes the implementation patterns of OGD initiatives and policies. It is also a call to scholars and practitioners to start a discussion around what constitutes appropriate OGD behavior of cities. The model can be used in future research to include and compare more cities worldwide and add measurements to strengthen the validity of our findings, or test it against other public institutions.
2.
Cities Joining the Open Government Movement
China (Shen et al. 2015), Taiwan (Yang et al. 2014), Spain and Germany (Hunnius et al. 2014), as well as from an international perspective (Davies 2014; Peled 2013; Davies et al. 2013). Studies have also explored the political consequences of OGD policies and resulting power shifts (such as cooptation, e.g., Bates 2012); the legal design of national OGD policies (e.g., McDermott 2010); agencies’ compliance with OGD mandates (Peled 2013; Shkabatur 2012; Worthy 2013); and gaps that often emerge between political OGD ambitions and the realities of their implementation (Zuiderwijk & Janssen 2014).
As OGD portals mushroom around the world, scholarly attention has turned to identifying the emerging socioeconomic and political impacts of OGD (Davies et al. 2013, Peled 2013; Worthy 2014, Manyika et al. 2014). Studies discuss the central role of OGD intermediaries and “infomediaries” in helping bridge the gap between open data providers and users (Roberts 2014; Fung et al. 2013; Janssen & Zuiderwijk 2014), as well as barriers citizens may encounter in using OGD, such as lack of awareness of its benefits, insufficient technological capacities, and dearth of incentives to use it (Jaeger & Bertot 2010; Fung et al. 2013; Zuiderwijk et al. 2015; Jurisch et al. 2015). Despite the abundance of national-level studies of OGD, an overarching analytic framework for local-level OGD has not yet been developed. Indeed, “the act of publishing open data is new for local governments” (Conradie & Choenni 2014, S15). While local e-government is the subject of a vast body of literature (e.g., Ho 2002; Norris & Moon 2005; Pina et al. 2010; Tolbert et al. 2008; Scott 2006; Mossberger et al. 2012), it typically delineates general modalities of online service provision and assesses cities’ performance, but does not offer targeted analysis of OGD commitment and behavior. Further, studies show that local e-government programs largely focus on delivering information and services online, with only limited channels for interaction between the government and citizens (Norris & Reddick 2013; Bonsón et al. 2012). The burgeoning literature on “smart cities” with citizen-centered service provision systems that promote local innovation and co-creation (Schaffers et al. 2011; Alawadhi et al. 2012; Townsend 2013; Goldsmith 2014) typically discusses the drivers and enabling conditions for municipal innovations and their potential to improve service delivery and quality of life, but tend not to focus on city-level OGD policies and practices.
Recently, researchers have examined the technical and institutional barriers to municipal OGD adoption, and noted that different municipal departments need to employ different data release policies depending on the character of services that they provide, and that these data should be released as part of an overarching strategic framework, and not “for its own sake” (Conradie & Choenni 2014, S16). OGD case studies in selected cities have also been carried out (e.g., Gurstein 2012; Raman 2012; Canares et al. 2014; Fumega 2014; Kassen 2013), but these typically do not offer a comparison of municipal practices and do not employ quantitative tools to assess the patterns of their OGD commitment.
decentralization reform (Davies & Lithwick 2010; Local Government Association 2012). Accordingly, hundreds of cities around the world, including dozens of cities in the US, have launched OGD portals. However, a theoretical understanding of current practices and the potential of municipal OGD is still to be developed (Davies & Bawa 2012; Kassen 2013).
Second, compared to national OGD, municipal OGD requires a different and more nuanced theoretical treatment. The political and socioeconomic diversity of local governments, as well as the heterogeneous character of municipal services, complicate comparisons, requiring careful consideration of multiple factors affecting cities’ OGD capacity and potential (see Yavuz et al. 2014 for a similar observation regarding municipal websites in general). At the same time, the simultaneous emergence of thousands of municipal OGD web portals worldwide represents a concrete and exciting opportunity to collect and analyze data about these portals and learn why some cities outdo others in the OGD domain.
3.
Theoretical Framework: The OGD Heartbeat of Cities
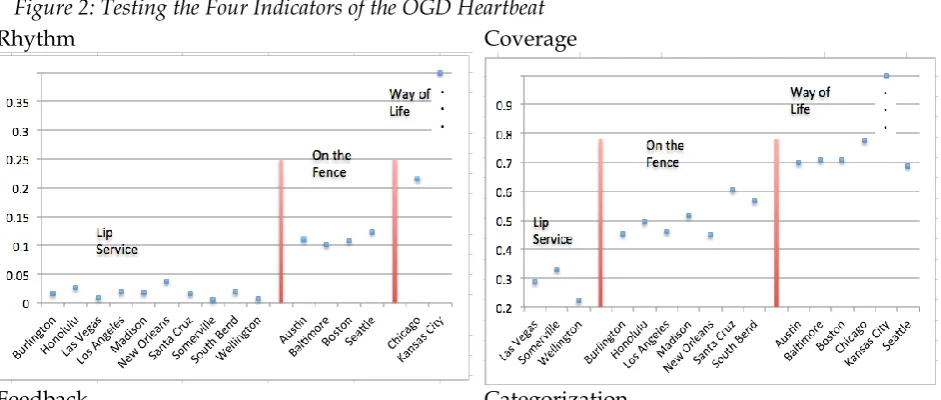
We propose to fill the theoretical gap about OGD at the municipal level with an innovative model to assess the OGD heartbeat of cities: their evolving OGD behavior and commitment. The OGD heartbeat model differentiates between three prototypical levels of commitment to OGD: (1) Way of Life – high level commitment; (2) On the Fence – low or erratic commitment to OGD; and (3) Lip Service – scarce or no commitment to OGD. Since we focus solely on the behavior of cities in their open government portals, we suggest four theoretical indicators which together may distinguish one city’s level of commitment to OGD from another’s. Subsequently, we will report the findings of an empirical test designed to determine whether these indicators combine to constitute a clearly defined pattern of commitment. The four indicators are:
1) Rhythm of providing OGD – measured by the number of datasets uploaded by the city since the inception of its OGD initiative and the long-term regularity of these uploads. Our assumption is that commitment to OGD is reflected by a consistent, rather than erratic or scarce, rate of information release by the city. Further, a regular and consistent practice of OGD releases can imply that OGD has turned into a norm and become institutionalized in municipal departments (Boin & Christensen 2008; Feldman & Pentland 2003).
2) Coverage is the extent to which the city’s OGD publications encompass a variety of aspects in the life of its residents. The literature shows that cities that provide a wide range of services to their residents on a daily basis exhibit higher levels of commitment to their residents, are more successful, and enjoy higher levels of trust from residents (Griesller, 2012). We assumed that this is consistent with OGD commitment: The more varied the information provided by cities, the more committed they are to OGD.
4) Feedback is defined as the inclusion of contact details of the municipal unit or official responsible for each disclosed information asset or queries about it. This is consistent with studies showing that citizen feedback mechanisms strengthen governments’ sense of accountability (e.g., Fung 2006; Dowdle 2006; Peled & Nahon 2015).
Table 1 below presents each commitment level, along with the four proposed indicators.
Table 1: OGD Commitment Levels
Indicators Way of Life On the Fence Lip Service
Rhythm The city regularly releases a significant
volume of OGD.
The city provides erratic OGD (either with low or significant amount of data), or consistent and
low volume over time.
The city provides scarce or no OGD.
Coverage The city fully or nearly fully covers the spectrum of municipal life aspects in the OGD
it discloses.
The city covers a partial spectrum of municipal life aspects in the OGD it
discloses.
The city focuses on a small number of municipal life aspects in
the OGD it discloses.
Feedback The city consistently provides contact details
of the unit or official responsible for the disclosed information.
The city sporadically provides contact details
of the unit or official responsible for the disclosed information.
The city scarcely provides contact details
of the unit or official responsible for the disclosed information.
Categorization nnn
The city consistently provides metadata of keywords & categories
to describe its OGD.
The city sporadically provides metadata of keywords & categories to
describe its OGD.
The city scarcely provides metadata of keywords & categories to
describe its OGD.
OGD Heartbeat High level of commitment to OGD
Low or erratic commitment to OGD.
Scarce or no commitment to OGD.
4.
Method
This paper is theoretical and empirical, applying a longitudinal mixed-data, comparative approach to examine the OGD commitment of 16 cities in the US. Two types of datasets were used: (1) A large corpus of metadata about OGD uploaded by the cities; and (2) Primary qualitative data, which we coded to represent an aspect of the Coverage indicator.
The metadata corpus is based on the Public Sector Information Exchange (PSIE; Peled 2014). This software platform crawls into an OGD portal and performs an initial indexing of all information assets published by the city. It then returns to the portal once a week to find new information assets or glean new metadata about previously indexed ones.1 The most important and lowest-granular information in our corpus is the rich metadata descriptions that cities publish along with the data on their OGD portals. To the best of our knowledge, not a single other central repository exists today for scholars studying governmental release of datasets on individual OGD portals on such a large scale. This research technique can also be applied to other levels of government – state, federal, and international.
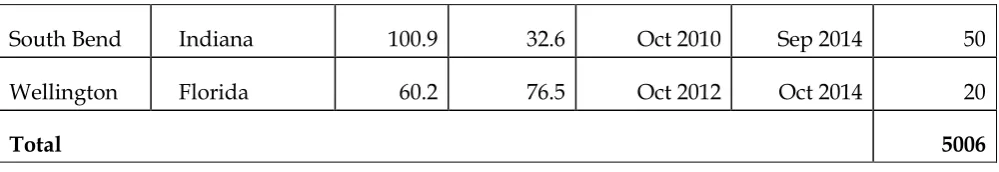
In this paper, we relied on the PSIE software to extract the metadata of OGD datasets by a given city. The corpus contained 5006 OGD datasets uploaded by the 16 cities from 2011 through 2014 (see Table 2). The variables were accumulated on a daily basis to enable longitudinal analysis. The cities selected for the sample are included in the federal US OGD portal (www.data.gov) and have an OGD portal in an open standard (such as JSON, CKAN or Socrata). They differ in location (see Figure 1), population size, socioeconomic conditions and the number of open datasets disclosed (see Table 2). While they cannot be considered as fully representative of the municipal OGD experience in the US, they do provide rich insights into the municipal OGD heartbeat.
Figure 1: The Location of the 16 OGD Cities
1The frequency at which our software crawled through the municipal OGD websites was determined by the limitations
Table 2: The 16 OGD Cities: Basic Details
City State
Popu-lation (in K)
Annual Income (in $K)
OGD Initiation Date
Last OGD Upload
Total OGD Datasets
Austin Texas 885.4 52.4 Oct 2012 Sep 2014 289
Baltimore Maryland 622.1 39.2 Nov 2013 Sep 2014 316
Boston Massachusetts 646 51.6 Oct 2012 Sep 2014 317
Burlington Vermont 42.3 43 Dec 2013 Sep 2014 33
Chicago Illinois 2718.8 45.2 Oct 2011 Sep 2014 523
Honolulu Hawaii 347.9 62 Nov 2012 Sep 2014 68
Kansas City Missouri 467 41.9 Oct 2012 Sep 2014 2792
Las Vegas Nevada 226.9 47.4 Nov 2013 Jul 2014 26
Los Angeles California 3884.3 46.8 Oct 2013 Sep 2014 55
Madison Wisconsin 243.3 51.2 Jan 2013 Sep 2014 48
New Orleans Louisiana 3787.1 34.4 Oct 2011 Sep 2014 88
Santa Cruz California 62.9 31.3 Nov 2012 May
2014 52
Seattle Washington 652.4 64.5 Jan 2011 Sep 2014 313
South Bend Indiana 100.9 32.6 Oct 2010 Sep 2014 50
Wellington Florida 60.2 76.5 Oct 2012 Oct 2014 20
Total 5006
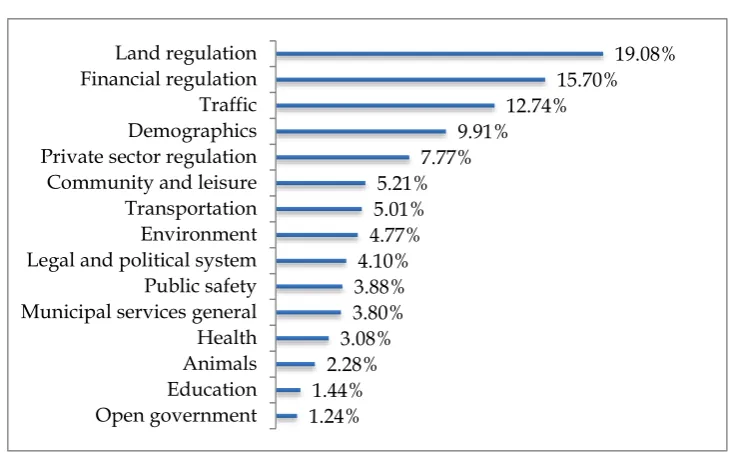
Additionally, we created a qualitative dataset which represents the spectrum of municipal issues a city can address: distinct metacategories. This dataset was crucial to the evaluation of the Coverage indicator. We examined the content of 5006 OGD datasets and coded them into 15 qualitative metacategories covering the main issues cities address.2
The analysis of the composite index measuring the OGD Heartbeat consists of operationalizing the four theoretical indicators (Rate, Coverage, Categorization, and Feedback) discussed in Section 3. Table 3 presents the full list of variables, measurement items, and weights that compose the index. The variables were accumulated on a daily basis and represent a longitudinal analysis (four years).3 There was no collinearity in our sample. However, we believe that our analysis must be tested against a larger sample (currently N=895, the cumulative number of days on which any of our 16 cities released at least one OGD asset).
Table 3: Operationalization of the OGD Heartbeat
Indicator Operationalization Description
Categorization
(10% of index)
1. Assets without category and keywords
2. Assets with category and without keywords
3. Assets with keywords and without category
4. Assets with both category and keywords
The provision of metadata keywords and categories to identify and define each disclosed information asset. We assume that a city commited to OGD will consistently assign
descriptive keywords and categories to its information assets.
Coverage (40% of index)
The extent to which the OGD disclosed by the city encompasses a variety of aspects in the life of its residents. We assume that the more
2 These 15 metacategories are: Animals, Community and leisure, Demographics, Education, Environment, Financial
regulation, Health, Land regulation, Legal and political system, Municipal services general, Open government, Private sector regulation, Public safety, Traffic, and Transportation.
varied the information provided by a city, the more committed it is to OGD.
1. Distinct Metacategories (70%) A qualitative measurement coded by the authors to measure the variety of areas covered by OGD.
2. Distinct Categories (20%) An automatic metadata, which indicates the variety of categories used by the city to describe its OGD assets.
3. Distinct Keywords (10%) An automatic metadata, which indicates the variety of keywords used by the city to describe its OGD assets.
Feedback
(10% of index)
The inclusion of contact details of the unit or official responsible for the disclosed dataset. We assume that a city committed to OGD will
consistently provide this information.
1. Assets with Feedback (50%) Were contact details provided as part of the dataset’s metadata?
2. Assets with Distinct Feedback (50%)
The distinct number of contact persons or units whose names are mentioned as part of each dataset’s metadata.
Rhythm
(40% of index)
The city’s rhythm of uploading OGD datasets. We assume that a city committed to OGD regularly releases a significant volume of OGD.
1. Normalized daily upload periods ratio (30%)
The normalized number of periods where, each day, at least one OGD asset was uploaded.
2. Normalized monthly upload periods ratio (30%)
The normalized number of
monthly periods where, each month, at least one OGD asset was uploaded.
4. Accumulated uploaded assets (10%)
The total number of assets uploaded, including all assets uploaded in previous days.
5. Daily upload periods (5%) The number of daily periods where, each day, at least one OGD asset was uploaded.
6. Monthly upload periods (5%) The number of monthly periods, each month, at least one OGD asset was uploaded.
5.
Results
Figure 2 presents the empirical results of the four indicators and the level to which the cities are accordingly assigned. The results show a clear distinction between the three levels of commitment to OGD for each dimension (Rhythm, Coverage, Feedback, and Categorization), supporting the theoretical argument for analytical validity of the levels.
Figure 2: Testing the Four Indicators of the OGD Heartbeat
Rhythm Coverage
Figure 3 displays the distribution of 5,006 OGD assets into fifteen types of distinct metacategories, which were assigned to each of the assets through content analysis.
Figure 3: Distinct Metacategory Distribution
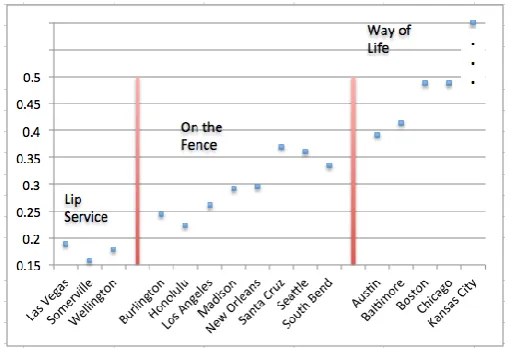
The OGD Heartbeat of cities is a composite index. It reflects both a city’s current OGD behavior and its commitment to OGD. OGD behavior is a static picture, which relies on metadata that became available on the last date on which a particular dataset has been released or updated, and is presented in Figure 4.4 A city’s commitment to OGD represents the trajectory that the city takes in regard to OGD (see Table 4).
Figure 4: OGD Heartbeat Rank
4City officials can change the data or metadata of a particular dataset. In practice, municipal workers release a particular
dataset and rarely return to update its data or metadata. Accordingly, in this paper, we analyze the latest and most up-to-date version of each dataset’s metadata (which is often also the date when the dataset was first released).
1.24% 1.44%
2.28% 3.08%
3.80% 3.88% 4.10% 4.77%
5.01% 5.21%
7.77% 9.91%
12.74% 15.70%
19.08%
The coefficients in Table 4 represent the best-fitting slope of the regression for each city’s daily improvement. The maximum OGD heartbeat in our sample is 0.945 with a mean of 0.351 and standard deviation of 0.130. The Slope by Date column shows the actual trajectory of every city over time measuring change over time per each city and in comparison to the others (note that Santa Cruz and Wellington are not significant since they behave erratically). The 95% Confidence Interval column represents the marginal errors of the slope and the scope of the trajectory the city can take regarding OGD.
Table 4: The OGD Heartbeat Trajectory5
City Slope by Date P 95% Confidence Interval
Austin .0002011 0.000 .000153-.0002492
Baltimore .0009622 0.000 .0007721-.0011524
Boston .0003097 0.000 .0002345- .0003849
Burlington .0006927 0.000 .0005201-.0008653
Chicago .0001333 0.000 .0001274-.0001392
Honolulu .000088 0.000 .0000534-.0001226
Kansas City .0008385 0.000 .0007922-.0008849
Las Vegas .0007573 0.000 .0005597-.0009549
Los Angeles .0005417 0.000 .0004427-.0006407
5 To support this table, we created a statistical model with 16 variables for our 16 cities. Each of the 895 “per city, per day”
Madison .0002978 0.000 .0002713-.0003242
New Orleans .0001081 0.000 .0000883-.0001279
Santa Cruz .0001101 0.116 (n.s) -.0000273-.0002476
Seattle .000107 0.000 .0000751-.000139
Somerville .0001515 0.000 .0000933-.0002097
South Bend .0004587 0.000 .000391-.0005265
Wellington .0000763 0.066 (n.s.) -4.91e-06-.0001576
N 895 - -
R2 0.9371 - -
6.
Discussion
The OGD Heartbeat index depicts the evolving OGD behavior and commitment of 16 US cities that differ considerably on a range of dimensions. While further analysis is needed to gauge factors that drive cities to adopt certain OGD behaviors, the index allows several preliminary observations.
Sunlight Foundation, and Code for America (Kassen 2013). Boston and Chicago illustrate how two cities can share a similar OGD heartbeat but take different paths to attain it.
Second, it should probably not be surprising that even cities for which OGD is a way of life gravitate toward politically “neutral” data releases that do not require special effort. For instance, 39% of Austin’s OGD releases consist of detailed data regarding the activities of the municipal animal shelter (e.g., animal intakes per day). For an unknown reason, Austin has assigned these datasets to the category of “government.” Similarly, 80% of the data released by Boston and 24% of the data published by Baltimore—two members of our prestigious Way of Life club—consist of census information, while 23% of Kansas City’s releases consist of data on historical traffic counts across the city. Conversely, data on potentially sensitive issues such as details of budget allocations for various municipal departments, spending, contracts, employment conditions of municipal employees, etc. are released less often. At the municipal level, citizens may find such politically neutral data useful. The publication of politically neutral data is one path through which a city can integrate OGD as part of its way of life.
Third, it is difficult for cities to maintain a consistent rhythm of significant OGD releases without significant institutional infrastructure and support. Only two cities in our sample—Chicago and Kansas City—have an OGD Way of Life on this dimension. Several other cities do not have a consistent rhythm of releases, and the majority of cities in our sample fail to sustain any rhythm at all. One of the reasons for such low performance is the lack of institutional support for OGD in the majority of cities. It also seems that cities may publish information assets as an immediate response to external pressures, such as new policy interventions. For instance, spikes of OGD publications right after the introduction of new OGD policies occurred in Baltimore, Boston, Los Angeles, and Madison. The extent to which such spikes have translated into routine OGD releases seems to depend on the institutional infrastructure and support for the implementation of OGD policies. As mentioned above, such infrastructure and institutional support is available in Chicago (Kassen 2013). In short, strong municipal OGD institutional support must exist for a city to sustain OGD as a way of life over the long term.
7.
Conclusion
To conclude, we have developed and tested a theoretical model to assess cities’ commitment to the concept of open government data (OGD), according to three levels: (1) Way of Life, reflecting a high commitment; (2) On the Fence, representing either low or erratic commitment; and (3) Lip Service, referring to either scarce or no commitment. These levels draw on four key indicators: (1) Rhythm, (2) Coverage, (3) Categorization, and (4) Feedback. We empirically examine this theoretical framework using longitudinal mixed-method analysis of the OGD behavior of 16 US cities for a period of four years. Results show that the behavior of OGD of cities is indeed distinct for each level.
This OGD heartbeat of cities thus appears to be a valid index of cities’ behavior and their evolving commitment to release meaningful OGD. It also provides the basis for the discussion of future interventions to enhance cities’ commitment to OGD. While we employ this model to assess the evolving, longitudinal behavior of cities with regard to OGD initiatives, it may be adapted to analyze any information supply intervention by national or local government agencies.
There are few limitations to this study. First, although the sample that we worked with—5,006 datasets from 16 cities—is large, it still only covers a small fraction of cities that adopt and implement OGD initiatives. Larger data samples would be useful to illuminate additional OGD patterns and add nuances to our suggested model. Second, a full understanding of why cities gravitate toward one type of OGD behavior or another would require a nuanced analysis of the socioeconomic and political context within which OGD policies are adopted, as well as an assessment of how the use of OGD by individuals, organizations, or businesses affects the city’s commitment to its OGD policy. As this paper primarily aims to develop a model to assess cities’ commitment to OGD, these two directions are beyond its scope, but they could be an important contribution to the nascent literature on the OGD behavior of cities.
References
Agrawal, D., Kettinger, W. J., & Zhang, C. (2014). The Openness Challenge: Why Some Cities Take It on and Others Don‘t (pp. 1–7). Presented at the Twentieth Americas Conference on Information Systems, Savannah, GA.
Alawadhi, S., Aldama-Nalda, A., Chourabi, H., Gil-Garcia, J. R., Leung, S., Mellouli, S., & Walker, S. (2012). Building Understanding of Smart City Initiatives. In H. J. Scholl, M. Janssen, M. A. Wimmer, C. E. Moe, & L. S. Flak (Eds.), Electronic Government (pp. 40–53). Berlin & Heidelberg: Springer.
Bates, J. (2012). This is What Modern Deregulation Looks Like : Co-Optation and Contestation in the Shaping of the UK’s Open Government Data Initiative. The Journal of Community Informatics, 8(2).
Behkamal, B., Kahani, M., Bagheri, E. & Jeremic, Z. (2014). A Metrics-Driven Approach for Quality Assessment of Linked Open Data. Journal of Theoretical and Applied Electronic Commerce Research, 9(3), 64-79. Bertot, J. C., Jaeger, P. T., & Grimes, J. M. (2010). Using ICTs to create a culture of transparency: E-government
Bertot, J. C., McDermott, P. & Smith T. (2012). Measurement of Open Government: Metrics and Processes. 2012 45th Hawaii International Conference on System Sciences, 2491-2499. Available at: http://www.computer.org.ezprimo1.idc.ac.il/csdl/proceedings/hicss/2012/4525/00/4525c491.pdf. Boin, A., & Christensen, T. (2008). The Development of Public Institutions: Reconsidering the Role of
Leadership. Administration & Society, 40(3), 271-297.
Bonsón, E., Torres, L., Royo, S., & Flores, F. (2012). Local E-Government 2.0: Social Media and Corporate Transparency in Municipalities. Government Information Quarterly, 29(2), 123–132.
Bowker, G. C., & Star, S .L. (1999). Sorthing Things Out: Classification and Its Consequences. Cambridge, MA: MIT Press.
Canares, M., de Guia, J., Narca, M., & Arawiran, J. (2014). Opening the Gates: Will Open Data Initiatives Make Local Governments in the Philippines More Transparent? (pp. 3–26). Available at:
http://opendataresearch.org/sites/default/files/publications/Opening%20the%20Gates%20-%20Will%20Open%20Data%20Initatives%20Make%20Local%20Government%20in%20the%20Philippin es%20More%20Transparent.pdf
Carlyle, A. (2015). The Policeman’s Beard Was What? Representation and Reality in Knowledge Organization and Description. iConference 2015, Newport, CA.
Conradie, P. & Choenni, S. (2014). On the Barriers for Local Governments Releasing Open Data. Government Information Quarterly, 31(supp. 1), S10-S17.
Davies, T. (2010). Open Data, Democracy and Public Sector Reform: A Look at Open Government Data Use from data.gov uk. Practical Participation. Available at: http://www.opendataimpacts.net/report/ Davies, A., & Lithwick, D. (2010). Government 2.0 and Access to Information: Recent Developments in
Proactive Disclosure and Open Data in Canada. Legal and Legislative Affairs Division, Parliamentary Information and Research, Service Library of Parliament, Canada.
Davies, T., & Bawa, Z. A. (2012). The Promises and Perils of Open Government Data (OGD). The Journal of Community Informatics, 8.
Davies, T. G. (2014). Open Data Policies and Practice: An International Comparison (SSRN Scholarly Paper ID 2492520) (pp. 1-26). Available at: http://papers.ssrn.com/abstract=2492520
Davies, T., Perini, F., & Alonso, J. (2013). Researching the Emerging Impacts of Open Data: ODDC Conceptual
Framework. Available at:
http://www.opendataresearch.org/sites/default/files/posts/Researching%20the%20emerging%20im pacts%20of%20open%20data.pdf
Dowdle, M. W. (2006). Public Accountability: Conceptual, Historical, and Epistemic Mappings, in M. W. Dowdle (ed.), Public Accountability: Design, Dilemmas and Experiences, Cambridge: Cambridge University Press.
Evans, A. M., & Campos, A. (2013). Open Government Initiatives: Challenges of Citizen Participation. Journal of Policy Analysis and Management, 32(1), 172–185.
Fumega, S. (2014). City of Buenos Aires Open Government Data Initiative (pp. 1-43). Available at:
http://opendataresearch.org/sites/default/files/publications/Final-Opening%20Cities%20-%20Buenos%20Aires%20final%20report.pdf
Fung, A. (2006). Varieties of Participation in Complex Governance. Public Administration Review, 66, 66-75. Fung, A., Russon Gilman, H., & Shkabatur, J. (2013). Six Models for the Internet + Politics. International Studies
Review, 15(1), 30-47.
Ganapati, S. & Reddick C. G. (2014). The Use of ICT for Open Government in U.S. Municipalities: Perceptions of Chief Administrative Officers. Public Performance & Management Review, 37(3), 365-387.
Goldsmith, S., & Crawford, S. (2014). The Responsive City: Engaging Communities through Data-Smart Governance (1st ed.). San Francisco: Jossey-Bass.
Griessler, C. (2012). E-Participation Declined? Conference for E-Democracy and Open Government. Krems, Austria: Edition Donau-Universität, Krems, pp. 313-316.
Gurstein, M. (2011). Open Data: Empowering the Empowered or Effective Data use for Everyone? First Monday, 16(2).
Gurstein, M. (2012). Two Worlds of Open Government Data: Getting the Lowdown on Public Toilets in Chennai and Other Matters. The Journal of Community Informatics, 8(2).
Ho, A. T. (2002). Reinventing Local Governments and the E-Government Initiative. Public Administration Review 62, 434.
Hunnius, S., Krieger, B. & Schuppan, T. (2014). Providing, Guarding, Shielding: Open Government Data in Spain and Germany. Paper presented at the European Group for Public Administration Annual Conference, Speyer, Germany (2014)
Jaeger P. T. & Bertot J. C. (2010). Transparency and Technological Change: Ensuring Equal and Sustained Public Access to Government Information. Government Information Quarterly, 27(4), 371-376.
Janssen, M., Charalabidis, Y., & Zuiderwijk, A. (2012). Benefits, Adoption Barriers and Myths of Open Data and Open Government. Information Systems Management, 29(4), 258–268.
Janssen, M., & Zuiderwijk, A. (2014). Infomediary Business Models for Connecting Open Data Providers and Users. Social Science Computer Review, 32(5), 694–711.
Jetzek, T., Avital, M., & Bjørn-andersen, N. (2013). The Generative Mechanisms of Open Government Data. In European Conference on Information Systems 2013. Paper 156.
Jetzek, T., Avital, M., & Bjørn-Andersen, N. (2013). Data-Driven Innovation through Open Government Data. Journal of Theoretical and Applied Electronic Commerce Research.
Jurisch, M. C., Kautz, M., Wolf, P. & Krcmar, H. (2015). An International Survey of the Factors Influencing the Intention to Use Open Government. Paper presented at the 48th Hawaii International Conference on
System Sciences, Hawaii, U.S.A. Available at:
Karen Mossberger, Y. W. (2013). Connecting Citizens and Local Governments? Social Media and Interactivity in Major U.S. Cities. Government Information Quarterly, 30(4), 351-358.
Kassen, M. (2013). A Promising Phenomenon of Open Data: A Case Study of the Chicago Open Data Project. Government Information Quarterly, 30(4), 508-513.
Khan, S. & Foti, J. (2014). Aligning Supply and Demand for Better Governance. Open Government Partnership. Available at: https://drive.google.com/open?id=0ByYwrpVh1DpYbEtqc2xiNExySG8&authuser=1. Local Government Association (2012). Local Government Transparency Survey 2012. Available at:
http://www.local.gov.uk/web/guest/local-transparency/journal_content/56/10171/3825698/ARTICLE-TEMPLATE
Manyika, J., Chui, M., Farrell, D., Van Kuiken, S., Groves, P., & Almasi Doshi, E. (2014). Open Data: Unlocking Innovation and Performance with Liquid Information|McKinsey & Company. Available at: http://www.mckinsey.com/insights/business_technology/open_data_unlocking_innovation_and_pe rformance_with_liquid_information.
Martin, S., Foulonneau, M., Turki, S., Ihadjadene, M., Paris, U., & Tudor, P. R. C. H. (2013). Risk Analysis to Overcome Barriers to Open Data. Electronic Journal of E-Government, 11(1), 348–359.
McDermott, P. (2010). Building Open Government. Government Information Quarterly, 27, 401-413.
Mossberger, K., Tolbert, C. J., & Franko, W. W. (2012). Digital Cities: The Internet and the Geography of Opportunity. New York: Oxford University Press.
Nahon, K., & Peled, A. (2015). Data Ships: An Empirical of Open (Closed) Government Data. Proceeding of the 48th Hawaii Conference on System Science (HICSS-48), Hawaii.
Nilay, Y. & Welch, E. W. (2014). Factors Affecting Openness of Local Government Websites: Examining the Differences Across Planning, Finance and Police Departments. Government Information Quarterly, 31(4), 574-583.
Norris, D. F., & Moon, M. J. (2005). Advancing E-Government at the Grassroots: Tortoise or Hare? Public Administration Review, 65(1), 64–75.
Norris, D. F., & Reddick, C. G. (2013). Local e-Government in the United States: Transformation or Incremental Change? Public Administration Review, 73(1), 165–175.
Open Data Executive Order (2012-2). Chicago, IL. Available at: http://www.cityofchicago.org/city/en/narr/foia/open_data_executiveorder.html.
Parsons, M. A., Godøy, Ø., LeDrew, E., de Bruin, T. F., Danis, B., Tomlinson, S., & Carlson, D. (2011). A Conceptual Framework for Managing Very Diverse Data for Complex, Interdisciplinary Science. Journal of Information Science, 37(6), 555–569.
Peled, A. (2011). When Transparency and Collaboration Collide: Lessons from the USA Open Data Program. Journal of the American Society for Information Science and Technology (JASIST) 62(11), 2085–2094. Peled, A. (2013). Re-Designing Open Data 2.0. JeDEM – eJournal of eDemocracy and Open Government, 5(2),
Peled, A. (2014). Traversing Digital Babel - Information, E-Government, and Exchange. (Cambridge, MA: MIT Press 2014).
Peled, A. & Nahon, K. (2015). Towards Open Data for Public Accountability: Examining the US and the UK Models. iConference 2015, Newport, CA.
Pina, V., Torres, L. and Royo, S. (2010). Is E-Government Leading to More Accountable and Transparent Local Governments? An Overall View. Financial Accountability & Management, 26(1), 3-20.
Raman, B. (2012). The Rhetoric and Reality of Transparency: Transparent Information, Opaque City Spaces and the Empowerment Question. The Journal of Community Informatics, 8(2) [n.p.].
Roberts, A. S. (2014). Making Transparency Policies Work: The Critical Role of Trusted Intermediaries (SSRN Scholarly Paper No. ID 2505674). Available at: http://papers.ssrn.com/abstract=2505674
Sayogo, D. S., Pardo, T. A. & Cook, M. (2014). A Framework for Benchmarking Open Government Data Efforts. 2014 47th Hawaii International Conference on System Science, 1896-1905.
Schaffers, H., Komninos, N., Pallot, M., Trousse, B., Nilsson, M., & Oliveira, A. (2011). Smart Cities and the Future Internet: Towards Cooperation Frameworks for Open Innovation. In J. Domingue, A. Galis, A. Gavras, T. Zahariadis, D. Lambert, F. Cleary, M. Nilsson (Eds.), The Future Internet (pp. 431–446). Scott, J. K. (2006). “E” the People: Do U.S. Municipal Government Web Sites Support Public Involvement?
Public Administration Review, 66(3), 341–353.
Shen, C., Riaz, Z., Palle, M. S., Jin, Q., & Peña-Mora, F. (2015). Open Data Landscape: A Global Perspective and a Focus on China. In M. Janssen, M. Mäntymäki, J. Hidders, B. Klievink, W. Lamersdorf, B. van Loenen, & A. Zuiderwijk (Eds.), Open and Big Data Management and Innovation (pp. 247–260). New York: Springer International Publishing.
Shkabatur, J. (2011). Cities @ Crossroads: Digital Technology and Local Democracy in America, Brooklyn Law Review, 76(4), 1413-1485.
Shkabatur, J. (2012). Transparency with(out) Accountability: Open Government in the United States, Yale Law & Policy Review 31(1), 80-140.
Shueh, J. (2013). Kansas City Measures Performance through Online Dashboard. Government Technology. Available at: http://www.govtech.com/data/Kansas-City-Measures-Performance-through-Online-Dashboard.html
Susha, I., Zuiderwijk, M. & Grönlund, A. (2015). Benchmarks for Evaluating the Progress of Open Data Adoption: Usage, Limitations, and Lessons Learned. Social Science Computer Review, 33(5), 613–630. Tat-Kei Ho, A. (2002). Reinventing Local Governments and the E-Government Initiative. Public
Administration Review, 62(4), 434–444.
Tolbert, C. J., Mossberger, K., & McNeal, R. (2008). Institutions, Policy Innovation, and E-Government in the American States. Public Administration Review, 68(3), 549–563.
Veljković, N., Bogdanović-Dinić, S. & Stoimenov, L. (2014). Benchmarking Open Government: An Open Data Perspective. Government Information Quarterly, 31(2), 278-290.
World Wide Web Foundation (2015). Open Data Barometer – Second Edition. Available at:
http://barometer.opendataresearch.org/assets/downloads/Open%20Data%20Barometer%20-%20Global%20Report%20-%202nd%20Edition%20-%20PRINT.pdf.
Worthy, B. (2013). David Cameron’s Transparency Revolution? The Impact of Open Data in the UK (SSRN Scholarly Paper No. ID 2361428). Available at: http://papers.ssrn.com/abstract=2361428
Worthy, B. (2014). Making Transparency Stick: The Complex Dynamics of Open Data (SSRN Scholarly Paper No. ID 2497659). Available at: http://papers.ssrn.com/abstract=2497659
Yang, T.-M., Lo, J., & Shiang, J. (2015). To Open or Not to Open? Determinants of Open Government Data. Journal of Information Science.
Yu, H., & Robinson, D. (2012). The New Ambiguity of “Open Government.” UCLA Law Review Discourse, 59, 178–208.
Zuiderwijk, A., & Janssen, M. (2014). Open Data Policies, Their Implementation and Impact: A Framework for Comparison. Government Information Quarterly, 31(1), 17–29.
Zuiderwijk, A., Janssen, M., & Dwivedi, Y. K. (2015). Acceptance and Use Predictors of Open Data Technologies: Drawing Upon the Unified Theory of Acceptance and Use of Technology. Government Information Quarterly. (Forthcoming)
About the Authors
Karine Nahon
Karine Nahon is an associate professor in the Information School at the University of Washington and in the Lauder School of Government, Diplomacy and Strategy at the Interdisciplinary Center (IDC) Herzliya, Israel. She is the director of the Virality of Information (retroV) research group and a member of the Social Media Lab (SoMe Lab). She studies politics and policy of information from an interdisciplinary perspective. She is the co-author of Going Viral (2013; with Jeff Hemsley), winner of the ASIS&T Best Information Science Book and Outstanding Academic Title awards.
Alon Peled
Alon Peled is an associate professor and political scientist at the Hebrew University of Jerusalem. He studies the interaction between information and politics in the public sector and information-sharing technologies that facilitate this interaction. In his work and research, Alon draws on rich experience in academia as well as software engineering. He has worked as a senior data architect in enterprise data warehouse and natural language software projects in both the US and Israel. His recent book, Traversing Digital Babel: Information, E-Government and Exchange was published in 2014.
Jennifer Shkabatur