behaviour. In.: DIVAI 2016 The 11th international scientific conference on Distance Learning in Applied Informatics (Conference Proceedings, Šturovo, Slovakia, May 2-4, 2016). Šturovo: Wolters Kluwer, p. 331-340.
LaRose, R., Kim, J. & Peng, W. (2010). Social networking: Addictive, compulsive, problematic, or just another media habit? In Z. Papacharissi (Ed.), A networked self: Identity, community, and culture
on social network sites. New York, NY: Taylor & Francis.
Livingstone, S., Ólafsson, K. (2011). Risky communication online. EU Kids Online, EU Kids Online Network, London, UK.
Madge, C., Meek, J., Wellens, J., & Hooley, T. (2009). Facebook, social integration and informal learning at university: “It is more socialising and talking to friends about work than for actually doing work.” Learning, Media and Technology, 34, 141-155.
Masur, P., Reinecke, L., Ziegle, M., Quiring, O. (2014). The interplay of intrinsic need satisfaction and Facebook specific motives in explaining addictive behavior on Facebook. Computers in Human Behavior, 39, 376-386.
Noll, J. G., Chad, E., Barnes, J. E. (2013). Association of maltreatment with high-risk Internet behaviors and offline encounters. Pediatrics, 10, 510–517.
Orosz, G., Toth-Kiraly, I., Bothe, B. (2015) Four facets of Facebook intensity – the development of multidimensional Facebook intensity scale. Personality and Individual Differences, http://dx.doi. org/10.1016/j.paid.2015.11.03.
Pollara, P., Zhu, J. (2011). Social networking and education: Using Facebook as an Edusocial space. In Proceedings of Society for Information Technology & Teacher Education International Conference, Chesapeake, VA: AACE, pp. 3330-3338.
Siti Hasanah, S. (2011). The use and abuse of Facebook by generation Y. Masters thesis, Universiti Utara Malaysia.
Steenkamp, J. B. E., Baumgartner, H. (1998). Assessing measurement invariance in cross-national consumer research. Journal of Consumer Research,25 (1), 78-107.
Rouis, S., Limayem, M., Salehi-Sangari, E. (2011). Impact of Facebook usage on students` academic achievement: Roles of self-regulation and trust. Electronic Journal of Research in Educational Psychology, 9 (3), 961-994.
Vandenberg, R. J., Lance, C. E. (2000). A review and synthesis of the measurement invariance literature: suggestions, practices, and recommendations for organizational research. Organizational Research Methods,3 (1), 4-70.
Zúñiga, X., Nagda, B. A., Sevig, T. D. (2002). Intergroup dialogues: An educational model for cultivating engagement across differences. Equity and Excellence in Education,35 (1), 7-17.
Received: July 02, 2016 Accepted: October 12, 2016
Gabriel Gorghiu PhD., Professor, Faculty of Electrical Engineering, Electronics and Information Technology, Valahia University of Targoviste, 130024 Targoviste, Romania. E-mail: [email protected]
Costin Pribeanu PhD, Senior Researcher I, National Institute for Research and Development in Informatics – ICI Bucharest, Bd. Maresal Averescu nr. 8-10, 011455, Bucha-rest, Romania.
E-mail: [email protected]
Website: http://rochi.ici.ro/pribeanu/
Vincentas Lamanauskas PhD, Professor, University of Šiauliai, Faculty of Education Sciences and So-cial Welfare, Department of Education & Psychology, P. Visinskio Street 25-119, LT-76351 Siauliai, Lithuania.
E-mail: [email protected]
Website: http://www.lamanauskas.puslapiai.lt/ https://www.facebook.com/ScientiaEducologica
SOCIOLOGICAL MEDIA: MAXIMIZING
STUDENT INTEREST IN QUANTITATIVE
METHODS VIA COLLABORATIVE USE OF
DIGITAL MEDIA
Frederick T. Tucker
Borough of Manhattan Community College, New York, USA E-mail: [email protected]
Abstract
College sociology lecturers are tasked with inspiring student interest in quantitative methods despite widespread student anxiety about the subject, and a tendency for students to relieve classroom anxiety through habitual web browsing. In this paper, the author details the results of a pedagogical program whereby students at a New York City community college used industry-standard software to design, conduct, and analyze sociological surveys of one another, with the aim of inspiring student interest in quantitative methods and enhancing technical literacy. A chi-square test of independence was performed to determine the effect of the pedagogical process on the students’ ability to discuss sociological methods unrelated to their surveys in their final papers, compared with the author’s students from the previous semester who did not undergo the pedagogical program. The relation between these variables was significant, χ 2(3, N=36) = 9.8, p = .02. Findings suggest that community college students, under lecturer supervision, with minimal prior statistical knowledge, and access to digital media can collaborate in small groups to create and conduct sociological surveys, and discuss methods and results in limited classroom time. College sociology lecturers, instead of combatting student desire to use digital media, should harness this desire to advance student mastery of quantitative methods.
Key words: community college, digital media, sociological methods, transformative pedagogy.
Introduction
College lecturers face a number of challenges, prominent among them being students lacking interest in coursework (Pregitzer & Clements, 2013; van der Veen, de Jong, van Leeuwen, & Korteweg, 2005) and distracted by digital media both inside (Li, Cui, Bai, & Davis, 2010; Grace-Martin & Gay, 2001) and outside the classroom (Attewell, Suazo-Garcia, & Battle, 2003; Castaño-Muñoz & Senges, 2011). Sociology lecturers, meanwhile, must provide their students with a broad conceptual education, while enhancing their students’ technical literacy (Borough of Manhattan Community College, 2016). Insofar as overcoming every obstacle proves contradictory within the current paradigm of higher education, lecturers must balance addressing one challenge against another, creating the best educational dynamic for each of their dozens, even hundreds of students, despite having little time for solo interaction.
IN THE 21 CENTURY Volume 73, 2016
76 why so many students become disillusioned during their first two years of college is their misperception that ‘higher education’ revolves solely around the acquisition of knowledge for the sake of knowledge, only to find out that they are expected to have advanced their careers through completion of vocational training, internships, work-study, and study-abroad programs. Swamped with these institutional demands, most United States undergraduate students consider compulsory general-education classes to be tedious obstacles, despite generally recognizing their educational benefits (Pregitzer & Clements, 2013). Dutch students, meanwhile, report losing interest even in their field of study over the course of their freshmen and sophomores years (van der Veen, et al., 2005). Clearly, college instructors could make their pedagogical techniques more exciting. Pedagogical activities that are cognitively stimulating, academically rigorous, and of topical interest would go a long way toward motivating students during their most vulnerable years, despite this arguably leaving students unprepared for the tedium of entry-level jobs and unpaid internships.
Prior to conducting this pedagogical experiment, the author attempted to engage students by eschewing the traditional instructor-lecture and class-discussion of shared texts whenever possible, opting for individualized research projects and group lectures about student-derived, instructor-approved topics. Despite these efforts, students displayed minimal interest in sociological methods. Weekly homework prompts of “what is the authors’ methodology” rarely evoked answers beyond, “books and articles,” or “studies and statistics.” Students came to class with no frame of reference for the difference between crime victimization surveys and reported crime data; between a FiveThirtyEight “polls-plus” poll (Silver, 2016) and a FOX News or CNN viewer SMS poll; between a correlation derived from census data or the 2006 General Social Survey, and one derived from a survey of a few dozen psychology undergraduates (Clabby, 1980). In many cases, the absence of a personal connection to the subject matter led to unwillingness to read. In other cases, the inability to comprehend academic discussions of methodology smothered any potential interest in the subject. Either way, alternative pedagogical practices were clearly required to excite students about sociological methods.
Use of digital media is nearly a foregone conclusion in 21st century college classrooms.
The only remaining question is whether students will use digital media illicitly and contrary to the curricula, or under lecturer supervision to fulfill classroom requirements. Nevertheless, educators and students alike are skeptical of institutionalized use of digital media in the classroom (Langmia & Glass, 2014). Kehbuma Langmia and Amy Glass (2014) have found that presumably younger faculty with little teaching experience are nearly as strict about smartphone use in class as their counterparts with 15-25 years experience. Teenagers, meanwhile, self-report smartphone addiction rates of 50% (Common Sense Media, 2016), despite medical researchers concluding Internet Addiction Disorder to have “alarming prevalence rates between 1.5 and 8.2%” (Cash, Rae, Steel, & Winkler, 2012). The author has witnessed this paranoia in the classroom, where students are seemingly unable to go an hour without checking their phones, and then write final papers decrying the social ills brought on by digital media, and prescribing society-wide bans on smartphones.
77 conceived process requiring months of painstaking collaboration, controversial methods, and debatable results.
Literature Review
For over half a century, pedagogical theorists, many inspired by Paulo Freire, have advanced the idea of student-led education. In Pedagogy of the Oppressed, Freire (1970/2005) codifies the educational methods he pioneered in the Brazilian countryside among illiterate peasants. Freire’s pedagogy requires students to generate themes based on their mundane experience, educators to represent these themes back to their students as historical problems, and educators, students, and surrounding community members to organize around solving these problems (Freire, 1970/2005). Freire’s transformative pedagogy saw him arrested and exiled by the U.S. backed Brazilian military dictatorship in 1964 (Freire, 1970/2005). His methods, however, continue to be developed throughout the world, including in the United States, where transformative educators are relatively free from overt political violence, and deal instead with institutional marginalization.
More recently, social scientists have begun to verify some of Freire’s claims about student interest facilitating education. In “Interest, learning, and the psychological processes that mediate their relationship,” Mary Ainley, et al., (2002) attribute students’ attentiveness during educational exercises to their individual predispositions to general learning, the subject matter at hand, as well as students’ response to their educational environment. Researchers and practitioners across the globe have begun using digital media to pique student interest in education (Poyntz & Hoechsmann, 2011; Soep, 2011; Langmia & Glass, 2014), some even using social media networks such as Facebook and Twitter to communicate with students and collect homework (Nowell, 2014; Stornaiuolo, Hull, & Sahni; 2011).
In “Not just philosophizing: Producing effective youth media and communication projects,” Stuart R. Poyntz and Michael Hoechsmann (2011) illustrate their technique of bridging the worlds of academic institutions, educators, and children. Hoechsmann’s experiments entail prompting mass media outlets to publish articles written by youth journalists, facilitated by his Young People’ Press (Poyntz & Hoechsmann, 2011). The authors propose addressing institutional demands by providing students with vocational training, addressing students’ demands by providing them with a pleasurable experience, while advancing their own agenda of nurturing students’ creativity and facilitating democratization (Poyntz & Hoechsmann, 2011). In ““Mad hard fun”: Building a microculture of youth media in New York City transfer schools,” Steven Goodman (2011) documents similar efforts of the Educational Video Center. Goodman (2011) recognizes that student enjoyment helps drive the educational process, and allows student interest and agency to drive students’ acquisition of media criticism and production skills.
IN THE 21 CENTURY Volume 73, 2016
78 and young adults–allow for more “collegial pedagogy” than Luttrell (2011) enjoyed with her 5-12 year old students (Soep, 2011). The difference between these tactics–lobbying for, and organizing with–represent the two different worlds that Antonio López (2011) says must be bridged by educators in “Practicing sustainable youth media.” In this case, these worlds are that of the pragmatist hoping to alleviate the suffering of the oppressed within the constraints of prevailing institutions, and the world of those aiming to organize communities around initiating structural change.
Perhaps the most extreme proponent of digital-media oriented, student-interest-and-agency driven pedagogy is Sugata Mitra. In his Hole-in-the-Wall (2005) and Self Organized Learning Environment experiments (2010), Mitra provides groups of children nearly unfettered access to the Internet to pursue topics of their choice. In these educational environments, instructors are replaced by mediators whose primary task is to encourage the children under their supervision to continue studying. Like David Levin’s “least adult” in the room (2011), Mitra’s mediators have minimal institutional power over their students, sparing them the distraction of having to negotiate power dynamics. Despite these developments, hostility toward digital media in the classroom remains prevalent among educators (Vered, 2011). Fears of digital media use increasing sedentary behavior and uncritical consumerism, however, seem to be exaggerated, if not entirely unfounded (Atkin, Corder, Ekelund, Wijndaele, Griffin, & van Sluijs, 2013; Attewell, et al., 2003; Fisherkeller, 2002).
Simply allowing students to browse the web for answers to their questions, of course, has its pitfalls. Teaching media literacy requires instructors to help students distinguish between legitimate and illegitimate information on the web. It is hard enough to convince undergraduates to trawl their institution’s databases for evidence. So it is not exactly encouraging for them to hear that the Center for Open Science’s Reproducibility Project has found less than half of the hundred psychology experiments they tested to be reproducible (Open Science Collaboration, 2015). In their Science Magazine article (Open Science Collaboration, 2015), the authors discuss their team of 250-plus social scientists’ semi-random sampling of 100 articles from three prominent psychology journals, and their oft-failed attempts to replicate the studies therein (Carey, 2015). Benedict Carey’s analysis of this research in the New York Times, “Many psychology findings not as strong as claimed, study says,” is the first article that the author has his students read each semester. Students must be reminded that while they must back every claim with evidence published by academic journals, not every claim published in academic journals is necessarily correct. True to form, the academy has since produced a critique of the Reproducibility Project’s methods. In “Comment on “Estimating the reproducibility of psychological science,”” Daniel T. Gilbert, Gary King, Stephen Pettigrew, and Timothy D. Wilson (2016) conclude that the Reproducibility Project’s replication procedures were flawed, and that the more rigorous replication procedures of their “Many Labs” project, involving dozens of independent laboratories running the same experiment, confirmed the results of almost 90% of their 16 study sample. Thanks to Gilbert, et al., the author can inform his students that they can be 85% confident, instead of merely 47% confident, in the veracity of the claims they read in their university’s databases.
79
Pedagogical Procedure
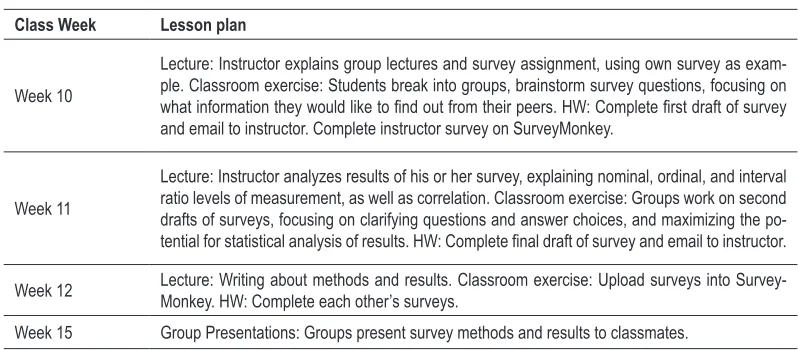
The author’s survey project began midway through the 2016 spring semester (Table 1) at the Borough of Manhattan Community College (BMCC), where the author is an adjunct lecturer of sociology. By Week 10 (of 15), 56 students in 3 separate sociology sections had handed in research proposals on a topic of their choice, and were broken into 13 groups of 4-7 students based on shared research topics such as gender, race, immigration, and youth media. To demonstrate the survey assignment, the lecturer presented a survey he had created about his area of expertise: democratic engagement. The class then broke into their groups for the first time and spent 30 minutes brainstorming survey questions to be answered anonymously by themselves, their classmates, and their anonymous peers in the lecturer’s other two classes. These survey first-drafts were emailed to the lecturer, who provided feedback and sent students a link with which to complete the democracy survey he had created on SurveyMonkey.
Table 1. Experimental pedagogical process.
Class Week Lesson plan
Week 10
Lecture: Instructor explains group lectures and survey assignment, using own survey as exam-ple. Classroom exercise: Students break into groups, brainstorm survey questions, focusing on
what information they would like to find out from their peers. HW: Complete first draft of survey
and email to instructor. Complete instructor survey on SurveyMonkey.
Week 11
Lecture: Instructor analyzes results of his or her survey, explaining nominal, ordinal, and interval ratio levels of measurement, as well as correlation. Classroom exercise: Groups work on second drafts of surveys, focusing on clarifying questions and answer choices, and maximizing the
po-tential for statistical analysis of results. HW: Complete final draft of survey and email to instructor.
Week 12 Lecture: Writing about methods and results. Classroom exercise: Upload surveys into Survey-Monkey. HW: Complete each other’s surveys.
Week 15 Group Presentations: Groups present survey methods and results to classmates.
In Week 11, the lecturer lectured the class on methods of quantitative analysis, using the results of his democracy survey to explain nominal, ordinal, interval, and ratio levels of measurement. Unable to export the survey data into MS Excel or Google Sheets with the free version of SurveyMonkey, the lecturer relied on a variety of studies to explain correlation. The Huffington Post’s “Sorry mom: Getting lots of tattoos could have a surprising health benefit,” exemplified how correlation is mistaken for causation by popular news media (Moye, 2016). To demonstrate that there isn’t uniform analysis even among academics working with the same data, the lecturer discussed the widely held belief among sociologists that elevated levels of socioeconomic stress causes dysfunctional parenting (Garbarino, 1976; Hampton, 1987), and that this might explain why African-Americans tend to commit more child abuse even when adjusting for income. The lecturer then contrasted this analysis with Jared Diamond’s hypothesis that physical punishment is a rational–if not optimal–parenting tactic for keeping children out of danger (Diamond, 2012), and explained how correlations between child abuse, stress, and race could all be caused by a fourth, unaccounted factor: the fact that African-Americans suffer from greater environmental danger, including higher rates of crime victimization (Levitt, 1999) and police brutality (New York Civil Liberties Union, 2014; Gabrielson, Grochowski, & Sagara, 2014). Finally, Tyler Vigen’s spurious correlations (Vigen, n.d.) provided humorous examples of complete disconnect between correlation and causation–e.g. the number of new Nicholas Cage films correlating with annual deaths by pool drowning.
IN THE 21 CENTURY Volume 73, 2016
80 challenging them to derive answer choices that could be analyzed at the ordinal, interval, and ratio levels. For example, one group originally asked “approximately how many times [do] you view your social media in a day? A) 0-20; B) 20-60; C) 60-100; D) 100+.” The lecturer explained how open-ended numerical responses could be examined at the interval-ratio level, allowing for the generation of a statistical mean. Another common problem was the composition of survey questions designed to test the respondents’ knowledge, rather than provide the survey authors with information, such as: “what are the signs of abuse? A) Name calling; B) Withholding sex; C) Silent Treatment; D) All of the above.”
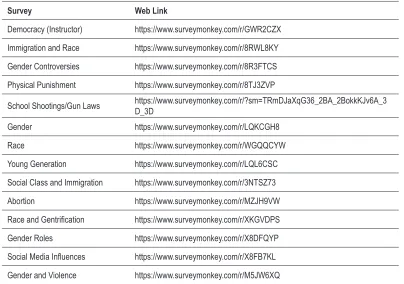
During Week 12, the lecturer instructed his classes on the concepts of population and sample sizes. Students were informed that no grand conclusions about humanity, Americans, New Yorkers, or even BMCC students could be reached via their surveys, but rather only tentative conclusions about the lecturer’s three classes. For the last 45 minutes, the classes broke into their groups and uploaded final drafts of their surveys to SurveyMonkey (Table 2). Each group was only allowed to use one digital device—the classroom computer, the lecturer’s laptop, and laptops that had been brought to class by students. This one-screen policy required group mates to interact (Mitra, 2010). Each group was able to figure out how to use SurveyMonkey with minimal intervention from the lecturer. During this period of experimentation with new software, one student commented something along the lines of, ‘this is fun!’ and later, ‘I can’t wait to take everybody’s surveys!’ reaching a level of enthusiasm the lecturer had rarely seen inside the classroom. This was the same student, however, that regularly uploaded her homework to Blackboard before everybody else, then went back later in the week to write uplifting commentary on her classmates’ homework. In another class, one group of students stayed approximately ten minutes after the conclusion of the class period to work on their surveys; it would be remiss not to mention, however, that these same few students regularly stayed after class to chat with the lecturer.
Table 2. Links to Surveys.
Survey Web Link
Democracy (Instructor) https://www.surveymonkey.com/r/GWR2CZX
Immigration and Race https://www.surveymonkey.com/r/8RWL8KY
Gender Controversies https://www.surveymonkey.com/r/8R3FTCS
Physical Punishment https://www.surveymonkey.com/r/8TJ3ZVP
School Shootings/Gun Laws https://www.surveymonkey.com/r/?sm=TRmDJaXqG36_2BA_2BokkKJv6A_3D_3D
Gender https://www.surveymonkey.com/r/LQKCGH8
Race https://www.surveymonkey.com/r/WGQQCYW
Young Generation https://www.surveymonkey.com/r/LQL6CSC
Social Class and Immigration https://www.surveymonkey.com/r/3NTSZ73
Abortion https://www.surveymonkey.com/r/MZJH9VW
Race and Gentrification https://www.surveymonkey.com/r/XKGVDPS
Gender Roles https://www.surveymonkey.com/r/X8DFQYP
Social Media Influences https://www.surveymonkey.com/r/X8FB7KL
81 At the end of the Week 12 sessions, the lecturer compiled links to all 13 surveys and emailed them to the 50-plus students who still maintained regular class attendance. A week later, the average survey had received only 22 responses. On the last day of class, Week 15, each group led a class discussion, explaining the thought processes that led to the questions and answer choices, comparing their predicted and actual results, and examining what they could have done better. Because SurveyMonkey does not allow non-paying customers to export results to spreadsheets, some manual data-entry was required to find statistical means, which provided the lecturer a perfect opportunity to explain to students the nature of unpaid internships.
Methodology of Research
Four months after the experiment, the author conducted an analysis of the students’ willingness and ability to write about quantitative methods after the conclusion of the pedagogical program. Each student final paper that had received a passing grade (N=36) was assigned a methodology score of 1-4 based the sophistication of its methodological discussion. A score of 1 was assigned to test cases that completely neglected methodological discussion. Test cases that displayed a token discussion of methodology, such as recognition of who had derived the statistic, and what kind of statistic it was (i.e. census data, surveys, crime reports), were assigned a score of 2. A score of 3 was given to test cases that discussed methodological details, such as population and sample size. Finally, a score of 4 was assigned to test cases that displayed skepticism toward the methodology of the data cited in the final paper, such as one student final paper that compared different methods for estimating the number of African slaves brought to the Americas. These 36 test cases were then compared to an expected outcome based on the 43 passing final papers handed in by the author’s students from the previous semester, who had not undergone the pedagogical program, and thus served as a control group. A chi-square test of independence was performed to determine the effect that the experimental pedagogical process had on the students’ ability to discuss quantitative methods in their final papers unrelated to the surveys they had created, conducted, and analyzed.
Although 56 students participated in the experimental pedagogical process, only 36 of these students handed in final papers that received passing grades. Of the 20 students who did not receive passing grades, 11 did not hand in final papers. Six plagiarized papers were removed from the sample selection, as they were not written in the words of the students. The three remaining failing papers were taken out of consideration due to their not meeting basic academic standards. An identical sampling procedure was followed for the control group.
Results of Research
IN THE 21 CENTURY Volume 73, 2016
82 Table 3. Students more able to discuss sociological methods after experimental
pedagogical process (N (%)).
Methodology Score Test Case Expected Outcome
1 6 (16.7) 15.07 (41.9)
2 12 (33.3) 9.21 (25.6)
3 15 (41.7) 10.05 (27.9)
4 3 (8.3) 1.67 (4.7)
Note. χ2 = 9.8, df = 3. Numbers in parentheses indicate column percentages.
*p < .05
Discussion
Table 3 shows that the experimental pedagogical procedure had its desired effect. Students were not merely equipped to discuss the methodology of a sociological survey that they had conducted, but were able to apply this understanding of statistical methods to data in articles that they researched independently, and cited in their final papers. The mode methodology score of the control group was a 1, displaying widespread willingness to completely neglect a major instruction for the composition of the final paper. Less than a third of the control group students were either willing or capable of discussing basic details of the data they were citing, such as the population and sample. The students who participated in the experimental pedagogical procedure, on the other hand, were just as likely to discuss methodological details of the data they cited in their final papers as not. The mode methodology score, after the experiment, went from complete neglect to detailed discussion.
While the expected number of methodology scores of 4—representing highly sophisticated, skeptical discussion of methodology—was nearly doubled by the test group, the low sample size of both groups meant that this was only a difference of one student. It might be too much to expect the typical community college student in an introductory sociology course to attain a level of quantitative literacy that would enable him or her to question the data of professionals. In fact, all five cases of level 4 methodology scores were actually references to methodological skepticism by the authors cited. Across the 79 passing final papers from both semesters, there were no instances of students discussing independently derived criticisms of the methodology of professional sociologists. This may have been caused by students wanting to cite authors that helped prove their theses, but is likely a function of students attaining enough technical literacy to understand academic literature, yet not enough to critique it.
One potential way to remedy this would be for the lecturer to assign more readings throughout the semester of flawed statistical reporting. Another method would be to require the various student groups to critique one another’s surveys. A third potential solution would be to explicitly request students to critique flawed statistical reporting, such as the aforementioned Huffington Post article (Moye, 2016), in their literature reviews. After all, it is not fair to criticize students for failing to achieve a goal that was not asked of them, and which was thought up months after the fact.
83 conceived of as a standalone. Thus, for example, some students’ curiosity about the effect of gender on attitudes toward abortion policy could not be addressed.
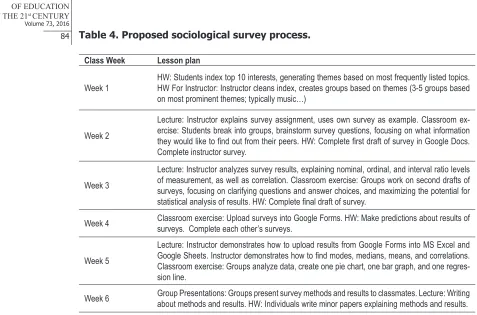
The author has since learned that students can compose, distribute, and complete surveys in Google Forms, and export the data for analysis in Google Sheets. Having students design and conduct their own linear regressions, as opposed to learning about correlation from a lecture, would likely enhance their technical literacy even further. Even if students don’t remember exactly how to conduct these processes in the long run, knowing from experience that it is possible and can be figured out with the help of online tutorials can go a long way toward increasing a student’s self-efficacy.
Going forward, starting this project at the beginning of the semester, rather than halfway through, would benefit students in a number of ways. Having experienced quantitative analysis from start to finish early on should prepare them for their individual and group research at the end of the semester, rather than distract them by occurring simultaneously. Their enhanced understanding of methodology might show in their weekly homework assignments, rather than just their final papers, and might enhance the sophistication of the weekly class discussions of assigned texts. Juxtaposing the students’ highly limited surveys with lessons on national crime data and census records might help students understand that citing a survey of a few dozen undergraduates in one university does not necessarily entitle them to make grand claims about human nature. One student, while researching whether pornography exploited women, was disappointed by the results of the first study he found in the BMCC databases, which he then assumed was gospel. The article’s authors (Salmon & Diamond, 2012) argued that pornography must not oppress or denigrate women because the 60 films they analyzed did not contain significant discrepancies in the position of sex acts according to whether the actors were mixed-gender male-female duos, or homosexual male couples. I had to remind my student of some facts he already knew—that sex and gender are not the same, and that forms of gender roles can occur in homosexual relationships. I also had to inform him that a study of 60 pornographic films does not forever close the book on the question of gendered oppression in pornography, and that his semester-long research must entail comparison of multiple sources.
IN THE 21 CENTURY Volume 73, 2016
84 Table 4. Proposed sociological survey process.
Class Week Lesson plan
Week 1 HW: Students index top 10 interests, generating themes based on most frequently listed topics. HW For Instructor: Instructor cleans index, creates groups based on themes (3-5 groups based
on most prominent themes; typically music…)
Week 2
Lecture: Instructor explains survey assignment, uses own survey as example. Classroom ex-ercise: Students break into groups, brainstorm survey questions, focusing on what information
they would like to find out from their peers. HW: Complete first draft of survey in Google Docs.
Complete instructor survey.
Week 3
Lecture: Instructor analyzes survey results, explaining nominal, ordinal, and interval ratio levels of measurement, as well as correlation. Classroom exercise: Groups work on second drafts of surveys, focusing on clarifying questions and answer choices, and maximizing the potential for
statistical analysis of results. HW: Complete final draft of survey.
Week 4 Classroom exercise: Upload surveys into Google Forms. HW: Make predictions about results of surveys. Complete each other’s surveys.
Week 5
Lecture: Instructor demonstrates how to upload results from Google Forms into MS Excel and
Google Sheets. Instructor demonstrates how to find modes, medians, means, and correlations.
Classroom exercise: Groups analyze data, create one pie chart, one bar graph, and one regres-sion line.
Week 6 Group Presentations: Groups present survey methods and results to classmates. Lecture: Writing about methods and results. HW: Individuals write minor papers explaining methods and results.
Lack of student participation can only partially be circumvented via student lectures. In classrooms with 20-35 students, student lectures increase verbal participation from near 0% during instructor lectures to a maximum of 3-5% per student. Class discussions of classical texts exhibit similar participation numbers, with the added hindrance that most students simply cannot be counted on to read outside the classroom, or take notes that they will reference once they come to class. Assigning discussion questions for homework only serves to widen the gap between the few students who are interested—or obedient—and those who have no qualms about neglecting homework and cognitive involvement in class discussions. Again, it makes sense to fail people who refuse to complete tasks that will be asked of them by almost every employer, such as reading and discussing text. The classroom, however, is not the workplace. Insofar as instructors are at all able to inspire new ideas and habits in students, instructors must work to maximize their ability to do so, and be prepared to utilize different tactics with different students. While completing the pedagogical experiment, students were engaged in near constant dialog with group mates. At times, this dialog centered on conceptual matters of question construction and perception, practical matters of question and answer composition, and technical proficiency in industry-standard word-processors and statistical software. At other times, dialog simply facilitated peer networking, a crucial element to student success (Kuh, Kinzie, Buckley, Bridges, & Hayek, 2006).
85 her about the state of popular beliefs on abortion, or at the very least would inform her of the scope of her struggle. In the end, both the feminist and the lecturer surprised to find that 77% of the 22 respondents answered “no,” and that the mode answers to “in which cases do you believe abortion is a right a woman should have” were a tie between “all cases,” and “depends on the situation,” with only one respondent answering “no right to abortion.” Juxtapose this with an incident during a student lecture later that night, where a devout Catholic student used her five-minute, semester-end lecture to rail against abortion, complimented by an often-misleading—and in some cases simply inaccurate—fact-sheet about how abortion leads to breast cancer, post-traumatic stress, bleeding, complications with anesthetics, breaking up with your boyfriend, and multiple abortions. These two incidents highlight the difference between the more polemical pedagogy of the lecture, which can easily lead to the reproduction of dominant cultural narratives (Levin, 2011), as opposed to creating and conducting surveys, which emphasize curiosity, knowledge of perceptive bias, an understanding of the individual-social dynamic, and which rely on data for conclusions.
Conclusions
The results of this pedagogical experiment suggest that community college students, under lecturer supervision, with minimal prior statistical knowledge, and access to digital media can collaborate in small groups to create and conduct sociological surveys, and discuss methods and results in limited classroom time. The lecturer may not see the same sort of direct, affirmative impact from this pedagogical process as he or she would from intermittently interrupting his or her lecture with rhetorical questions, which are inevitably answered by the same few students. The lecturer should, however, feel confident that a room full of dialogically and intellectually engaged students would most likely result in deep learning that can be applied to similar situations in the future. The lecturer, moreover, should not shy away from allowing students to use digital media in the classroom, especially if it is being done in groups, is under lecturer supervision, and is helping train students in the use of industry-standard software.
The results of this experiment, however, only demonstrate statistically significant educational benefits for those students who ultimately passed the class, which represents merely 36 of the 75 students enrolled in the lecturer’s classes. 24 of the lecturer’s students unofficially stopped attending class midway through the semester. If the pedagogical program were to truly enhance students’ technical literacy, sense of agency, and sense of community, we should see a statistically significant decrease in the number of students who drop out. Meanwhile, 6 students did not feel comfortable writing a sociological paper in their own words, thus resorting to plagiarism. An additional 6 students who came to class regularly did not even attempt to write a final paper, perhaps due to feeling intimated by the prospect of having to write an academic paper. A successful pedagogical program that enhances student comfort with sociological methods through hands-on experience, especially one that occurs at the beginning of the semester, when most students have no idea what sociology is, should additionally reduce the number of students who fail due to plagiarism and neglect of final papers.
In the end, however, there is no getting around the fact that, in the current paradigm of higher education, the lecturer wields the coercive power of the grade-book, and is the authority figure that stands between the student and a degree, and with it the chance of a decent-paying job. This power dynamic, at the heart of the institutionalization process, is sure to increase anxiety and inhibit education in the best of cases, and occasionally leads to outright hostility on both sides. In the 21st century, this power dynamic is best exemplified by the constant struggle
IN THE 21 CENTURY Volume 73, 2016
86 Lastly, no amount of freedom for students to choose sociological inquiries of topical interest can make up for the fact that some students are uninterested in learning, and are only in school to receive a degree; likewise, some lecturers are uninterested in teaching, and are only in school to receive a paycheck. This is not just a problem with the current educational paradigm, but of the socio-economic paradigm faced by every citizen of 21st century industrial
societies. Since education requires interest from both teacher and student, the best results of this proposed pedagogical process might perhaps be seen only in adoption by after-school programs, community groups and volunteer adult-literacy programs, and by parents and children at home. The extreme versatility of the smartphone means that such a program could be conducted on a long car ride to a grandparent’s house, or during a lazy day at the beach. Educators in various settings should always remain malleable to the interests of their students, and should alter their methods depending on the learning style, prior knowledge, and total number of students involved.
References
Ainley, M., Hidi, S., & Berndorff, D. (2002) Interest, learning, and the psychological process that mediate their relationship. Journal of Educational Psychology, 94 (3), 545-61. doi:10.1037//0022-0663.94.3.545.
Atkin, A. J., Corder, K., Ekelund, U., Wijndaele, K., Griffin, S. J., & van Sluijs, E. M. F. (2013). Determinants of change in children’s sedentary time. PLoS One, 8 (6), 1-9. doi:10.1371/journal. pone.0067627.
Attewell, P., Suazo-Garcia, B., & Battle, J. (2003). Computers and young children: Social benefit or social problem? Social Forces, 82 (1), 277-96. doi:10.1353/sof.2003.0075.
Borough of Manhattan Community College. (2016). Student handbook: 2016-2017 [Brochure]. Retrieved from www.bmcc.cuny.edu/communications/pdfs/handbook/current.pdf.
Carey, B. (2015, 27 August). Many psychology findings not as strong as claimed, study says. New York Times. Retrieved from www.nytimes.com.
Cash, H., Rae, C. D., Steel, A. H., & Winkler, A. (2012). Internet addiction: A brief summary of research and practice. Current Psychiatry Reviews, 8 (4), 292-8. doi:10.2174/157340012803520513. Castaño-Muñoz, J., & Senges, M. (2011). Youth-culture or student-culture? Internet use intensity divides
university students and consequences for academic performance. Estudios Sobre Educación,
20, 203-31. Retrieved from www.unav.edu/publicaciones/revistas/index.php/estudios-sobre-educacion/article/viewFile/4557/3927.
Clabby Jr., J. F. (1980). The wit: A personality analysis. Journal of Personality Assessment, 44 (3), 307-10. doi:307-10.1207/s15327752jpa4403_15.
Common Sense Media. (2016). Technology addiction: Concern, controversy, and finding balance [Press release]. Retrieved from www.lakeresearch.com/images/Press_Releases/CommonSense. Technology_Addiction_Research_Brief.pdf.
Diamond, J. (2012). The world until yesterday: What can we learn from traditional societies? New York: Viking.
Fisherkeller, J. (2002). Growing up with television: Everyday learning among young adolescents. Philadelphia: Temple University Press.
Fisherkeller, J. (2011). International perspectives on youth media: Cultures of production and education. In J. Fisherkeller (Ed.), International perspectives on youth media: Cultures of production and education (pp. 1-24). New York: Peter Lang.
Freire, P. (2005). Pedagogy of the oppressed. New York: Continuum. (Original work published 1970). Gabrielson, R., Grochowski, R., & Sagara, E. (2014, 10 October). Deadly force, in black and white.
ProPublica. Retrieved from www.propublica.org.
Garbarino, J. (1976). A preliminary study of some ecological correlates of child abuse: The impact of socioeconomic stress on mothers. Child Development, 47 (1), 178-85. Retrieved from http://www. jstor.org/stable/1128297.
Gilbert, D. T., King, G., Pettigrew, S., & Wilson, T. D. (2016). Comment on “Estimating the reproducibility of psychological science.” Science, 351 (6277), 1037. doi:10.1126/science.aad7243.
87 Grace-Martin, M., Gay, G. (2001). Web browsing, mobile computing and academic performance.
Educational Technology and Society, 4 (3), 95-107. Retrieved from www.ifets.info/journal/4_3/ grace_martin.html.
Hampton, R. L. (1987). Race, class and child maltreatment. Journal of Comparative Family Studies, 18 (1), 113-26. Retrieved from http://www.jstor.org/stable/41601474.
Helles, R. (2013). The big head and long tail: An illustration of explanatory strategies for big data Internet studies. First Monday, 18 (10). doi:http://dx.doi.org/10.5210/fm.v18i10.4874.
Kuh, G. D., Kinzie, J., Buckley, J. A., Bridges, B. K., & Hayek, J. C. (2006). What matters to student success: A review of the literature. Retrieved from https://nces.ed.gov/npec/pdf/Kuh_Team_ Report.pdf.
Langmia, K., & Glass, A. (2014). Coping with smart phone ‘distractions’ in a college classroom. Teaching Journalism and Mass Communication, 4 (1), 13-23. Retrieved from aejmc.us/spig/wp-content/ uploads/sites/9/2014/03/tjmc-w14-langmia-glass.pdf.
Lemish, P. (2011). Facilitating the social reality challenge with youth filmmakers. In J. Fisherkeller (Ed.), International perspectives on youth media: Cultures of production and education (pp. 283-300). New York: Peter Lang.
Levin, D. (2011). “Because it’s not really me”: Students’ films and their potential as alternative media. In J. Fisherkeller (Ed.), International perspectives on youth media: Cultures of production and education (pp. 138-54). New York: Peter Lang.
Levitt, S. D. (1999). The changing relationship between income and crime victimization. Economic Policy Review, 5 (3), 87-98. Retrieved from https://core.ac.uk/download/pdf/6792976.pdf. Li, H., Cui, Y., Bai, X., & Davis, S. (2010). The impact of web browsing on classroom learning
performance. Issues in Information Systems, 11 (1), 460-6. Retrieved from iacis.org/iis/2010/460-466_LV2010_1396.pdf.
López, A. (2011). Practicing sustainable youth media. In J. Fisherkeller (Ed.), International perspectives
on youth media: Cultures of production and education (pp. 317-37). New York: Peter Lang. Luttrell, W., Dorsey, J., Shalaby, C., & Hayden J. (2011). Transnational childhoods and youth media:
Seeing with and learning from one immigrant child’s visual narrative. In J. Fisherkeller (Ed.), International perspectives on youth media: Cultures of production and education (pp. 192-208). New York: Peter Lang.
Mitra, S. (2005). Self organising systems for mass computer literacy: Findings from the ‘hole in the wall’ experiments. International Journal of Development Issues, 4 (1), 71-81. doi:10.1108/eb045849. Mitra, S. (2010). Limits to self-organising systems of learning—the Kalikuppam experiment. British
Journal of Educational Technology, 41 (5), 672-88. doi:10.1111/j.1467-8535.2010.01077.x. Moye, D. (2016, 11 March). Sorry mom: Getting lots of tattoos could have a surprising health benefit.
Huffington Post. Retrieved from www.huffingtonpost.com.
New York Civil Liberties Union. (2014). Stop-and-Frisk during the Bloomberg administration (2002-2013). Retrieved from www.nyclu.org/files/publications/stopandfrisk_briefer_2002-2013_final. pdf.
Nowell, S. (2014). Using disruptive technologies to make digital connections: Stories of media use and digital literacy in secondary classrooms. Educational Media International, 51 (2), 109-23. doi:10 .1080/09523987.2014.924661.
Open Science Collaboration. (2015). Estimating the reproducibility of psychological science. Science, 349 (6251), 716-1-716-8. doi:10.1126/science.aac4716.
Poyntz, S. R., & Hoechsmann, M. (2011). Not just philosophizing: Producing effective youth media and communication projects. In J. Fisherkeller (Ed.), International perspectives on youth media: Cultures of production and education (pp. 301-16). New York: Peter Lang.
Pregitzer, M., & Clements, S. N. (2013). Bored with the core: Stimulating student interest in online general education. Educational Media International, 50 (3), 162-76. doi:10.1080/09523987.201 3.831517.
Salmon, C., & Diamond, A. (2012). Evolutionary perspectives on the content analysis of heterosexual and homosexual pornography. Journal of Social, Evolutionary, and Cultural Psychology, 6 (2), 193-202. doi:10.1037/h0099215.
IN THE 21 CENTURY Volume 73, 2016
88 Silver, N. (2016, 12 January). How we’re forecasting the primaries: And why we might be totally wrong. FiveThirtyEight. Retrieved from fivethirtyeight.com.
Soep, E. (2011). All the world’s an album: Youth media as strategic embedding. In J. Fisherkeller (Ed.), International perspectives on youth media: Cultures of production and education (pp.246-62). New York: Peter Lang.
Stornaiuolo, A., Hull, G. A., Sahni, U. (2011). Cosmopolitan imaginings of self and other: Youth and social networking in a global world. In J. Fisherkeller (Ed.), International perspectives on youth media: Cultures of production and education (pp.246-62). New York: Peter Lang.
van der Veen, I., de Jong, U., van Leeuwen, M., & Korteweg, J.A. (2005). The development of higher education students’ interest in their subject: The case of higher professional education in Netherlands. Studies in Higher Education, 30 (3), 275-89. doi:10.1080/03075070500095705. Vered, K. O. (2011). Center or margin? The place of media play in children’s leisure: Case studies
from Sweden and Australia. In J. Fisherkeller (Ed.), International perspectives on youth media: Cultures of production and education (pp. 228-45). New York: Peter Lang.
Vigen, T. (n.d.) Spurious correlations. Retrieved from tylervigen.com/spurious-correlations.
Wang, C., Burris, M. A., Ping, X. Y. (1996). Chinese village women as visual anthropologists: A participatory approach to reaching policymakers. Social Science and Medicine, 42 (10), 1391-400. doi:10.1016/0277-9536(95)00287-1.
Received: July 23, 2016 Accepted: October 15, 2016
Frederick T. Tucker MA in Liberal Studies, Adjunct Lecturer, Borough of Manhattan Community College, 199 Chambers Street, New York, NY, 10007 USA.