Developing a New Suit Sizing System
Using Neural Network
Morteza Vadood, Maryam Salehi Esfandarani, Majid Safar Johari
Amirkabir University of Technology, Textile Engineering, Tehran, Tehran IRAN
Correspondence to:
Morteza Vadood email: [email protected]
ABSTRACT
Manufacturing garments has the highest added value in the textile industry. Presently, most sizing systems are outdated, so each country needs to develop a new sizing system for its people. The main goal of this work was to present the new sizing chart for Iranian male suites using an artificial neural network. 10 effective sizing variables for producing suits are determined, and then all different body sizes are clustered using the Kohonen neural network. Aggregate loss is used as a tool to measure fitness of the newly obtained sizing chart. The results have a good coverage on Iranian body types, and could be used as a reference for apparel companies in Iran and other companies which produce suit for Iranian males.
Keywords: Sizing chart, Cluster analysis, Kohonen neural network, Suit sizing system
INTRODUCTION
In marketing, the main goals are to create, keep, and
satisfy customers. Companies can improve
profitability of their interactions by learning and developing relations in contact with the customers. Certainly, creating a model about customer relations can make basic and applicable changes for companies, and this model can be beneficial when companies attend to customer requirements and preferences and learn from past interactions how to serve them better in the future. Apparel, home textile, and technical textile are three important parts of the textile marketing [1], but apparel marketing has the highest added value and is more significant in terms of volume.
Most of the sizing systems are outdated; moreover people who live in various counties due to differences in the race, climate, and nutrition have different body sizes [2-3].
These problems make some difficulties for the customers when selecting the right size and as a result some emotional issues are faced by the customers that may be associated with the lack of suitable fitness of apparel and affect the apparel marketing [4]. Loker [5] indicated that 50 percent of garments are returned due to fitting problems. So there is an urgent need to develop a new sizing system with the better fitness. Because of complex relation between the body and clothing, apparel sizing and fitness are difficult concepts.
Ashdown [6] and Deonier et al. [7] tried to develop a new sizing system to reduce fitness problems. They used various methods ranging from trial and error to use of elaborate statistical methods, but the problem of the best fitting is not solved yet. In recent years, more attention has been attracted to develop updated sizing systems. A few researchers developed new sizing systems based on statistical analysis [8]. In recent decades, some new sizing systems have been developed according to data mining techniques [8]. Hsu [9] utilized a data mining framework, using anthropometric data, to develop industrial standards for adult females. In that work, a two-stage cluster approach was used to generate useful patterns and rules for standard sizing charts of females in Taiwan. Also, in another work Hsu et al. [10] established a sizing system using a decision tree technique to determine the pants sizes of army soldiers. This developed sizing system can provide garment manufacturers with size specifications to solve fitness problems. Presently, artificial neural networks have a wide range of applications like predicting and clustering in many industries. Kohonen neural network (KNN) is used for clustering and has some interesting advantages, such as simple structure, finding the clusters rapidly, and presenting them easily; learning is an unsupervised and self-organized property [11].
TABLE I. Statistical analysis of suit sizing variables.
Variable Number Minimum Maximum Mean Std. Deviation Variance
Knee girth 655 66.00 87.00 77.79 12.53 3.54
Thigh girth 655 39.00 60.00 50.38 9.39 3.06
Hip circumference 655 54.00 74.00 63.94 10.19 3.19
Waist circumference 655 41.00 70.00 53.12 24.33 4.93
Trouser height 655 38.00 74.00 52.86 34.79 5.90
Stomach circumference 655 92.00 120.00 104.80 27.12 5.21
Chest circumference 655 32.00 68.00 47.61 36.50 6.04
Sleeve height 655 44.00 74.00 56.87 28.75 5.36
Shoulder height 655 27.50 48.00 37.68 9.45 3.07
Coat height 655 22.00 39.00 28.70 6.69 2.59
The aim of this research was to present a new sizing system using artificial neural network technology. In Iran the most common official clothing for males are suits, but the sizing chart for producing suits is outdated and is based on the sizing chart of other countries, so there is an urgent need for garment manufactures to have a new sizing chart based on Iranian male body types. On the other hand, developing a new sizing chart, due to extensive growth in globalization, will be useful for apparel companies, and it can extend their business to other countries.
DATACOLLECTION
By consulting domestic experts, 10 sizing variables which are necessary for producing suits were determined. These variables are coat height, armhole girth, sleeve height, knee girth, trouser height, and waist, chest, stomach, thigh and hip circumferences. A large database containing these variables that were recorded in a garment company was used. This raw database includes 675 samples, missing data replaced with new value by series mean
algorithm. At first, it is necessary to verify and examine all data. In this work all samples whose characteristics were not limited to ±σ from the mean were omitted [12]. As a result of this limitation, 20 samples were omitted, since they were considered as abnormal and out-layer data. After these stages all cleaned and verified data were ready for mining.
Table I shows the description of statistical data analysis.
KOHONENNEURALNETWORK
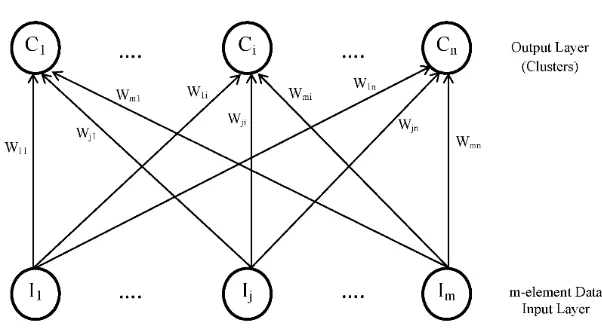
The Kohonen neural network (KNN) is a single layer neural network which can be used for clustering. The data are presented to the input layer and each cluster is set as a neuron in the output layer and associated to the input neurons with specified weights. Figure 1
shows the structure of the Kohonen by n-cluster and m-element data input layer. Regarding the Kohonen training rule, by calculating the Euclidean distance between each m-element input data and the weights of each cluster, the closest cluster to the input data is determined and the cluster weights are updated according to Eq. (1) [13].
w w I - w
ji ji α j ji
= + (1)
Where: wji, α, Ijare the associated weight on the jth element of the input data and ith cluster, learning rate and the value of jth element, respectively. At the end of the KNN training, the cluster of each data can be determined by using Euclidean distance easily.
RESULTSANDDISCUSSION
In this study, the training epoch was considered 500 and due to direct impact of learning rate on the KNN result, the learning rate was considered 0.01, 0.2, 0.4, 0.6, 0.8 and 1. Because of random selection of initial weights, the KNN was run 5 times for each case and the best obtained results were considered for that KNN. In the previous study, it was found that 5 and 7 clustering can be presented the best data clustering, so in this study only 5 and 7 clustering were considered [14].
The aggregate loss, entitled loss of fit value (LOF), is a tool to measure how well the new sizing system performs in fitting the population. The LOF value is actually the average of Euclidean distance between all individuals and their assigned size over the valid data and calculated as Eq. (2). Consulting with domestic experts has shown that the chest, waist and hip circumferences are the major dimensions for determining size, so the LOF value was calculated according to these dimensions.
( ) ( ) ( )
n n n
2 2 2
i i i i i i
i 1 i 1 i 1
c wc w ww h wh
LOF
n
= = =
− + − + −
= ∑ ∑ ∑
(2)
Where ci, wiand hi are the actual value of chest, waist and hip circumferences for the ith person, respectively and wci, wwi and whi are the value of associated cluster weights against chest, waist and hip circumferences for the ith person in the sizing chart, respectively and n is the number of persons in this study. At first, the LOF value is calculated for each cluster separately. Then, the LOF value in each learning rate is determined by averaging over the all clusters LOF values. Table II shows the calculated LOF for different learning rates.
TABLE II. The calculated LOF for learning rates.
LOF of the 7 clustering
LOF of the 5
clustering Learning rate
3.6861 4.1148 0.01
4.1 4.1834 0.2
4.1642 4.22 0.4
4.3284 4.4341 0.6
4.5041 4.5381 0.8
4.7633 5.1686 1
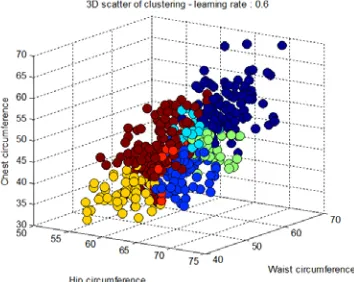
FIGURE 2. 3D scatter plot of 5 clustering.
The ideal value of the LOF can be calculated by allowing 2.54 cm deviations of the sizing chart, so in this research the ideal value is 4.39 and if a LOF value is closer to 4.39 than others, the sizing chart of that LOF can present a better fitting for the population. As can be seen in Table II, when the learning rate is very close to 0, the LOF value is the minimum and by increasing learning rate the LOF value increases as in learning rate 1, it gains the maximum value in both of 5 and 7 clustering. Whereas in the learning rate 0.6 the LOF value for the 5 and 7 clustering are very close to 4.39, Therefore the best choice is 0.6 for the learning rate of the KNN in 5 and 7 clustering.
TABLE III. Obtained results in 5 clustering with learning rate 0.6.
Cluster 1 2 3 4 5
LOF 4.157 4.678 4.659 3.995 4.682
Label Small Large Medium X Small X Large
Number of members 152 19 281 100 103
Percentage of each size 23.21% 02.90% 42.90% 15.27% 15.73%
TABLE IV. Obtained results in 7 clustering with learning rate 0.6.
Cluster 1 2 3 4 5 6 7
LOF 4.244 4.224 4.176 3.797 4.703 3.824 5.351
Label Large Medium Small 2X Small X Large X Small 2X Large
Number of members 128 134 36 76 66 48 167
Percentage of each size 19.54% 20.46% 05.50% 11.60% 10.08% 07.33% 25.50%
Because of more clusters in 7 clustering, individuals can be split up with higher accuracy (Table II, learning rate=1 in 7 clustering against 5 clustering), on the other hand some clusters may include only a few members and most of individuals are associated in same cluster (Table II, learning rate=0.01 in 7 clustering against 5 clustering). Figure 2 and Figure 3 show the 3d-scatter plots of clustering for all individuals in 5 and 7 clustering with learning rate
0.6, respectively. Each cluster is indicated with different color. Table III and Table IV show the obtained results as well as LOF and label for each cluster in 5 and 7 clustering with learning rate 0.6, respectively. Therefore, manufactures can produce suits in 5 or 7 labels and be sure about fitting the population using this new sizing system. The results have a good coverage on Iranian body types.
TABLE V. New sizing chart using 5 clusters.
TABLE VI. New sizing chart using 7 clusters.
Sizing Variables Cluster 1 Cluster 2 Cluster 3 Cluster 4 Cluster 5 Cluster 6 Cluster 7
Coat height 82.13 77.98 77.88 79.33 71.69 77.07 73.83
Shoulders distance 52.98 51.73 51.08 50.79 46.11 48.62 47.61
Sleeve height 67.67 64.95 64.52 65.92 59.33 62.66 58.80
Chest circumference 60.25 51.33 54.00 53.67 48.34 51.15 51.76
Stomach circumference 62.20 50.23 53.66 53.86 47.43 51.83 52.21
Trouser height 110.33 105.73 105.18 108.76 98.39 104.31 99.09
Waist circumference 55.96 45.69 50.20 48.78 42.74 46.98 48.47
Hip circumference 61.59 56.12 58.98 57.20 52.98 55.66 55.94
Thigh girth 42.10 37.25 39.82 38.04 33.98 37.92 37.06
Knee girth 32.13 27.82 29.75 28.91 27.20 28.88 27.66
As can be seen in Table III and Table IV, by increasing the number of clusters some clusters include fewer members compared to other clusters. Thus, increasing the number of clusters makes a non-uniform distribution in the number of members
among the clusters. Although producing garments according to the 7 clustering having some labels with very low members can be better in fitting the
population, but is not very profitable for
manufactures economically. Therefore, using 5 Sizing Variables Cluster 1 Cluster 2 Cluster 3 Cluster 4 Cluster 5
Coat height 79.46 77.58 80.06 76.23 73.14
Shoulders distance 51.58 49.82 52.06 49.32 45.95
Sleeve height 64.74 63.80 65.65 61.65 61.50
Chest circumference 57.46 51.03 53.86 52.16 46.91
Stomach circumference 60.58 50.87 53.28 52.98 46.11
Trouser height 107.47 103.84 106.58 101.33 100.35
Waist circumference 54.05 46.92 48.70 47.47 41.59
Hip circumference 63.94 54.21 58.13 55.32 51.05
Thigh girth 40.87 37.04 38.82 36.92 33.91
clustering having uniform distribution in the number of members among the clusters and good LOF can be an ideal choice as a sizing system for manufactures.
TableV and VI present the new sizing system based on the 5 and 7 clustering.
CONCLUSION
Producing garments has the highest added value in the textile production chain. Due to variation in race, climate, and diet people who live in different countries have different body sizes, thus it is necessary for each country to have its own sizing chart. In Iran the most common official clothing for males is the suit, but the used sizing chart is outdated and belongs to other countries. Therefore, there is an urgent need to a new sizing chart based on Iranian male body type. In this study a new sizing chart was developed using KNN. 10 effective sizing variables, for producing suit were determined and all data were clustered using KNN. The LOF index was used as a tool for measuring fitness of new sizing chart. By evaluating the learning rate, it was found that the value of learning rate equals 0.6 for 5 and 7 clustering results in the best sizing chart with the highest accuracy. The resulted sizing charts have a good coverage on body types and could be used as a reference for apparel companies in Iran and the other companies that produce suits for Iranian males.
REFERENCE
[1] Thomassey, S. “Sales forecasting clothing industry: The key success factor of the supply”, Int. J. Production Economics, Vol. 128, No. 2, 2010, 470-483.
[2] Zheng, R., Yu, W, Fan, J, “Development of a new Chinese bra sizing system based on breast anthropometric measurements”, International Journal of Industrial Ergonomics, Vol. 37, No. 8, 2007, 697-705. [3] Chung, M.J., Lin, H.F, Wang, M.J, “The
development of sizing systems for Taiwanese elementary- and high-school students”, International Journal of Industrial Ergonomics, Vol. 37, No. 8, 2007, 707-716. [4] Webster, J.R, “An investigation of retailer
perception apparel sizing issues”. Academy of World Business, Marketing & Management Development, Vol. 2, No. 77, 2006, 918-926.
[5] Loker, A.S, “size specific analysis of body scan data to improve apparel fit”, Journal of Textile and Apparel Technology and Management, Vol. 4, No. 3, 2005, 1-15.
[6] Ashdown, S, P, “An investigation of the structure of sizing systems”, International Journal of Clothing Science and Technology, Vol. 10, No, 5, 1998, 324-341.
[7] Deonier, C.J, DeLong, M.R, Martin F.B,
Krohn. K.R, “A multivariate method of classifying body form variation for sizing women s apparel”, Clothing and Textile Research Journal, Vol.4, No.1, 1985, 38-45. [8] Lin, H.F, Hsu, C.H, Wang M.J, “An application
of data mining technique in engineering to facilitate production management of garments”, proceedings of the 11th WSEAS international conference on computers, Agios Nikolaos, Crete Island, Greece, 2007, 56-61. [9] Hsu, C.H, “Data mining to improve industrial
standards and enhance production and marketing: An empirical study in apparel industry”, Expert Systems with Applications, Vol. 36, 2009, 4185 4191.
[10] Hsu, C.H, Jiun, M, Wang, J, “Using decision tree-based data mining to establish a sizing system for the manufacture of garments”. Int J ADV Manu, Vol. 26, No. 56, 2005, 669-674.
[11] Bianchia, D.C, “Kohonen neural networks and genetic classification”. Mathematical and Computer Modeling, Vol. 45, 2007, 34-60. [12] Moon, J.Y, Nam Y.J, “A study the elderly
women s lower figure type classification and lower garment sizing systems”, In proceedings of international economics association conference, Korea, 2003.
[13] Fausett, L.V, “Fundamentals of neural
networks”. New Jersey, US, Prentice Hall International. 1994.
[14] Salehi Esfandarani, M.S, Fitness upgrading in producing garment. Research Journal of textile and apparel, impressed, 2011.
AUTHORS’ ADDRESSES Morteza Vadood
Maryam Salehi Esfandarani Majid Safar Johari
Amirkabir University of Technology Textile Engineering
Hafez Avenue Tehran, Tehran 0098