Part II. Predicting the Pilling Tendency of the Cotton
Interlock Knitted Fabrics by Artificial Neural Network
Gonca Özçelik Kayseri, Erhan Kirtay
Ege University, Textile and Apparel Research and Application Center, İzmir TURKEY
Correspondence to:
Gonca Özçelik Kayseri email: [email protected]
ABSTRACT
Artificial neural network (ANN) is a mathematical model inspired by biological neural networks and it processes information using a connectionist approach to computation. The aim of the second part of the study is to determine models for estimating the pilling propensity of the interlock knitted fabrics produced from yarns of different yarn counts (Ne 20, Ne 30, Ne 40) and yarn twist coefficients (αe=3.2,
αe=3.6, αe=4.0) spun by using seven different cotton
types harvested from different regions. The fabrics were manufactured in three different tightness factors, including dense, medium, and loose, by changing the yarn length utilized in each course of the fabrics. The models for pilling degree, total pill number, total weighted pill number, average pill area, and average pill height of the fabrics evaluated by PillGrade Objective Pilling Grading System, were derived by using a neural network method. In order to define the effective properties on pilling formation, sensitivity analysis was carried out. All models indicated relatively good estimation power. Fabric cover factor and short fiber content were found as the most significant parameters influencing the pilling propensity feature of the interlock knitted fabrics.
INTRODUCTION
The pilling feature of textile fabrics refers to an unpleasant appearance caused by bunches or balls of tangled fibers held to the surface. This can seriously compromise the acceptability of the fabric for apparel [1]. Previous researchers have identified many factors that contribute to fabric pilling in every stage of the fiber to fabric processing chain. Fiber properties (fiber type, diameter, tensile strength, fatigue, bending rigidity, initial modulus), yarn properties (twist factor, hairiness, blend ratio), and fabric properties (structure, density) are the effective characteristics on pilling formation [2-4].
The evaluation of pilling formation is also a great concern of the textile industry. In that sense, several methods to quantify pilling formation have emerged
over the years. Basically, a pilling tester is used for pilling generation in samples of original fabric. Despite the many methods in existence, the textile industry is still using a subjective approach to evaluate pilling formation. This method is simple and easy, but due to its subjectivity, uncertainties always remain. Additionally, such classification must be performed by experts in order to obtain valid and acceptable results [5-6]. Therefore, the studies in recent years on pilling are generally focused on the objective pilling evaluation by using image analysis methods [7- 10].
Furthermore, many studies on the factors giving rise to pilling and on the pilling mechanisms were carried out by several researchers. However, there are not many studies on the estimation of pilling characteristics using the fiber, yarn, and fabric features by considering the complex interactions of these various factors.
A comprehensive model allowing the prediction of the fabric features from fiber and yarn properties and production parameters is very important for the textile experts. In this scope, the linear and nonlinear relationship between independent variables and the property to be predicted is of high importance. The application of intelligent systems such as artificial neural networks, fuzzy logics, etc., show great potential because these systems can adapt to the nonlinear relations easily [11]. As one of these systems, neural networks have been used extensively in various textile disciplines ranging from the classification of fiber to yarn, fabric, nonwoven, and cloth defect detection and categorization, yarn and fabric properties prediction, and modeling [12].
function. Such a model has three simple sets of rules: multiplication, summation, and activation. At the beginning of the artificial network the inputs are weighted, meaning that every input value is multiplied with an individual weight. In the middle section the summation function sums all weighted inputs and bias. At the end section, the sum of previously weighted inputs and bias passes through an activation function that is also called a transfer function. A mathematical description of the artificial neural network model is given in Eq.(1) [13].
0
( )
(
( ). ( )
)
m
i İ i
y k
F
w k x k
b
=
=
∑
+
(1)where xi(k) is the input value, wi(k) is the weight
value, y(k) is the output value in discrete time k, b is bias, and F is a transfer function.
The powerful modeling and the prediction capability of ANN has been successfully applied for predicting knitted fabric properties, garment comfort evaluation, detection and classification of defects in knitted fabrics [14].
Beltran et al., used artificial neural network methodology for the prediction of pilling propensity of single jersey and 1/1 rib wool fabrics. Fiber properties, (diameter, diameter CV%, fiber content>30 µm, curvature), top properties (hauteur length, length variation, short fiber content, bundle strength, strain), and yarn specifications (count, hairiness, thin and thick places, twist factor, folding twist ratio) along with the fabric cover factor served as quantitative inputs to the neural network. It was found that the network manages to correctly classify eight out of the ten test data sets [15]. In another study conducted by Beltran et al., the ANN pilling model was developed on the basis of a feed-forward multilayer perceptron (MLP). Validation of the model on an independent data set suggested that the accurate prediction of pilling propensity was possible with the best performing model achieving a correlation with the subjectively rated pilling grades of approximately 85%. The predictive ability of the MLP was compared to that of classical multivariate linear regression (MLR). The MLP model demonstrated a superior capacity (R2=0.881) in the prediction of the pilling propensity compared to the MLR algorithm (R2=0.571) [16].
In a study, the contribution of various fiber, yarn, and
forwards/backwards search, and genetic algorithms were used to identify the importance of various fiber/yarn/fabric input parameters. The three different techniques showed broad similarities in their assessment of which input parameters were important or not in affecting fabric pilling. The ranking showed that the fabric cover factor was the most effective property on pilling, followed by yarn count, thin places, fiber length, and yarn twist [17].
Uçar and Ertugrul, predicted the amount of fuzz on the cotton fabric surface, determined by image processing techniques. The artificial neural network (ANN) and regression analysis were compared. According to the sum square of total error and the correlation coefficient values, ANN gave better results compared to the regression analysis for pre-dicting the fuzziness on the fabric surface [18]. Yun et al., developed an objective pilling evaluation method using image analysis and an artificial neural network. Eighteen woven and 12 knitted samples were tested to investigate the effect of the fabric structure on the performance of the network. The suitability of the method was tested with 55 woven fabric samples and a model for the prediction of the pilling grade was found to be acceptable, especially for woven fabrics [19]. In a study carried out by Rejali et al., the effects of fiber, yarn, and fabric parameters on the pilling performance of weft knitted fabrics produced from wool/acrylic blended yarns were investigated. Material type and number of feeding yarns had the largest and smallest effect on the pilling performance. Knit density, knit structure, yarn twist, and yarn count were the other significant factors respectively [2]. Wang et al., used the support vector machines (SVM) data mining tool for the prediction of wool knitwear pilling. The result indicated that by using the binary classification method and the radial basis kernel function, the SVM was able to give high pilling propensity prediction accuracy for wool knitwear [20].
In this study, it was aimed to develop models for the prediction of pilling propensity of interlock knitted fabrics by using an artificial neural network considering the presence of the complex relationship between the fiber and fabric properties. In this way, the most effective fiber, yarn, and fabric properties on pilling formation of the fabrics were attempted to be determined.
TEST MATERIALS
Rieter G 30 ring spinning machine with a spindle speed of 10000 rev/min. The yarns were spun in Ne 20, Ne 30, and Ne 40 yarn linear densities and in three different yarn twist coefficients, αe=3.2, αe=3.6,
and αe=4.0. Since a full factorial experimental design
was used, a total of 63 different yarns (7 cotton blends x 3 yarn linear densities x 3 yarn twist coefficients) were produced. Yarns in cone form were wound in bobbin form by using a semi-automatic Schlafhorst Autoconer magazine type winding machine having 9 winding positions.
From previous work, it was determined that rib knitted fabrics were resistant to pilling, interlock knitted fabrics are less resistant, and plain knitted fabrics tend to pill more [21]. Therefore, in order to obtain a wide range of pilling formation, the interlock knitted type was selected for the study.
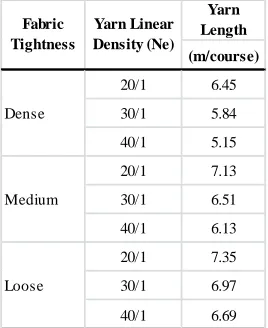
Fabrics were produced by using a Fouquet marked jacquard circular knitting machine in 18 gauge and 30 inch diameter, suitable for the production of the fabrics in the selected tightness values. The fabrics were produced in dense, middle, and loose structure by adjusting the yarn length utilized in each course of the fabrics. Therefore from 63 yarns, a total of 189 interlock knitted fabrics were produced. An MLT Wesco electronic yarn feeding measurement apparatus was used for the tightness adjustment by changing the yarn length and the distance between the cylinder and dial needles. For each yarn linear density and fabric tightness value, the yarn length in each course of the fabric was kept constant as shown in Table I.
TABLE I. The yarn length per course for each yarn linear density.
Yarn Length (m/course)
20/1 6.45
30/1 5.84
40/1 5.15
20/1 7.13
30/1 6.51
40/1 6.13
20/1 7.35
30/1 6.97
40/1 6.69
Medium
Loose
Fabric Tightness
Yarn Linear Density (Ne)
Dense
TEST PROCEDURES
The fiber properties were determined by using an USTER AFIS PRO 2 instrument consisting of three different measurement modules. Fiber properties were given in the first part of the study [22]. The yarn linear density, hairiness, and mass coefficient of variation values were measured by an USTER TESTER 5 instrument. The yarn twist coefficient was measured according to the untwist-twist method based on the EN ISO 2061 standard [23]. The fabric cover factor was determined by measuring a length of loop yarn, loop height, and loop width. It is the ratio of the yarn-covered area in a loop to the loop area. The cover factor of the fabrics was calculated according to the Eq. (2) as given below.
cxw
lxd
looparea
yarnarea
r
Coverfacto
=
=
(2)where, l is loop yarn length, d is yarn diameter, c is loop height, w is loop width.
The pilling test of the interlock knitted fabrics was carried out according to the EN ISO 12945-2 standard at 2000 revolutions using a James Heal Nu-Martindale instrument [24]. In the evaluation of the pilled fabric samples, a PillGrade Objective Pilling Evaluation System was used for eliminating the subjectivity of the pilling evaluation. The PillGrade system is an automated pilling grading system developed to provide objective and repeatable pilling assessment by measuring pilling grade, total pill density, total pill count, weighted pill count, weighted pill density, average pill diameter, and fuzz loft values. The detail of the system was given in the first part of study [22].
All tests were repeated 10 times for each of the test specimens under standard atmospheric conditions of 20 ± 2°C and 65 ± 4% relative humidity after a minimum period of 24 hours conditioning in an EN ISO 17025 certified laboratory.
STATISTICAL PROCEDURES
In this study, for model construction of each pilling feature, a multilayer feed forward network with two hidden layers trained by a back propagation algorithm was used. This artificial neural network structure is known as multilayer perceptrons (MLP). The models for all pilling features consisted of one input layer, one hidden layer, and one output layer. Learning rate was used as 0.01 and a momentum coefficient was selected as 0.3 in this study. For the activation (transfer) functions, a hyperbolic function was used in the hidden layer and a linear function was used in the input and output layers. The pilling features of 140 interlock knitted fabrics (75% of all fabric samples) were randomly selected as training data, and the remaining 49 test results (25% of all fabric samples) of the fabric samples were used as testing data, therefore, in this way, the testing samples were not used in the training step.
For the selection of the most appropriate model, the model having a high correlation coefficient between the predicted and real values, a mean error value close to zero, including a mean error standard deviation lower than the data standard deviation, and a ratio of standard deviation of predicted values to a standard deviation of real values lower and below one are considered.
Artificial neural network models for each pilling property measured by PillGrade, such as pilling grade, total pill count, weighted total pill count, average pill area (cm2), and average pill height (mm), were developed using the fiber properties such as weight based length value (Lw), length variation (Lw
CV%), short fiber content (SFCw), fiber fineness
(mtex), immature fiber content (IFC %), maturity ratio, and by yarn properties such as yarn mass coefficient of variation (CVm%), hairiness (H),
hairiness variation (sH) values, yarn linear density (Ne) and twist count per meter (T/m), and by using fabric properties, such as fabric cover factor value.
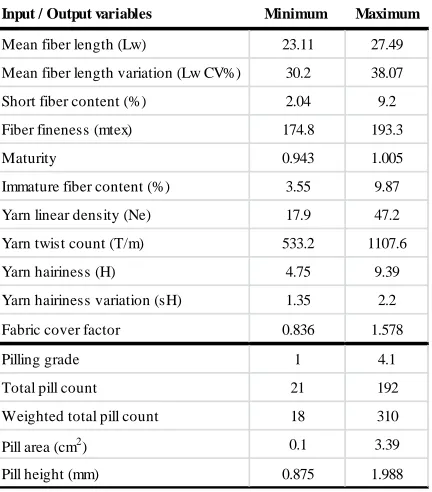
Table II indicates the minimum and maximum values of input and output variables. The range of all input and output variables were kept as large as possible since the neural network models generally have good estimating power in the range of the calculation interval. Since the material used for the production of the fabrics is cotton and most of the input variables belong to the fiber properties, the ranges are kept due to the natural characteristics of cotton fiber.
TABLE II. Maximum and minimum values of input and output variables.
Input / Output variables Minimum Maximum
Mean fiber length (Lw) 23.11 27.49
Mean fiber length variation (Lw CV%) 30.2 38.07
Short fiber content (%) 2.04 9.2
Fiber fineness (mtex) 174.8 193.3
Maturity 0.943 1.005
Immature fiber content (%) 3.55 9.87
Yarn linear density (Ne) 17.9 47.2
Yarn twist count (T/m) 533.2 1107.6
Yarn hairiness (H) 4.75 9.39
Yarn hairiness variation (sH) 1.35 2.2
Fabric cover factor 0.836 1.578
Pilling grade 1 4.1
Total pill count 21 192
Weighted total pill count 18 310
Pill area (cm2) 0.1 3.39
Pill height (mm) 0.875 1.988
RESULTS AND DISCUSSION Modeling of Pilling Grade
Multilayer feed forward network model for pilling grade consists of input, hidden, and output layers including six neurons in the first and second layers and one neuron in the last layer. The number of neurons in the input layers express the number of independent variables in the model. Figure 1
indicates the neural network model for pilling grade in the form of MLP 6:6-6-1:6 structures.
The descriptive statistics of the training, testing, and overall data used in the model for the prediction of pilling grade are given in Table III. The table contains the mean and the standard deviation of pilling grades and, as can be seen, the values for all kinds of data are close to each other. Mean error values are near zero. Mean square error (MSE) is the average of the square of the difference between the predicted and real values and this value for all data is quite low. Root mean square error (RMSE) is the square root of the mean square error and is in the same range of mean square error values. Mean absolute error (MAE) and root mean square error (RMSE) are other indicators of the variation in the estimate. The equality of these two values (MAE=RMSE) means that the scale of the errors are in the same range. However, RMSE is generally greater than or equal to MAE and the greater the difference between them, the higher the variance between the error values. The correlation and the regression coefficients between the predicted and real data are rather high as well. For training data, the regression coefficient between the real and predicted values is 86.43%, whereas for testing data this value is found to be 82.02%. Since testing data are selected randomly, the statistical results of testing data are better indicators for the estimation power of the model compared to the results of training data.
TABLE III. Descriptive statistics for the ANN model of pilling grade.
Pilling grade Training data Testing data Overall data
Mean value (M) 1.6 1.67 1.62 Data standard deviation (SD) 0.54 0.6 0.56 Mean error (ME) -0.003 -0.019 0.0017 Mean square error (MSE) 0.05 0.08 0.05 Root mean square error (RMSE) 0.22 0.28 0.23 Mean absolute error (MAE) 0.16 0.24 0.18 Correlation coefficient (r2
) 0.9296 0.9057 0.9227 Regression coefficient (R2
) 0.8643 0.8202 0.8514
Sensitivity analysis can be carried out which defines the contribution effects of each independent variable within the model. Sensitivity ratio represents the rate of the mean error value, in case the variable is missing in the model, to the total mean error value. In this case, the greater the sensitivity ratio, the higher the contribution of that variable to the estimation power of the model. The result of the sensitivity analysis is given in Table IV.
TABLE IV. Sensitivity analysis for ANN model of pilling grade.
Fabric cover factor (C)
Yarn linear density (Ne)
Yarn twist count (T/m)
Short fiber content (SFCw)
Immature fiber content
(IFC)
Mean fiber length (Lw)
Ratio 2.93 2.53 2.48 1.46 1.4 1.36
Rank 1 2 3 4 5 6
As can be seen from the sensitivity analysis, the most effective property in the pilling formation of the interlock knitted fabric is found as the fabric cover factor with a ratio of 2.93. As the fabric gets tighter, the movement of the fibers to the fabric surface becomes restricted and therefore pilling tendency decreases. Yarn linear density, yarn twist count, short fiber content, immature fiber content, and mean fiber length are respectively the other important features affecting pilling propensity of the fabrics. The result of the sensitivity analysis for pilling grade is in good accordance with the study carried out Beltran et al., [17].
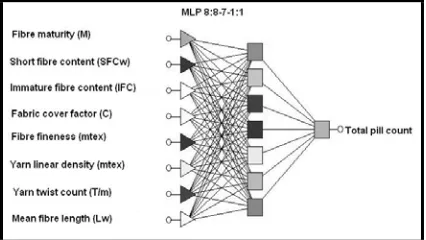
Modeling of Total Pill Count
In order to design a neural network for total pill count, which is the total number of pills in the inspection area, 11 different fiber, yarn, and fabric properties were included in the calculation, however, only 8 of these inputs were selected for the model. Accordingly, the network structure is in the form of MLP 8:8-7-1:1 and is composed of 3 layers. In the input layer, there are 8 neurons as the number of the independent variables within the model. The hidden layer consists of 7 neurons and the output layer has one neuron. The model for total pill count is given in
Figure 2. The ANN network of total pill count consists of fiber maturity, short fiber content, immature fiber content, fiber fineness, fiber length, yarn linear density, yarn twist coefficient, and fabric cover factor.
The descriptive statistics of the training, testing, and overall data used in the model for the prediction of total pill count are given in Table V.
TABLE V. Descriptive statistics for the ANN model of total pill count.
Pilling grade Training data Testing data Overall data
Mean value (M) 121.72 128.67 123.68
Standard deviation (SD) 29.44 28.02 29.18
Mean error (ME) -0.0047 -0.956 -0.24
Mean square error (MSE) 134.09 175.18 144.25
Root mean square error (RMSE) 11.58 13.24 12.01
Mean absolute error (MAE) 9.12 10.61 9.49
Correlation coefficient (r2) 0.9307 0.9039 0.9255
Regression coefficient (R2) 0.8661 0.8197 0.8565
When the descriptive statistics of the ANN model for the total pill count is analyzed, it can be seen that mean error values are close to zero, especially that of training data. The differences between the RMSE and MAE values are minimal, which means that the variation of the error values is low, particularly for training data. Regression and correlation coefficients between the real and predicted total pill count values are rather high. Since testing data are selected randomly, the coefficient values of this data are better indicators for the estimation power of the model and with a 0.9039 correlation coefficient and a 0.8197 regression coefficient, it can be stated that the model is quite satisfactory in predicting total pill count values of the interlock knitted fabrics.
The sensitivity results of the ANN model of total pill count is given in Table VI. Since the correlation between the fiber properties measured by the AFIS PRO instrument and total pill count value is found statistically significant, the model for the prediction of this pilling feature consists of 5 fiber properties, including maturity ratio, short fiber content, immature fiber content, fiber fineness, and mean fiber length. Three of these properties are found to be the most effective properties in the sensitivity analysis. As the maturity ratio, short fiber content, immature fiber content, and fiber fineness increase, the number of the total pills formed on the fabric surface increases.
TABLE VI. Sensitivity analysis for ANN model of total pill count.
Yarn twist count (T/m)
Mean fiber length (Lw) Fabric
cover factor ( C ) Maturity
ratio ( M )
Immature fiber content
(IFC) Short fiber
content (SFCw)
Fiber fineness
(mtex) Yarn linear density (Ne)
Modeling of the Difference between the Weighted and Total Pill Count
In order to understand pill structure, the PillGrade objective pilling evaluation system measures the weighted total pill count by considering the size of the pills. With the increased difference between the total pill count and weighted total pill count values, it can be understood that the size of the pills are large. Therefore, in order to ascertain the structure of the pills, the prediction of the difference between the total pill count and weighted total pill count values
(WTPC-TPC) is carried out by using the fiber, yarn, and fabric properties as input variables.
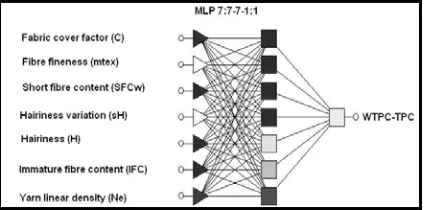
The ANN model for the difference between the total pill count and weighted total pill count values is in the structure of multilayer perceptrons 7:7-7-1:1, containing 3 layers. In the first input layer there are 7 neurons which are equal to the number of the independent variables within the model. The neuron number is 7 in the hidden layer and 1 in the output layer. The model for the difference between the total pill count and weighted total pill count values
(WTPC-TPC) is given in Figure 3. It consists of fabric cover factor, yarn linear density, yarn hairiness, hairiness variation, immature fiber content, short fiber content, and fiber fineness variables.
FIGURE 3. Artificial neural network model for the prediction of the difference between the total pill count and weighted total pill count values.
The descriptive statistics of the training, testing, and overall data used in the model for the prediction of
TABLE VII. Descriptive statistics for the ANN model of the difference between the total pill count and weighted total pill count.
Pilling grade Training data Testing data Overall data
Mean value (M) 39.31 42.676 40.143
Standard deviation (SD) 30.03 28.83 29.77
Mean error (ME) 0.185 -0.245 0.078
Mean square error (MSE) 179.78 223.63 190.63
Root mean square error (RMSE) 13.41 14.95 13.81
Mean absolute error (MAE) 10.53 11.05 10.66
Correlation coefficient (r2) 0.8948 0.8558 0.8859
Regression coefficient (R2) 0.808 0.7325 0.785
As can be seen from Table VII, the error values of training data are lower compared to those of testing data. However, the regression coefficient of testing data is still within acceptable limits and therefore it can stated that the neural network model for the difference between the total pill count and weighted total pill count values is quite satisfactory.
In order to define the contribution level of each independent variable within the model, a sensitivity analysis was carried out, as given in Table VIII.
TABLE VIII. Sensitivity analysis for ANN model of the difference between the total pill count and weighted total pill count.
Ratio 4.03 2.52 2.4 2.32 1.84 1.56 1.39
Rank 1 2 3 4 5 6 7
Immature fiber content
(IFC)
Yarn linear density (Ne) Fabric cover
factor (C) Fiber fineness
(mtex)
Short fiber content (SFCw)
Yarn hairiness variation (sH)
Yarn hairiness (H)
The greater the sensitivity ratio of the variable, the greater their contribution to the network. So, similar to the other pilling related properties, for the prediction of the difference between the total pill count and weighted total pill count values, the highest contribution belongs to the fabric cover factor. The ratios of fiber fineness, short fiber content, and yarn hairiness variation are close to each other. Yarn hairiness, immature fiber content, and yarn linear density are, respectively, the other important factors affecting the size of pills on the fabric structure.
Modeling of the Mean Pill Area
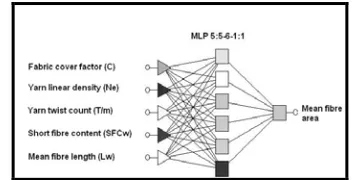
Another pilling related property measured by the PillGrade objective pilling evaluation system is the mean area the pills cover within the scanning area of 25.18 cm2 measured by the instrument. By using the training data consisting of 140 mean values, a neural network was constructed in the form of MLP 5:5-6-1:1. In the input layer, fabric cover factor, yarn linear density, yarn twist count, short fiber content, and mean fiber length variables are included. The hidden layer has six neurons and the output layer contains
one neuron that is the mean pill area. The artificial neural network model for the mean pill area is given in Figure 4.
FIGURE 4. Artificial neural network model for the prediction of the mean pill area.
The descriptive statistics for training, testing, and overall data is given in Table IX. Mean error and mean square error values are relatively low and close to each other for all data sets. Mean absolute error is an indicator of how close the predicted values to the real data are. The regression coefficient of the training data is found to be 74.34% and the value for testing data is 72.94%. Although these values are not high enough for a confident prediction, they can be accepted since there is no previous work on the prediction of mean pill area.
TABLE IX. Descriptive statistics for the ANN model of the mean pill area.
Pilling grade Training data Testing data Overall data
Mean value (M) 1.55 1.52 1.54
Standard deviation (SD) 0.617 0.617 0.617
Mean error (ME) -0.002 -0.007 -0.019
Mean square error (MSE) 0.1 0.11 0.1
Root mean square error (RMSE) 0.31 0.33 0.32
Mean absolute error (MAE) 0.251 0.243 0.249
Correlation coefficient (r2) 0.8622 0.854 0.8586
Regression coefficient (R2) 0.7434 0.7294 0.7371
TABLE X. Sensitivity analysis for ANN model of the mean pill area.
Ratio 2.44 1.76 1.72 1.4 1.34
Rank 1 2 3 4 5
Fabric cover factor
(C)
Yarn linear density
(Ne)
Short fiber content (SFCw)
Mean fiber length (Lw) Yarn twist
count (T/m)
Modeling of Average Pill Height
The PillGrade objective pilling evaluation system measures the pill height, this data can be used for the evaluation of pill structure and size. The most appropriate model is selected by considering the statistical values of training and testing data. The model is in the form of a multi-layer perceptron MLP 5:5-6-1:1. The input layer consists of 5 neurons such including fiber content, fabric cover factor, mean fiber length, yarn twist count, and yarn hairiness variables.
The hidden layer has six neurons and the output layer contains only one neuron that is the pill height. The model for the mean pill height is given in Figure 5.
FIGURE 5. Artificial neural network model for the prediction of the mean pill height.
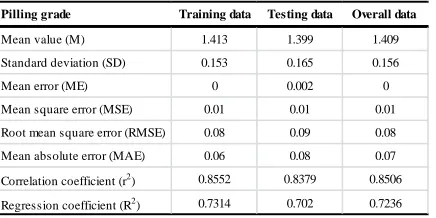
The descriptive statistics of the training, testing, and overall data used in the model for the prediction of mean pill height are given in Table XI.
TABLE XI. Descriptive statistics for the ANN model of the mean pill height.
Pilling grade Training data Testing data Overall data
Mean value (M) 1.413 1.399 1.409
Standard deviation (SD) 0.153 0.165 0.156
Mean error (ME) 0 0.002 0
Mean square error (MSE) 0.01 0.01 0.01
Root mean square error (RMSE) 0.08 0.09 0.08
Mean absolute error (MAE) 0.06 0.08 0.07
Correlation coefficient (r2) 0.8552 0.8379 0.8506
Regression coefficient (R2) 0.7314 0.702 0.7236
When the descriptive statistics values are examined, it can be seen that mean square error values for training, testing, and overall data are 0.01. Mean absolute error, as an indication of the proximity of the predicted values to the real values, points out the fitness of the model with its low values. The correlation and regression coefficients are similar to those of the pill area values.
In order to determine the effect of the variables on the pill height value, the sensitivity analysis was carried out, as given in Table XII.
TABLE XII. Sensitivity analysis for ANN model of the mean pill height.
Ratio 3.34 2.68 1.79 1.756 1.35
Rank 1 2 3 4 5
Yarn hairiness (H) Short fiber
content (SFCw)
Yarn twist count (T/m) Fabric cover
factor (C)
Mean fiber length (Lw)
The most effective parameter on pill height is found to be short fiber content. Fabric cover factor, mean fiber length, yarn twist count, and yarn hairiness are found to be the other significant parameters affecting mean pill height according to the results of the sensitivity analysis.
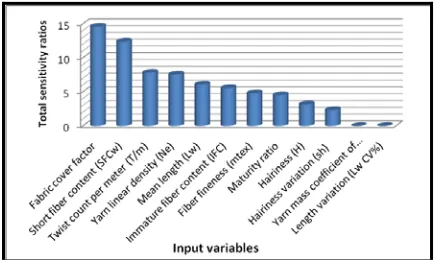
FIGURE 6. Total sensitivity ratios of the input variables.
A high level of fabric cover factor and yarn twist level result in higher pilling resistance of the fabric since the fibers cannot easily be pulled out of the yarn and entangle. The fabrics produced from coarser yarns and therefore have more hairy structure, have higher pilling tendency. As the mean length of the fiber and short fiber content increases, the protruding ends from the body of the yarn increase and longer fibers show greater resistance to migration towards the yarn surface. With the increasing immature fiber content and lower maturity ratio and fiber fineness, the pilling propensity of the fabrics increases. In order to bring a loose fiber end to the fabric surface, it is necessary to slide, bend and twist the fiber around its neighbors against the force of friction, which tends to hold the fiber in place. The breaking strength of the fiber determines the limit of the force that may be applied. The process of entangling fibers to form the pill again involves some of these forces [25]. As the maturity ratio of cotton fibers decrease, the cellulose content of the fiber and consequently the breaking strength of the fibers decrease. Therefore, with the reduced resistance of the fibers against entanglement, the pilling formation increases.
CONCLUSION
As an important and disturbing wearing property, fabric pilling occurrence is affected by many interactive properties and, for manufacturers, is quite important to control the pilling tendency of the fabrics before production.
In this study, it was aimed to predict the fabric pilling propensity using the help of several fiber, yarn, and fabric features. Due to the complex interaction of each feature, an artificial neural network was used since it was a powerful tool to model the multi-linear relationships between the fiber, yarn, and fabric properties and to define their effects on the pilling tendency of fabrics. With the aid of the models, it
was expected to adjust the pilling performance of the fabric by a number of given inputs. Pilling grade, total pill count, the difference between total and weighted pill count, mean pill area, and mean pill height values were the output parameters. All the models had good estimation power even though the dynamic characteristics of pilling formation and therefore the difficulty in determining the prediction models. The models of pilling grade and total pill count were better predictors with a regression coefficient of 82% for testing data.
According to the sensitivity ranking, the most effective property for pilling formation of the interlock knitted fabrics was found to be the fabric cover factor, which agreed with previous studies. All the models included fabric cover factor as an input parameter, therefore, by changing the fabric cover factor, the desired pilling grade could be adjusted to some extent. Among the cotton fiber properties, short fiber content was the dominant feature on pilling tendency compared to the other fiber properties. Short fiber content was also integrated into all the ANN models. Of the yarn features, yarn linear density and yarn twist coefficient were the decisive factors for pilling formation of interlock knitted fabrics.
REFERENCES
[1] Xu B., “Instrumental Evaluation of Fabric Pilling”, Journal of Textile Institute, 88 (4), 1997, pp.488-500.
[2] Rejali M., Hasani H., Ajeli S., Shanbeh M.,”Optimization and prediction of the pilling performance of weft knitted fabrics”,
Indian Journal of Fiber & Textile Research, 39, 2014, pp.83-88.
[3] Hajilari M., Esfandiari A. H., Dabiryan H., Mosavi Pour Gharbi S. H., “Investigation of effect of fibers modulus on pilling of acrylic fabrics”, The Journal of the Textile Institute,
100 (2), 2009, pp.135–140.
[4] Beltran R., Wang L., Wang X, “A Controlled Experiment on Yarn Hairiness and Fabric Pilling”, Textile Research Journal, 2007, 77 (3), pp.179–183.
[5] Mendes A.O, Fiadeiro P.T., Miguel R.A.L., Lucas J.M., “Optical Estimation of a Set of Pilling Coefficients for Textile Fabrics”,
Textile Research Journal, 2009, 79(5), pp. 410–417.
[6] Millian M.S., Abril H.C., “Image analysis of
standard pilling series”, Optical
[7] Jasinska I., Stempie N Z., “An alternative instrumental method for fabric pilling evaluation based on computer image analysis”, Textile Research Journal, 2014, 84(5), pp. 488–499.
[8] Ouyang WB, Wang R., Xu B,
“Fabric pilling measurement using three-dimensional image”, Journal of Electronic Imaging, 2013, 22(4), doi: 10.1117/1.JEI.22.4.043031.
[9] Jing J., Zhang Z., Kang X, Jia j., “Objective evaluation of fabric pilling based on wavelet transform and the local binary pattern”,
Textile Research Journal, 2012,82(18), pp. 1880–1887.
[10] Xu B., Yu W., Wang R,” Stereovision for three-dimensional measurements of fabric pilling”, Textile Research Journal, 2011, 81(20), pp.2168–2179.
[11] Unal P.G., Üreyen M.E., Mecit D., “Predicting Properties of Single Jersey Fabrics Using Regression and Artificial Neural Network Models”, Fibers and Polymers, 2012, 13 (1), pp.87-95.
[12] Tehran M.A., Maleki M., “Artificial Neural Network Prosperities in Textile Applications”, Artificial Neural Networks - Industrial and Control Engineering Applications, ISBN: 978-953-307-220-3, InTech, 2011, pp.35-64.
[13] Krenker A., Bester J., Kos A.,”Introduction to the Artificial Neural Networks”, Artificial
Neural Networks - Methodological
Advances and Biomedical Applications, ISBN: 978- 953-307-243-2, InTech, 2011, pp. 3-18.
[14] Blaga, M., “Soft computing applications in knitting technology”, Woodhead Publishing in Textiles, Edited by: Majumdar A., Issue: 111, 2012, pp. 217-245.
[15] Beltran R., Wang L., Wang X., “Predicting the Pilling Propensity of Fabrics through Artificial Neural Network Modeling”,
Textile Research Journal, 75(7), 2005, pp.557–561.
[16] Beltran R., Wang L., Wang X., “Predicting the pilling tendency of wool knits”, Journal of Textile Institute, 2006, 97 (2), pp.129-136. [17] Beltran R., Wang L., Wang X., “Measuring
the influence of fiber-to-fabric properties on the pilling of wool fabrics”, Journal of Textile Institute, 2006, 97 (3), pp.197-204.
[18] Uçar N., Ertuğrul S., “Prediction of Fuzz Fibers on Fabric Surface by Using Neural Network and Regression Analysis”, Fibers and Textile in Eastern Europe, 15(2), 2007, pp.58-61.
[19] Yun S.Y., Kim S., Park C.K., “Development of an Objective Fabric Pilling Evaluation Method.II.Fabric Pilling Grading Using Artificial Neural Network”, Fibers and Polymers, 2013, 14 (12), pp. 2157-2162.
[20] Yap P.H., Wang X., Wang L, Ong K.L.,
“Prediction of Wool Knitwear Pilling Propensity using Support Vector Machines”,
Textile Research Journal, 2009, 80(1), pp. 77–83.
[21] Busilienė G. Lekeckas K., Urbelis V., “Pilling Resistance of Knitted Fabrics”, Materıals
Science, 2011, 17(3), pp.297-301.
[22] Özçelik Kayseri G., Kırtay E., “Part 1: Part 1. Predicting the Pilling Tendency of the Cotton Interlock Knitted Fabrics by Regression Analysis”, Journal of Engineered Fibers and Fabrics, 2015, Vol.10, Issue 3, pp.110-120.
[23] EN ISO 2061: Determination of twist in yarns-Direct counting method.
[24] EN ISO 12945-2 Determination of fabric propensity to surface fuzzing and to pilling - Part 2: Modified Martindale method.
[25] Ukponmwan J.O, Mukhopadhyay A.,
Chatterjee K.N., “Pilling”, Textile Progress, 1998, 28(3), pp. 1-58.
AUTHORS’ ADDRESSES Gonca Özçelik Kayseri Erhan Kirtay
Ege University Textile and Apparel Research and Application Center İzmir, Turkey 35100