Published online March 20, 2014 (http://www.sciencepublishinggroup.com/j/ijepe) doi: 10.11648/j.ijepe.20140302.13
Speed estimation of three phase induction motor using
artificial neural network
Moinak Pyne
1, Abhishek Chatterjee
1, Sibamay Dasgupta
21
Department of Electrical Engineering, M.C.E.T., West Bengal University of Technology, Kolkata, India
2
BIEMS, West Bengal University of Technology, Kolkata, India
Email address:
[email protected] (M. Pyne), [email protected] (A. Chatterjee), [email protected] (S. Dasgupta)
To cite this article:
Moinak Pyne, Abhishek Chatterjee, Sibamay Dasgupta. Speed Estimation of Three Phase Induction Motor Using Artificial Neural Network. International Journal of Energy and Power Engineering. Vol. 3, No. 2, 2014, pp. 52-56.
doi: 10.11648/j.ijepe.20140302.13
Abstract:
Three phase induction motors being the most widely used motor for domestic, commercial and industrial applications, demands a more detailed understanding and improved analysis of its performance characteristics. The conventional method of using the equivalent circuit for assessing the motor performance cannot incorporate the non-linearities involved in the speed torque characteristics into the performance of the motor to the fullest extent. This paper presents an ANN based modeling of three phase induction motor to overcome this problem. The model has been tested and validated with actual experimental data. The performance of the model has been compared with that of a classical equivalent circuit technique both graphically and statistically and found to be superior. The model can thus offer a better method of speed estimation and control of the induction motor for input voltage variation with and without input frequency change.Keywords:
Artificial Neural Networks, Three Phase Induction Motor1. Introduction
Three phase induction motors find widespread application in domestic, commercial and industrial situations. Most of the applications demand control of speed. Thus modelling of induction motor is necessary to analyze and predict performance of the induction motor with respect to speed and torque. The classical equivalent circuit serves this purpose to a great extent. This method requires precise knowledge of motor parameters [1]. However the non-linearity involved in the input-output relationship of the motor is not completely tackled by this circuit model.
The speed of the induction motor can be changed by varying the magnitude of the supplied voltage and also the frequency of the supplied voltage. Varying the magnitude of supplied voltage gives speed control only in a small range [2]. This is due to the highly non-linear relationship between input voltage and the speed.
Changing the input frequency gives better change of speed. If frequency is reduced with the input voltage remaining nominal, the flux in the motor rises and may go to saturation under very low frequency, so input voltage is also varied keeping the ratio V/f constant in order to keep the flux within limit. These methods are scalar control.
Recently, several methods for estimating speed from TRIM have been investigated [3-8]. In [3] a neural network based speed filter is proposed for speed estimation. It uses as input actual machine currents and voltages along with motor nameplate information.
To have a better control of magnetic flux, current control is utilized in these methods [2]. Although, these scalar control methods suffer from poor dynamic behavior of the drive, V/f control out of these is widely used as it is simple and cheaper.
To overcome the problem of Scalar control methods in terms of dynamic behavior, Vector control methods are introduced. Vector control methods such as field oriented control, direct torque control and direct self-control work with vectors [2].
Field oriented control works with rotating vectors or phasors in coordinate system. It establishes two independent and single controlled currents; flux producing currents and torque producing currents. Flux and torque can be independently controlled [2]. This is a complex and costly technique although it gives better control of drives with dynamic behavior.
International Journal of Energy and Power Engineering 2014, 3(2): 52-56 53
conventional scalar control depends on the equivalent circuit for relation between voltage with slip and frequency and also with slip and torque, it is proposed that an Artificial Neural Network model will perform better for these relationships in place of equivalent circuit and give more satisfactory results.
Recently, several methods using neural networks for scalar control in problems involving induction motors have provided efficient results, particularly in the field of estimation [3-6]. In [3] a neural network based speed filter is proposed for speed estimation. It uses as input actual machine currents and voltages along with motor nameplate information.
In [4], the Extended Kalman Filter is used to estimate the speed by first estimating the rotor and stator resistance using the same filter.
A TPIM speed estimator based on Multilayer Perception Network (MLP) is presented in [5]. The neural speeds are acquired with the machine operating at 500 to 1000 revolutions per minute speed.
In [6], a neural network model is proposed which estimates the speed of an induction motor fed from a voltage source inverter.
In this paper, a neural network based model is developed which simplifies the prediction of revolution speed of motors by eliminating the need of estimating the motor parameters. It takes the sinusoidal input supply voltage only and estimates the revolution speed for a 25% loading. The training and validation data are actual voltage and rpm’s that were obtained from the experimental setup described in section 2.1. The results obtained from the ann model were compared graphically as well as statistically with the results obtained from equivalent circuit calculations.
2. Methodology
This study was carried out in four steps; the first step was to obtain the actual revolution speeds of a three phase induction motor against variation of input voltage. The data obtained were used for training and validation of the ANN model that was developed in the third step. The results were also used for the final graphical and statististical comparison of the two methods of obtaining revolution speeds, i.e., classical method (using equivalent circuit) and ANN based modeling method.
In the second step, the classical approach to estimation of motor rpm was applied for the same motor parameters as were present in the actual motor used in the experimental setup in step one. An equivalent circuit based calculation was carried out to obtain the rpms of the motor.
In the third step an artificial neural network based model was developed which was trained and validated using the data obtained from step one.
Finally, a graphical as well as statistical comparison was carried out between the two methods of estimating revolution speeds and that obtained from the actual motor data obtained in step one.
2.1. Experimental Observation
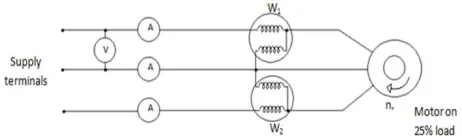
The experimental setup was done according to Fig. 1, where a three phase squirrel cage induction motor TPIM was connected to the three phase supply though a variac which controls the supply voltage VS. The voltmeter ‘V’, the
ammeters ‘A’ and the wattmeters ‘W1’ and ‘W2’ were
connected as shown in the Fig. 1.In this set up, three phase two wattmeter method has been used. The motor was set up with 25% loading of its rated capacity and this has been maintained constant throughout the experimental process, and thus the results obtained from the classical method and also the ANN based modeling, represent the performance of the motor with 25% loading.
Figure 1. Connection Diagram for Conducting r.p.m. Variation Test at 25% Loading.
For the purpose of recording the r.p.m. of the motor at various voltages, the supply voltage was increased in small steps with the help of the variac and the motor r.p.m. at each of these steps was recorded with the help of a tachometer. The voltage was increased up to rated voltage of the motor. During each step the wattmeter and also the ammeter readings were recorded. The wattmeter readings were summed up and used as input for the Classical Method of r.p.m. calculation, which is described later on.
From the complete set of readings, twenty sets of reading were kept aside for comparison purposes and from the remaining readings, voltage-r.p.m. pairs were used for training purposes of the ANN Based Model, which is also described later on.
2.2. Classical Method
of the induction motor may be followed. The circuit diagram is shown in Fig. 2. After finding out the required values of the parameters, the slip was calculated as per the equation 1.
Figure 2. Per Phase Equivalent Circuit Representation for Self Induction Generator.
In Equation 1, input power P has been provided from the practical readings that have been taken in from the motor itself. The input voltage VS has been provided
corresponding to which the input power reading has been taken. R1, R2, X1 and X2 has been provided from the
calculations which were done from the results of the No load and Blocked Rotor test.
By using the above values the slip s was fou
hence the rotor speed n was calculated according to equation 2.
2.3. ANN Based Modeling
In this paper, the multilayer back propagation feed forward neural network has been used to develop a model that provides good estimation of rev
characteristics [8]. The mathematical structure of used in this paper has been shown in Fig.3.
In Fig. 4, the ANN model used is shown.
VS is used as input and nr is used as output for training
purpose. These input and output readings have been provided from the practical readings that were taken from the TPIM. The network is set with ‘tansig’ transfer function at the middle layer also ‘tansig’ transfer function at output layer. The design of the network and selection of
Table 1.
Sl. No. Supply Voltage VS (V)
Calculated n Method)
1 19 0
2 31 0
3 42 0
4 54 0
5 66 0
6 77 0
7 92 0
8 117 0
9 141 1394.9
10 152 1393.45
11 163 1402.15
12 177 1415.3
be followed. The circuit diagram is shown in Fig. 2. After finding out the required values of the parameters, the slip was calculated as per the
Per Phase Equivalent Circuit Representation for Self-Excited
(1)
(2)
In Equation 1, input power P has been provided from the practical readings that have been taken in from the motor has been provided corresponding to which the input power reading has been has been provided from the calculations which were done from the results of the No
By using the above values the slip s was found out, and hence the rotor speed n was calculated according to
In this paper, the multilayer back propagation feed forward neural network has been used to develop a model that provides good estimation of revolution speed structure of the ANN used in this paper has been shown in Fig.3.
In Fig. 4, the ANN model used is shown. In this network is used as output for training purpose. These input and output readings have been provided from the practical readings that were taken from the TPIM. The network is set with ‘tansig’ transfer function at the middle layer also ‘tansig’ transfer function at the output layer. The design of the network and selection of
optimum training parameters are performed by trial and error. Furthermore, Levenberg
is used which causes fewer epochs as compared to other training functions. Also, the performance function used is mean squared error. Therefore when an input is applied in the network, it will begin training based on the given data in order to produce the approximate results. This type of training has been found to be very effective fo
actual non-linear rotation speed characteristics of induction machine.
Figure 3. Mathematical Model
Figure 4. Structure of Artificial Neural Network
After training the network, the network is given as VS readings which were not provided in the training set and
hence an output set of nr was obtained.
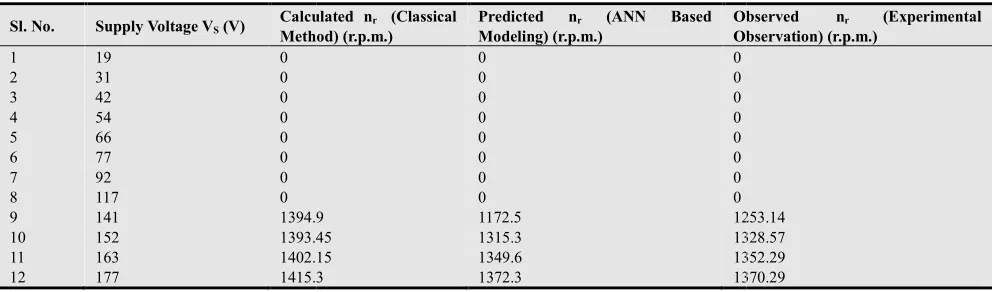
3. Experimental Data
The set of twenty VS-nr readings which were kept aside for
comparison purposes is shown in Table 1 along with the calculated nr from the classical method and the predicted n
from the ANN based modeling.
Table 1. Comparison of Experimental, Calculated and Predicted nr.
Calculated nr (Classical
thod) (r.p.m.)
Predicted nr (ANN Based
Modeling) (r.p.m.)
Observed n Observation) (r.p.m.)
0 0
0 0
0 0
0 0
0 0
0 0
0 0
0 0
1394.9 1172.5 1253.14
1393.45 1315.3 1328.57
1402.15 1349.6 1352.29
1415.3 1372.3 1370.29
optimum training parameters are performed by trial and error. Furthermore, Levenberg-Marquardt training function is used which causes fewer epochs as compared to other the performance function used is mean squared error. Therefore when an input is applied in the network, it will begin training based on the given data in order to produce the approximate results. This type of training has been found to be very effective for capturing the linear rotation speed characteristics of induction
Mathematical Model of Artificial Neural Network.
Structure of Artificial Neural Network.
After training the network, the network is given as input readings which were not provided in the training set and
was obtained.
. Experimental Data
readings which were kept aside for comparison purposes is shown in Table 1 along with the rom the classical method and the predicted nr
from the ANN based modeling.
Observed nr (Experimental
Observation) (r.p.m.)
International Journal of Energy and Power Engineering 2014, 3(2): 52-56 55
Sl. No. Supply Voltage VS (V)
Calculated nr (Classical
Method) (r.p.m.)
Predicted nr (ANN Based
Modeling) (r.p.m.)
Observed nr (Experimental
Observation) (r.p.m.)
13 193 1418.1 1384.6 1378
14 210 1423.9 1390.9 1392.71
15 229 1428.25 1396.7 1397.71
16 251 1431.15 1408.2 1404
17 329 1441.155 1422.2 1423.43
18 354 1440.865 1430.5 1430.86
19 385 1440.14 1435 1434
20 407 1439.85 1435 1439
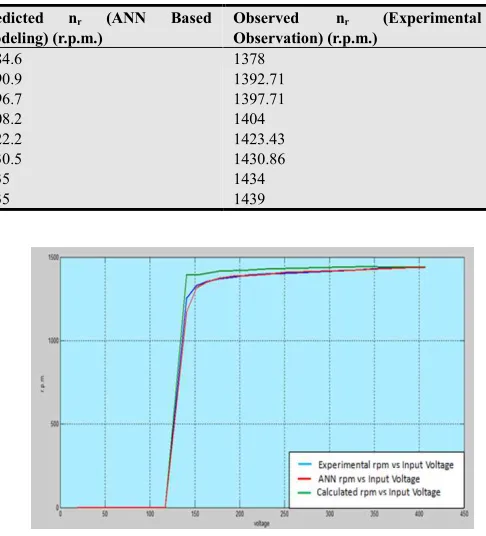
4. Analysis
The speed has been measured experimentally for different input voltages. The speed has been calculated from conventional equivalent circuit of the Induction motor used for the same input voltages. The speed has been estimated from ANN model of the same Induction motor for the same input voltages. Fig. 5 shows the graphical comparison of the experimental nr, calculated nr and predicted nr for the TPIM
placed under 25% loading.
It can be observed visibly that the red-curve which represents the predicted nr by the ANN based modeling is
much closer to the blue-curve which represents the experimentally observed nr of the TPIM than the
green-curve that represents the calculated nr from the
classical method.
Figure 5. Comparison of Experimental nr, Calculated nr and Predicted nr.
This visible closeness is further strengthened by the statistical observation as presented in table 2.
Table 2. Statistically Observed Comparison.
Methodology Mean Standard Deviation Variance
Observed nr (Experimental Observation) 830.2 675.313 456047.546
Calculated nr (Classical Method) 853.465 696.977 485777.241
Predicted nr (ANN Based Model) 825.64 676.34 457436.039
From Table 2 it can be observed that firstly, in terms of mean, the value of predicted nr is much closer to that of
observed nr than the calculated nr. This is similarly displayed
in terms of standard deviation as well as variance where the values of predicted nr are much closer to that of experimental
nr than that of the calculated nr.
5. Conclusion
In this paper an attempt has been made to develop an ANN model of three phase induction motor for the estimation of speed from input voltage. Estimation of speed with input voltage was also made with the help of equivalent circuit. Both these estimations were then compared with the experimental data. The comparison revealed that the ANN model based speed was much closer to the experimental data curve than the calculated speed from the equivalent circuit. The estimation of closeness was also tested statistically, and the same closeness was observed in terms of mean, standard deviation and variance. This further indicates a possibility that if the ANN model is developed with both input voltage and frequency as input, this will equally predict speed much better way than the classical equivalent circuit. Results also indicate that ANN
model can better address the issue of non-linearities involved in the induction motor, than the equivalent circuit. Thus it can be concluded that in case of scalar control of speed like V/f technique, the ANN model can be used instead of transfer functions based on equivalent circuit to give better result. The whole ANN model can be implemented in DSP chip based circuitry in hardware [10] economically.
References
[1] Vasic, Veran, Slobodan N. Vukosavic and Emil Levi., “A stator resistance estimation scheme for speed sensorless rotor flux oriented induction motor drives”, IEEE transactions on Energy Conversion, on 18, no. 4 pp. 476-483, (2003).
[2] Kohlsnez G. & Fodor D., “Comparison of scalar and vector control strategies of Induction Motor”, Hungarian J. Industrial Chemistry, Veszprem, vol. 9 (2) pp. 265-270 (2011).
[4] Geetha, E. K., T. Thyagarajan, and Vedam Subramanyam, “Robust speed sensorless induction motor drives.” In Power Electronics, 2007, ICPE’07, 7th International Conference on Power Electronics, pp. 806-810. IEEE, 2007.
[5] O. Yuksel, D. Mehmet, “Speed estimation of vector controlled squirrel cage asynchronous motor with artificial neural network.” Elsevier Energy Conversion and Management, vol. 52, pp. 675-686, 2009.
[6] dos Santos, T. H., A. Goedtel, S.A. O. da Silva, and M. Suetake, “A neural speed estimator in Three-Phase Induction Motors powered by a driver with scalar control.” In Power
Electronics Conference (COBEP), 2011 Brazilian, pp. 44-49. IEEE, 2011.
[7] S.J. Chapman, Electric Machines Fundamentals, McGrow-Hill (1998) pp. 430-436.
[8] Neural Network Toolbox TM User Guide, www.mathworks.in/help/pdf_doc/nnet/nnet_ug.pdf
[9] B.S. Grewal, Higher Engineering Mathematics, Khanna Publishers, 40th Edition.