1. Introduction
Market segmentation is an approach aiming at grouping similar customers in order to better understand and approach them [28]. Market segmentation has consequently been regarded as one of the most critical elements in achieving successful modern marketing and Customer Relationship Management (CRM) [4] and it can be described as the process of partitioning a large market into smaller groups or clusters [11, 20, 27, 30, 34]. The similarities within each segment indicate a similar purchasing behavior. Many organizations believe in the ability of segmentation in achieving competitive advantages and enhancing business performance [17, 6]. Therefore, many times there is very important to create individual segments of services for separate segments of market, usually by the way of different marketing, prices and rewards [25].
Corresponding author
E-mail: [email protected] DOI:10.22105/jarie.2017.91297.1011
The New Approach in Market Segmentation by Using RFM
Model
Hadi Roshan
1, Masoumeh Afsharinezhad
21Department of Computer Engineering, University of East of Guilan, Iran. 2Department of Management, University of Payame noor, Iran.
A B S T R A C T P A P E R I N F O
Data analytics allows companies mining the patterns and trends in their customers’ data to implement more effective market segmentation strategies, then customize promotional offers, allocate marketing resources efficiently, and improve Customer Relationship Management (CRM). However, the implementation of such strategies often hampered by limited budgets and the ever-changing priorities and goals of marketing campaigns. So, this paper suggests and demonstrates the novel approach dividing a broad target market into subsets of consumers who have common needs, interests, and priorities, and then designing and implementing strategies to target them to achieve profit maximization. Therefore, the aims of this study are twofold; First, is to use historical data (such as purchased items and the associative monetary expenses), the proposed model identifies customer segments based on Firefly Algorithm (FA), and Second, is the identification of the most profitable segment according to the RFM model (recency, frequency and monetary). The data were obtained from the sales department of one of the branch stores in northern region of Iran. There were 3836 transactions generated jointly by 211 customers in a transaction database containing 30 items. Findings revealed that there are three optimize clusters for this store and cluster number 3 is the most profitable.
Chronicle:
Received: 05 July 2017 Accepted:28 November 2017
Keywords :
Segmentation. Profitably. Fire Fly Algorithm. RFM model.
Journal of Applied Research on Industrial
Engineering
From the modern management perspective, maximizing customer value is the key to surviving fierce competition in the business world [7]. When the industry becomes more competitive, it is important for a company to identify and retain high value and important potential customers [8, 9, 26], and an increased value for a customer consists of maximization of the ratio between what the customer gets and what effort he/she has to make to get it [21]. Chiliya and colleagues [9] also stated that the concept of customer relationship management is to acquire and retain most profitable customers by understanding their values. Moreover, differentiating more profitable customers from less profitable customers and focusing on lifelong, rather than short-term, customer relationships are key business strategies for survival in today’s competitive marketplace [7]. Therefore, market segmentation is a positive clue for both consumers and marketers [29].
2. The Importance of CRM and Market Segmentation
The importance of CRM in maximizing the expected total profit gained throughout the lifetime of individual customers has been studied extensively in the marketing literature [18]. CRM associated processes require of the development of change practices since it is the consumer the person who has the main voice and the managers and employees must adapt the customer perspectives to improve their processes [23]. Therefore, it can be said that the firms that implement CRM systems put into practice a business strategy focused in the customer from the functional and technique perspectives by making use of technological tools and preparing human beings to prioritize customer’s expectations. In this regard, segmentation of potentially profitable customers, whom we call good customers, becomes significantly important. Through ranking tools such as RFM, CLV and SOW measures, customers are classified based on their past purchase behaviors [5, 12]. The target set consisting of potentially good customers is then identified to whom concentrated promotional efforts may be applied so as to keep such customers loyal and increase the profit.
RFM model has been widely applied in many practical areas in along history, particularly in direct marketing [3]. By adopting RFM model, decision makers can effectivelyidentify valuable customers and then develop effective marketing strategy. At first, this paper aims to classify customers based on their purchasing variables. Therefore, this paper developed a novel market segmentation methodology based on product specific variables, such as items purchased and the associative monetary expenses from transactional history of customers. This identifies groups of customers with similar purchasing behaviors and more homogeneous response to marketing programs and firefly algorithm (FA), which is developed in this methodology to increases the clustering quality. Since the main purpose of this article is determining the most profitable cluster, the RFM model adopted to implement it.
2.1. Preliminaries for Market Segmentation
2.1.1. Data preparation
The purpose of data preparation is to integrate, select, and transform the data from one or more databases into the data required for the suggested methodology. The customer observing is to purchase behavior, retrieve his/her purchased items and their expenses over a period is needed [32]. Therefore, an aggregated record that describes the purchase behavior of a customer by Ci can be represented as tic= ( idi, Itemset
2.1.2 The Purchase-based Similarity Measure
The importance of every customer is different based on the portion he/she has in the profit of company. Therefore, it is necessary to consider profitability of each customer while evaluating the amount of similarities in their buying behavior. The similarity measure considers the co-purchase association between two items and the profitability of each customer. Similarity measure is defined as:
Sim(Ci, Cj)
=|supp(Cj) − supp(Ci) × supp(Ci)| + |supp(Cj) − supp(Ci) × supp(Cj)|
supp(Ci) + supp(Cj)
(1)
𝑆𝑢𝑝𝑝({𝑖𝑖, 𝑖𝑗}) =
‖{𝑡° ∈ 𝑇°|𝑡°𝑐𝑜𝑛𝑡𝑎𝑖𝑛𝑠{𝑖𝑖, 𝑖𝑗}‖
‖𝑇°‖ ,
(2) where 𝐼𝑖, 𝐼𝑗 𝜖 𝐼.
2.1.3 Maximum Similarity Measure
Let G = {Cn|n = 1, … , k}be the set of K cluster centers and Cn be the cluster center of the nth cluster Gn where Cn∈ Tc.Therefore, (Tc− G) = {C
i|i = 1, … , ‖Tc− G‖}is the set of remaining customers
that were not selected as cluster centers, which ci
∈
Tcand ci ∉ G. The similarities between all cluster centers Cnand a remaining customer ci are evaluated using Sim(cn, ci)of Eq. (2), and customer ci willbe assigned to the nth cluster Gn if the similarity between ci and Cn is maximum. This can be expressed
as:
max
1≤n≤k{Sim(c n, c
i)}where ci∈ (Tc− G) (3)
2.1.4. Priority Measure (PIO)
When each remaining customer is assigned to a proper cluster, the next step is to recalculate the new cluster center for each cluster. So, a customer is assigned to a new cluster center if the sum of the similarities between that customer and the other customers in the same cluster is maximum and the sum of the similarities between them is minimum. Suppose that Ci and Cj are two customers in cluster Gn, and the cluster center in Gn is Cn, the priority of customerCi can be defined as
Pio(ci) = ∑ Sim(ci, cj)/
ci,cj∈cli
∑ Sim(cli, clj), cli≠clj
(4)
where cli is the center of cluster Gm, ∑ci,cj∈cliSim(ci, cj)represents the sum of the similarities between
Ci and other customers in the same cluster Gn, and ∑cli≠cljSim(cli, clj)represents the sum of the
similarities between Ciand other cluster centers except for Gn.
2.2. The Survey of Clustering Quality Function Using Firefly Algorithm (FA)
Firefly algorithm is based on two important things, first is the variation in light intensity and second is formulation of attractiveness [1]. At particular location x, the brightness I of a firefly can be chosen
as I(x)∝ f(x) for a maximization problem. The attractiveness β is relative, which means it should be
I = Ioe−yr, (5)
where Io is the initial light intensity. Firefly’s attractiveness β is proportional to the light intensity seen by adjacent fireflies, which can be defined as
β = βoe−yr
2
, (6)
where βois the attractiveness at r = 0. The distance between any two fireflies is calculated using Cartesian distance method.
rij= ||Xi− Xj|| = √∑nk=1(Xi,k− Xj,k)2,
(7) where Xi,k is the kth component of spatial coordinate Xi of ith firefly. Firefly i is attracted to brighter firefly j and its movement is determined by
Xi= Xi+ βoe−yrij2(X
i− Xj) + αεi (8)
Second component is used for the attraction and Third component is used for randomization with α being the randomization parameter, and €i is a vector of random numbers being drawn from a Gaussian distribution or uniform distribution [32].
3. RFM Model Analysis
RFM is very valuable in predicting response and can boost a company’s profits in a short term [2], and it is a long-familiar method to measure the strength of customer relationship as RFM can effectively identify valuable customers [33]. In this model, recency measures the interval between the most recent transaction time and the analyzing time. Frequency measures the purchase frequency within a specified period. Monetary measures the total monetary expenditure within a specified period.
This section introduces a designated RFM model to analyze the relative profitability for each customer cluster from the segmentation result after purchase-based segmentation algorithm. With this model, an enterprise can quickly find the target clusters and adjust its marketing programs and business initiatives to provide the right products, services, and resources to the target clusters. Since the RFM model measures the customer value based on Recency (R), Frequency (F), and Monetary (M) criteria, the value of a customer Ci can be represented as:
𝑉(𝑐𝑖) = 𝑊𝑅× 𝑅(𝑐
𝑖) + 𝑊𝐹× 𝐹(𝑐𝑖) + 𝑊𝑀× 𝑀(𝑐𝑖), (9)
where R(ci), F(ci) and M(ci) represent the scores for customer Ci in terms of the R, F and M criteria,
respectively. WR, Wfand Wm represent the importance weights for the R, F and M criteria, respectively. In addition, WR+ WF+ WM= 1. The scores can vary depending on the types of applications and scoring approaches [16]. The scores retrieved from the original transaction database are treated with z-score normalization before calculating the value of a customer. After the profitability for all clusters is known, the clusters are ranked and the most important one is identified. This is helpful for a company to offer customized products and services to target specific customer clusters.
4. Case Study
5. Results
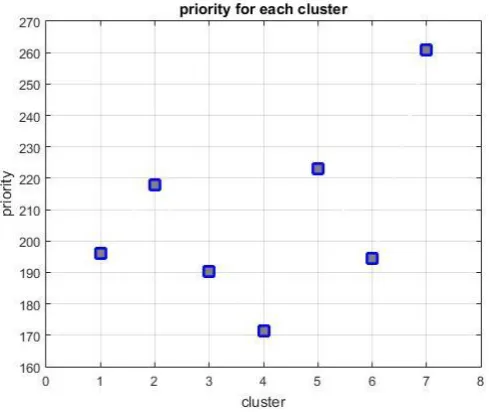
According to Eq. (1) and Eq. (2), clustering is done based on the amount of similarity between each customer. For simplicity, customer numbers are arranged in ascending order. Then, for every cluster the amount of priority is calculated based on Eq. (4), As is shown in Fig 1, the amount of priority measure is between 171.4139 and 260.8189.
Fig 1. Priority for each customer.
After customer segmentation, firefly algorithm would be executed. Determining the best cluster center is done by firefly algorithm. First, the best priorities are selected by this algorithm, then the level of attractiveness of each of them is being determined. At least, according to FA results, customers are classified in three distinct clusters. The table below shows three clusters center.
Table 1. The centers obtained from implementation of FA.
Cluster 3 Cluster 2
Cluster1 Clusters' center
220.444 192.4348
171.4139
Therefore, according to Table 1, the best cluster centers are 171.4139, 192.4348 and 220.4449 for this store. Therefore, customers are located in three distinct clusters, and in each cluster, there are customers with similar needs, characteristics and purchasing behaviors.
The next step is analyzing the relative profitability of each customer cluster. The weights for the R, F, M criteria were set as WR=0.2, WF =0.4 and WM= 0.4 in this case and determining the most profitable cluster is done by equations that explained in the literature review. The RFM profitability analysis result is summarized in Table 2.
Table 2. The amount of clusters’ profitability. Rank Cluster number Frequency % Profitably
1 Cluster 3 80 80% 7960.6
2 Cluster 2 12 12% 1001.2
According to this table, eighty percent of customers are located in cluster 3 and the amount of profitably is equal 7960.6. Therefore, the cluster 3 is the best cluster for this store and it has the main role in maximizing the benefit. Marketers should pay more attention tointerest of these customers
.
6. Discussion
The segmentation of customers is crucial for an organization wishing to develop appropriate promotion strategies for different clusters. Clustering customers provides an in-depth understanding of their behavior. However, previous studies have paid little attention to the similarity of different items in transaction. Lack of categories and concept levels of items that is resulted from item-based segmentation methods are not as good as expected. Hsu and Colleagues [15] employed a concept hierarchy of items. Their study proposed a segmentation methodology to identify similarities between customers. In addition, [28] in their paper studied the problem of updating and improving an existing clustering model by adding relevant new variables. For this purpose, a general framework is proposed, and subsequently applied in a real business context involving an event organizer facing this problem. Yang and Colleagues [36] in their study segmented customers by using fuzzy clustering technique. Liu and Ong [22] adopted Genetics Algorithm(GA) to select related variables and determine the optimal numbers of clusters
.
Their findings revealed that variable selection through GA can effectively find the global optimum solution, and the accuracy of the classified model is dramatically increased after clustering. In addition, McLoughlin and Colleagues [24] applied clustering methods in the electricity industry. This research investigated three of the most widely used unsupervised clustering methods: k-means, k-medoid, and Self Organizing Maps (SOM). The best performing technique is then evaluated in order to segment individual households into clusters based on their pattern of electricity use across the day. Their results showed that households and the manner with which they use electricity in the home can be characterized based on individual customer attributes.On the other hand, Kohvi and [19] proposed an interactive visualization of RFM that helps marketers visualize and quickly identify important customer segments. They depicted these RFM visualizations on two large real-world data sets and discuss how customers have used these visualizations in practice to glean interesting insights from their data. In addition, Farsi and colleagues [13] separated customers, by means of customers' lifetime value (CLV), based on their long-term profitability and then located them in the separate sections. At least, in this paper they proposed how to adopt appropriate strategy for each of these clusters. Hong [14] compared the results of the proposed Self-Organizing Map (SOM) for application to a real-world case of tea-beverage market segmentation. The results showed that the proposed Taguchi method might improve segmentation performance. Chiu et al. [10] in their research proposed the immunity-based ant-clustering algorithm, which integrates two search algorithms, the ant algorithm, and the artificial immune system. The results revealed that this method has the best clustering performance. Therefore, the necessity of market segmentation for selecting the appropriate strategies in customer relationship would be appeared by studying the researches done in this issue.
7. Conclusions
whole market into several meaningful segments. It is a clear that different people have different needs. In order to meet these various needs, the market has to be divided into smaller segments in order for the marketers to have the ability to plan good marketing and positioning of its product. This paper has tried to develop a novel proposed approach and calculate number of optimized clusters. Due to the firefly algorithm ability and power to find answer and optimal solution quickly, this algorithm is adopted to find the best clusters centers. The findings revealed that the best number of clusters for this store is three clusters and the best cluster centers are 171.4139, 192.4348 and 220.444. After clustering, RFM model is used to demonstrate the most profitable cluster. According to the Table 2, eighty percent of customers are located in Cluster 3 and the amount of profitability for this cluster is equal 7960.6. Therefore, the customers that located in Cluster 3 have the main roles in maximizing the benefit for this store. As a result, this store should apply the appropriate actions for allocating the resources and costs in the direction of their customers’ benefits and desires. To do this, stores should understand customers' needs correctly and try to satisfy them.
8. Limitation and Future Research
This study and its results have several limitations and indicate directions for future research.First, the sample size is relatively small. The study can be strengthened by increasing the sample size and including more participants. Second, the findings of this study are limited to the stated store; it is difficult to generalize the results of the research model to other stores and that should be done with the study and implementation of organizational conditions of other stores. In addition, any comprehensive research, due to some procedural and substantive limitations cannot cover all aspects. Therefore, the third limitation of this study is the applying some of the effective variables on market segmentation.
Thus, it is recommended to marketers perform market segmentation based on combination of variables of this study and other variables, such as customer operational characteristics, situational factors, personality characteristics and so on. With regard to the important role of segmentation in increasing the income level of stores and to reduce the costs of consumers’ segmentation and implementing different marketing strategies, using correct market segmentation methods and appropriate selection of segmentation variables is suggested. On the other hand, the review on RFM model is essential and can provide fruitful insight to researchers and decision makers.In fact,RFM model has been proven to be very successful in a variety of practical areas and can help identify valuable customers and develop effective marketing strategy for not only profit organizations (such as marketing industry, banking and insurance industries, telecommunication industry, travelling industry and on-line industry), but also non-profit organizations and government agencies. Through the review of the application of RFM model, decision makers would gain insights on RFM and would be able to apply RFM more effectively to resolve the possible problems encountered in daily activities and develop effective strategy to satisfy a wide variety of customer needs.
Reference
[1] Apostolopoulos, T., & Vlachos, A. (2010). Application of the firefly algorithm for solving the economic emissions load dispatch problem. International journal of combinatorics.
http://dx.doi.org/10.1155/2011/523806
[2] Baecke, P., & Van den Poel, D. (2011). Data augmentation by predicting spending pleasure using commercially available external data. Journal of intelligent information systems, 36(3), 367-383. [3] Baier, M., Ruf, K. M., & Chakraborty, G. (2002). Contemporary database marketing: concepts and
[4] Alex, B., Stephen, S., & Kurt, T. (2000). Building data mining applications for CRM. New York (etc.): McGraw-Hill.
[5] Blattberg, R. C., Getz, G., & Thomas, J. S. (2001). Customer equity: Building and managing relationships as valuable assets. Harvard Business Press.
[6] Malhotra, N. K., Birks, D. F., Palmer, A., & Koenig-Lewis, N. (2003). Market research: an applied approach. Journal of marketing management, 27, 1208-1213.
[7] Chan, S. L., & Ip, W. H. (2011). A dynamic decision support system to predict the value of customer for new product development. Decision support systems, 52(1), 178-188.
[8] Chang, E. C., Huang, S. C., Wu, H. H., & Lo, C. F. (2007, December). A case study of applying spectral clustering technique in the value analysis of an outfitter’s customer database. Proceedings of international conference onindustrial engineering and engineering management. 1743-1746. IEEE. [9] Chiliya, N., Herbst, G., & Roberts-Lombard, M. (2009). The impact of marketing strategies on
profitability of small grocery shops in South African townships. African journal of business management, 3(3), 70.
[10] Chiu, C. Y., Chen, Y. F., Kuo, I. T., & Ku, H. C. (2009). An intelligent market segmentation system using k-means and particle swarm optimization. Expert systems with applications, 36(3), 4558-4565. [11] Croft, M. J. (1994). Market segmentation: A step-by-step guide to profitable new business. Cengage
Learning Emea.
[12] Fader, P. S., Hardie, B. G., & Lee, K. L. (2005). RFM and CLV: Using iso-value curves for customer base analysis. Journal of marketing research, 42(4), 415-430.
[13] Farsi,D., Fatahi, N., & Kosha, H. (2008). Market segmentation based on customers lifetime value (CLV). Proceedings of 6th international conference on engineering. Tehran, Iran.
[14] Hong, C. W. (2012). Using the Taguchi method for effective market segmentation. Expert systems with applications, 39(5), 5451-5459.
[15] Hsu, F. M., Lu, L. P., & Lin, C. M. (2012). Segmenting customers by transaction data with concept hierarchy. Expert systems with applications, 39(6), 6221-6228.
[16] Hughes, A. M. (2005). Strategic database marketing. McGraw-Hill Pub. Co..
[17] Joh, C. H., Timmermans, H. J., & Popkowski-Leszczyc, P. T. (2003). Identifying purchase-history sensitive shopper segments using scanner panel data and sequence alignment methods. Journal of retailing and consumer services, 10(3), 135-144.
[18] Kamakura, W., Mela, C. F., Ansari, A., Bodapati, A., Fader, P., Iyengar, R., ... & Wedel, M. (2005). Choice models and customer relationship management. Marketing letters, 16(3), 279-291.
[19] Kohavi, R., & Parekh, R. (2004, April). Visualizing RFM segmentation. Proceedings of the 2004 SIAM international conference on data mining (pp. 391-399). Society for Industrial and Applied Mathematics.
[20] Kotler, P., & Gordon, M. (1983). Principles of market. Canada: Prentice Hall.
[21] Kottler, P., & Keller, K. L. (2003). Marketing management. Analyse, Planung, Umsetzung und. [22] Liu, H. H., & Ong, C. S. (2008). Variable selection in clustering for marketing segmentation using
genetic algorithms. Expert systems with applications, 34(1), 502-510.
[23] Berzosa, D. L., Davila, J. A. M., & de Pablos Heredero, C. (2012). Business model transformation in the mobile industry: co-creating value with customers. Transformation in business & economics, 11(2).
[24] McLoughlin, F., Duffy, A., & Conlon, M. (2015). A clustering approach to domestic electricity load profile characterisation using smart metering data. Applied energy, 141, 190-199.
[25] Holloway, J. C. (2004). Marketing for tourism. Pearson education.
[26] Mutandwa, E., Kanuma, N. T., Rusatira, E., Kwiringirimana, T., Mugenzi, P., Govere, I., & Foti, R. (2009). Analysis of coffee export marketing in Rwanda: Application of the Boston consulting group matrix. African journal of business management, 3(5), 210.
[27] Myers, J. H. (1996). Segmentation and positioning for strategic marketing decisions. American Marketing Association.
[28] Seret, A., Maldonado, S., & Baesens, B. (2015). Identifying next relevant variables for segmentation by using feature selection approaches. Expert systems with applications, 42(15), 6255-6266. [29] Assael, H. (1984). Consumer behavior and marketing action. Kent Pub. Co..
[30] Smith, W. R. (1956). Product differentiation and market segmentation as alternative marketing strategies. Journal of marketing, 21(1), 3-8.
[31] Stone, B., & Jacobs, R. (1988). Successful direct marketing methods. Lincolnwood, IL: NTC Business Books.
[33] Wang, C. H. (2010). Apply robust segmentation to the service industry using kernel induced fuzzy clustering techniques. Expert systems with applications, 37(12), 8395-8400.
[34] Weinstein, A. (1987). Market segmentation: Using Niche marketing to exploit new markets. Probus Publishing.
[35] Yang, X. S. (2010). Engineering optimization: an introduction with metaheuristic applications. John Wiley & Sons.