Published online April 2, 2013 (http://www.sciencepublishinggroup.com/j/pbs) doi: 10.11648/j.pbs.20130202.11
A model of human behavior based on visual information
processing mechanism for reliability-based system
design
Kimihiro Yamanaka
Dept. of System Design of Tokyo Metropolitan University, Tokyo, Japan
Email address:
[email protected] (K. Yamanaka)
To cite this article:
Kimihiro Yamanaka. A Model of Human Behavior Based on Visual Information Processing Mechanism for Reliability-Based System Design, Psychology and Behavioral Sciences. Vol. 2, No. 2, 2013, pp. 20-27. doi: 10.11648/j.pbs.20130202.11
Abstract:
The aim of this study is to discuss the relation between the reliability of structural systems and the performance of human perception in human–machine systems. In this paper, we would like to evaluate the effect of performance deteri-oration on structural safety from the viewpoint of uncertainties in human behavior. The sensitivity of structural safety to such uncertainties is discussed on the basis of a stress–strength model by considering that uncertainties in structural systems can be divided into objective and subjective uncertainties in applied stress and strength. There are two types of subjective uncer-tainties, one associated with the designer and the other associated with the operator. In this context, the performance of the operator in terms of visual perception was investigated through visual tasks. Concretely, two kinds of experiments such as response time and useful field of view were carried out. Based on experimental results and analysis, it was shown that the relations between subjective uncertainty of machine and human performance affect the final probability of failure of struc-tural systems, including human-machine systems.Keywords:
Reliability, Structural Safety, Human Performance, Response Time, Useful Field Of View1. Introduction
The important factor of subjective uncertainty in the evaluation on structural safety is based on human error. The analysis of human error provides useful information re-quired for the promotion of efficient management of struc-tural systems, including human–machine systems, since structural failures are mostly due to poor human perfor-mance, for example: lack of perception, omissions, and mistakes of recognition or judgment. To address these problems, a number of human reliability analysis models have been proposed thus far by specialists from various fields such as psychology, natural science, behavioral or social science, and cognitive science [1-3]. However, the demand for such models can be understood if a distinction is made between various instances of the models.
There are three types of responses in human behavior under the operator model [1], where the operator receives perceptive stimulation. One type is a skill-based response, which usually refers to an unconscious reaction. In this case, the operator can react within the shortest possible response time after receiving some information, in which case reac-tive patterns are created without the process of recognition,
identification, and judgment. The second type of response is known as rule-based response, which is based on infor-mation processes such as recognition of the situation and matching the task to the situation. The third type of re-sponse is known as knowledge-based rere-sponse, whose main features are the processes of identification and judgment. Since the latter two types of reactions are conscious reac-tions, the response time is usually longer than in the case of unconscious reactions due to the intermittent processes of identification, judgment, and prediction.
Psychology and Behavioral Sciences 2013, 2(2) : 20-27 21
2. Reliability of Human-Machine
Sys-tems
2.1. Structural Safety and Human Performance
The relation between structural safety and human beha-vior in human–machine systems is shown in Fig. 1 in the form of a block diagram. In human–machine systems, the reliability (or structural safety) is strongly dependent on human performance. While the most pervasive model of human performance has been the stimu-lus–organism–response (S-O-R) paradigm it is no longer widely accepted as valid [2]. A metaphor is a way of con-veying a specific meaning, that is, to gain understanding of human cognition. One metaphor that has become wide-spread recently is the view of humans as an information processing system (IPS) [3]. The traditional view of infor-mation processing has been extended to the step ladder model (SLM). In IPS models, the internal mechanisms are typically discussed in far greater detail than in S-O-R mod-els. In the same context, focusing on the organism part of the paradigm, the step ladder model includes the function of three types of IPS models, such as skill-based, rule-based, and knowledge-based IPS, as developed by Rasmussen [1].
Figure 1. Structural safety and human performance.
The response to external information obtained through sensory perception is typically illustrated by the operator model proposed by Rasmussen. When receiving external information pertaining to safety in the form of visual or auditory signals, the response to these signals is described by the human performance model in Fig. 2. As shown in the figure, there are various patterns of response to external information.
Human performance is an important factor in hu-man–machine systems, when information is perceived with objective uncertainty with respect to the perception stimuli, because the response and safety depend on the judgment by the human operator and the accuracy of recognizing external information. Therefore, a decrease in performance with respect to perceptual information processing, such as de-creased UFOV or inde-creased response time, might affect the
system strength in human–machine systems, resulting in an increase in the probability of failure of structural systems, including human–machine systems.
Figure 2. Operator model [1].
2.2. Effect of Performance Deterioration on Structural Safety in Stress–Strength Model
To use the stress–strength model to formulate the concept of structural safety, including in the case of human–machine systems, stress applied to structural systems can be illu-strated using the strength of the structural system [5], as shown in Fig. 3. It is well known that the probability of failure is defined by
Figure 3. Stress strength model [5].
] [R S P
Pf = < (1)
where R and S are the applied stress and strength and P[x] denotes the occurrence probability of event x. An important point here is that the applied stress and strength must be formulated as random variables with objective and subjec-tive uncertainties. When R0 and S0 denote the original
ran-dom variables with objective uncertainties, as shown in Fig. 3, the critical state is expressed as
0
0 NS
R < (2)
In Eq. (2), N denotes the subjective uncertainties where
R S N
N
N= • (3)
Man-machine system
Perception (visual, auditory, …)
Recognition or identification of situation
Evaluation and judgment
Performance deterioration of human information processing (UFOV, RT)
Degradation of system strength
Increasing failure probability of structural system Uncertainties
Man-machine system
Perception (visual, auditory, …)
Recognition or identification of situation
Evaluation and judgment
Performance deterioration of human information processing (UFOV, RT)
Degradation of system strength
Increasing failure probability of structural system Uncertainties
identification of situation
judge/ evaluate
estimation/ planning
recognition of situation
task/ procedure matching
between situation and
task
catch of situation
creation of response patterns knowledge
base (level.3)
rule base (level.2)
skill base (level.1)
object target
receiving information
action inside
outside
c
o
n
s
c
io
u
s
re
a
c
tio
n
u
n
c
o
n
s
c
io
u
s
re
a
c
tio
n
Stress:
Strength:
R
S
R
0
R
S
0
S
Stress:
Strength:
R
S
R
0
R
S
0
Therefore, the probability of failure P
[R0 NS P
Pf = <
If the structural system is a human–machine system, expressed as
m R
R
R0= +
where Rm and Rh denote machine stren
performance, respectively, which correspond to the proof strength or strength capacity with respect
stress. From Eqs. (3) and (4), the probability structural system characterized by the parameter of strength capacity can be estimated from
[
R0/N N S0] [
PR /NP
PF = R≤ S = m R+
The factor NR in Eq. (6) denotes the subjective uncertainty
of structural strength of the human–machine system. though it is difficult to evaluate NR, it incorporates
jective uncertainties of the designer and
( D R f N
N =
ND and NR denote the respective subjective uncertainties
of the designer and the operator, where human error in the form of omissions and of the design, while the latter stems from
information input, such as visual perception. However, it should be noted that it is difficult to determine
in Eq. (7) since these uncertainties are associated w processing step in Fig. 4.
Figure 4. Uncertainties lay behind each process.
3. Case Study on Human Performance
in Term of RT & UFOV
This section introduces experimental results obtained by the authors as a case study on visual perception and hum behavior in order to discuss the aspects of subjective u certainty. The experiment examined two aspects of human performance namely, response time (RT) and
is the visual region of cognition.
3.1. Response Time [14,15]
The schematics of the experimental devices are shown in Fig. 5. The response time was measured as the time nece sary for recognizing a visual stimulus in an electromagne ically shielded room. A 21" CRT display (GDM SONY Corporation) was installed at a distance of 600 mm from the eyes of the participant, and the NTSC signal output from an imposer was converted into an RGB
up-scan converter.
Input PerceptualProcessor ProcessorCognitive ProcessorMotor Input PerceptualProcessor ProcessorCognitive ProcessorMotor
Pf can be rewritten as
]
0
NS (4)
machine system, R0 is
h
R (5)
strength and human correspond to the proof with respect to the applied probability of failure of a characterized by the parameter of human
from
]
0/N N S
Rh R≤ S
+ (6)
the subjective uncertainty machine system. Al-it incorporates the sub-designer and the operator, namely
)
,No (7)
subjective uncertainties the former indicates s and misunderstanding the latter stems from the lack of external such as visual perception. However, it determine the function are associated with each
Uncertainties lay behind each process.
Case Study on Human Performance
This section introduces experimental results obtained by the authors as a case study on visual perception and human behavior in order to discuss the aspects of subjective un-certainty. The experiment examined two aspects of human
namely, response time (RT) and UFOV, which
experimental devices are shown in Fig. 5. The response time was measured as the time neces-sary for recognizing a visual stimulus in an electromagnet-ically shielded room. A 21" CRT display (GDM-F500, SONY Corporation) was installed at a distance of 600 mm rom the eyes of the participant, and the NTSC signal output from an imposer was converted into an RGB signal by an
Figure 5. Schematic aspect of experimental devices
In the experiment for response time, the visual stimulus consists of foreground and background scenes, as shown in Fig. 6. In the foreground scene, S1 (a simple white circle with a size of 0.36° flashing at 53 cycles/min) was used to keep the visual attention in the center. The target mark S2, also with a size of 0.36°, wa
Snellen chart, and a similar shape was used as a standard mark. The appearance ratio of the target mark to the standard mark was 0.25, and the interval between S1 and S2 was 1700 ms, where S2 appeared within a zone with a radius
0° and 11.70° and random coordinates. Furthermore, the participants were provided with two buttons, as shown in Fig. 6. The subjects were instructed to press the button on the right as soon as they recognized the target mark S2 and the button on the left when S1 disappeared.
Figure 6. Experimental procedure
3D driving scenes were used for distracting the visual attention and interfering with recognition. Four patterns of driving scenes were used, as shown in Fig. 7, where V and D denote the factors of velocity and demand of traffic. There were two levels for factor V (velocity of vehicle: V1=40 km/h, V2=80 km/h) and factor D (demand of traffic: D1=non-crowded, D2=crowded).
Motor
Processor Output Motor
Processor Output
Graphic display
S
h
ie
ld
r
o
o
m
Participant Stereo glass
3D shutter
SW
Response time 600 mm
Graphic display
S
h
ie
ld
r
o
o
m
Participant Stereo glass
3D shutter
SW
Response time 600 mm
Schematic aspect of experimental devices.
In the experiment for response time, the visual stimulus foreground and background scenes, as shown in Fig. 6. In the foreground scene, S1 (a simple white circle with a size of 0.36° flashing at 53 cycles/min) was used to keep the visual attention in the center. The target mark S2, also with a size of 0.36°, was a specific shape from the Snellen chart, and a similar shape was used as a standard ratio of the target mark to the standard mark was 0.25, and the interval between S1 and S2 was 1700 ms, where S2 appeared within a zone with a radius between 0° and 11.70° and random coordinates. Furthermore, the participants were provided with two buttons, as shown in Fig. 6. The subjects were instructed to press the button on the right as soon as they recognized the target mark S2 and the
he left when S1 disappeared.
Experimental procedure.
3D driving scenes were used for distracting the visual attention and interfering with recognition. Four patterns of driving scenes were used, as shown in Fig. 7, where V and D denote the factors of velocity and demand of traffic. There factor V (velocity of vehicle: V1=40 km/h, V2=80 km/h) and factor D (demand of traffic:
crowded, D2=crowded).
Imposer
Synchronizer Up-scan converter
Foreground scene RGB image
Stimulus program
Background scene (3D video) Video player
NTSC image
Response time
Imposer
Synchronizer Up-scan converter
Foreground scene RGB image
Stimulus program
Background scene (3D video) Video player
NTSC image
Psychology and Behavioral Sciences 201
Figure 7. Driving scene as background
Two experiments were carried out in order to examine the effects of these factors. In one experiment, we measured the detection region of the simple white circle S1 ("detection experiment"), and in the other ("recognition experiment") we measured the recognition region with respect to a sp cific shape in the Snellen chart (S2). In the experimen participants were 17 university students aged 20 to 23 who had regular driver’s licenses and had normal or co rected-to-normal vision.
S2 appeared 48 times per run in the detection experiment and 256 times per run in the recognition experiment. Fu thermore, the standard mark appeared 208 times, and the target indicator appeared 48 times. In the experiments, the mark S2 appeared the same number of times per zone, and the difference in luminosity of S2 to the bac
determined as 10lx.
The response time is shown in Fig. 8 for the region where the target mark S2 appeared, where it is clear there were no differences between the regions. On the other hand, in the recognition experiment, there is a clear tendency that a wider regions of appearance of target mark S2 entailed a longer response time. For three regions of appearance, the response time for recognition was longer than that for detection, with a difference ranging between 230 and 290 ms on average.
Figure 8. RT and range of appearance
3.2. Useful Field of View [16,17]
2.00 6. 00
Range of appearance ( Detection
Recognition
400 800 1200
M
e
a
n
v
a
lu
e
o
f
R
T
(
m
s
) V1D1 V1D2 V2D1 V1D2
2.00 6. 00
Range of appearance ( Detection
Recognition
400 800 1200
M
e
a
n
v
a
lu
e
o
f
R
T
(
m
s
) V1D1 V1D2 V2D1 V1D2
Psychology and Behavioral Sciences 2013, 2(2) : 20-27
Driving scene as background.
Two experiments were carried out in order to examine the experiment, we measured the detection region of the simple white circle S1 ("detection experiment"), and in the other ("recognition experiment") we measured the recognition region with respect to a spe-cific shape in the Snellen chart (S2). In the experiments, the participants were 17 university students aged 20 to 23 who had regular driver’s licenses and had normal or
cor-S2 appeared 48 times per run in the detection experiment and 256 times per run in the recognition experiment. Fur-thermore, the standard mark appeared 208 times, and the target indicator appeared 48 times. In the experiments, the mark S2 appeared the same number of times per zone, and the difference in luminosity of S2 to the background was
ponse time is shown in Fig. 8 for the region where the target mark S2 appeared, where it is clear there were no differences between the regions. On the other hand, in the recognition experiment, there is a clear tendency that a wider of target mark S2 entailed a longer response time. For three regions of appearance, the response time for recognition was longer than that for detection, with a difference ranging between 230 and 290 ms on average.
RT and range of appearance.
The UFOV is the region where a participant can disti guish the shape, direction, and other parameters of the mark. This region is located in the central area, as compared with the static/kinetic field or conspicuity field,
9. In this figure, the field of view is defined by the region around the fixation point (FP) [10]. A problem is that there are no standards on how to measure UFOV at the fovea with a visual task. The term UFOV generally implies that peripheral performance depends not only on retinal sens tivity, but also on the nature of the perceptual task. Howe er, since these fields vary greatly with respect to differences in shape between target and background, density of bac ground noise, and so forth,
measure the boundaries exactly. In a recent study, Ball [12] measured the region as the UFOV where the target index can be detected against a unique or ambiguous background. Also, Ikeda [11] evaluated the influence of fovea lo UFOV. However, a quantitative guarantee cannot be given for the degree of accuracy of the UFOV as obtained above.
Figure 9. Definitions of field of view
In the following, we demonstrate a new method of me suring UFOV developed by the authors
its application, where the same experimental devices as in the experiment on RT in Fig. 5 are used. The experimental paradigm is shown in Fig. 10. A simple black circle (fix tion point S1) with a visual angle of 0.86° was used to keep the visual attention at the center of the CRT display. The recognition mark (S2), also with a size of 0.86° appeared in eight different orientations (0°, 45°, 90°, 135°, 180°, 225°, 270°, 315°). S2 is a specific object such as a character, an arrow or a certain shape, which are three standard types of indicators with the same attributes as shown in Fig. 11. The reason why these three types of recognition indicators are chosen is to investigate the differences in human perfo mance with regard to different visu
Figure 10. Distance and angles of recognition index
10.00
Range of appearance (o)
V1D2
10.00
Range of appearance (o)
V1D2
θ= 315 S1
S2
H
N
W
θ= 270 o
S2 S2
θ= 315 S1
S2
H
N
W
θ= 270 o
S2 S2
23
The UFOV is the region where a participant can distin-guish the shape, direction, and other parameters of the mark. This region is located in the central area, as compared with the static/kinetic field or conspicuity field, as shown in Fig. 9. In this figure, the field of view is defined by the region around the fixation point (FP) [10]. A problem is that there are no standards on how to measure UFOV at the fovea with a visual task. The term UFOV generally implies that eral performance depends not only on retinal sensi-tivity, but also on the nature of the perceptual task. Howev-er, since these fields vary greatly with respect to differences in shape between target and background, density of back-ground noise, and so forth, it is extremely difficult to measure the boundaries exactly. In a recent study, Ball [12] measured the region as the UFOV where the target index can be detected against a unique or ambiguous background. Also, Ikeda [11] evaluated the influence of fovea load on UFOV. However, a quantitative guarantee cannot be given for the degree of accuracy of the UFOV as obtained above.
itions of field of view [10].
In the following, we demonstrate a new method of mea-suring UFOV developed by the authors and the results of its application, where the same experimental devices as in the experiment on RT in Fig. 5 are used. The experimental paradigm is shown in Fig. 10. A simple black circle (fixa-tion point S1) with a visual angle of 0.86° was used to keep
e visual attention at the center of the CRT display. The recognition mark (S2), also with a size of 0.86° appeared in eight different orientations (0°, 45°, 90°, 135°, 180°, 225°, 270°, 315°). S2 is a specific object such as a character, an ain shape, which are three standard types of indicators with the same attributes as shown in Fig. 11. The reason why these three types of recognition indicators are chosen is to investigate the differences in human perfor-mance with regard to different visual stimuli.
Distance and angles of recognition index.
= 315 o
Participant
θ= 0 o
x
: Distance from fixation point : Angle from direction of 0o
θ x
= 315 o
Participant
θ= 0 o
x
: Distance from fixation point : Angle from direction of 0o
Figure 11. Recognition indices.
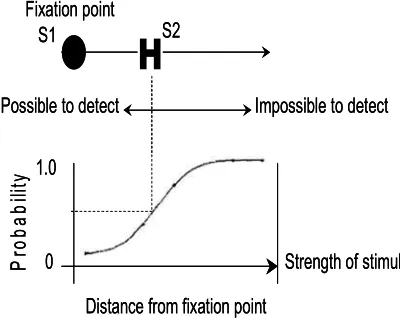
In the experiments, we measured two types of response categories, namely “possible to detect” or “impossible to detect” for the distance from the fixation point S1 to the recognition mark S2. As shown in Fig. 12, the distance from the fixation point to the recognition mark indicates the strength of the stimulus as a psychophysical quantity. Whereas the recognition mark can be detected when it ap-pears near the fixation point, and it becomes increasingly difficult and eventually impossible to detect the recognition mark when it appears further away from the fixation point. In other words, a longer distance from the fixation point to the recognition mark corresponds to a weaker strength of the stimulus.
Figure 12. Psychometric curve.
The purpose of this experiment is to measure the thre-shold of recognition when the response category changes from “possible to detect” to “impossible to detect” or vice versa. It is well known that the function linking the possi-bility of detection and the strength of the stimulus can be obtained as a psychometric curve [10]. Since the distance of the boundary between the “possible to detect” and “im-possible to detect” categories indicates the threshold of recognition, the latter can be estimated by using a psycho-metric curve. Therefore, it may be possible to obtain the psychometric curves in any direction from the fixation point, and it is also known that the stimulus threshold can be obtained as a probabilistic percentile of this psychome-tric curve. One of the examples of this threshold with a 50% probability is the point of subjective equality (PSE), which is equivalent to the threshold of recognition. As shown in Fig. 13, if we can assume that the region plotted within these stimulus thresholds is defined as UFOV, then the out-er limit of the region connected with PSE for each angle is also defined as UFOV.
Figure 13. Definition of UFOV.
Fig. 14(a) shows the kinetic field of view of participant B. In this figure, the regions shown in solid and dotted lines are the fields for the recognition marks with a size of 0.86° and 0.43° respectively. On the other hand, the regions shown in Fig. 14(b) are the UFOV for the recognition marks with a size of 0.86° and 0.43°, respectively. Com-pared with Fig. 14 (a) and (b), it is clear that there is a dif-ference in the region between the kinetic field of view and UFOV. From Fig. 14 (b), it can be seen that UFOV is af-fected by the size of the recognition mark, and this tenden-cy is observed for all types of recognition marks and all participants. These facts hint at important differences in the mechanism of IPS for the kinetic field of view and UFOV. In the former case, there are no differences caused by the size of the target mark since the mechanism of IPS is sim-ple, such as in the skill base under the operator model of Fig. 2. This means that there is little variation in kinetic field in the visual task. On the other hand, the variation in UFOV means that the mechanism in this case is due to a knowledge-based task in the operator model. Therefore, the deterioration in human performance in the case of the ki-netic field is small, and therefore the probability of failure due to human error is small in comparison with that in the case of UFOV. A plot of RT as a function of UFOV is also shown in Fig. 15, which clearly shows that there is correla-tion between the two parameters (r=0.79), although the correlation between RT and UFOV is a useful tool for esti-mating the probability of failure caused by human error.
Figure 14. Comparison of UFOV with Kinetic field (participant B
Character
Arrow
Shape
Character
Arrow
Shape
Fixation point
S1
Strength of stimuli
Possible to detect
Impossible to detect
Distance from fixation point
0
1.0
P
ro
b
a
b
ili
ty
H
S2
Fixation point
S1
Strength of stimuli
Possible to detect
Impossible to detect
Distance from fixation point
0
1.0
P
ro
b
a
b
ili
ty
H
S2
0o p=1.0
p=0.5 p=1.0
p=0.5
p
=
1
.0
p
=
0
.5
PSE PSE
PSE
UFOV 45o 90o
270o
180o 0o
p=1.0
p=0.5 p=1.0
p=0.5
p
=
1
.0
p
=
0
.5
PSE PSE
PSE
UFOV 45o 90o
270o
180o
Size of index
(a) Kinetic field (b) Useful field of view Recognition index 80 o
80 o
80 o 40 o 40 o 80 o
40 o 40 o
10 o
10 o 10 o 10 o
0.86 o 0.43 o Size of index
(a) Kinetic field (b) Useful field of view Recognition index 80 o
80 o
80 o 40 o 40 o 80 o
40 o 40 o
10 o
10 o 10 o 10 o
Psychology and Behavioral Sciences 2013, 2(2) : 20-27 25
Figure 15. Relation between RT and UFOV.
4. Discussion
In this section, we assume that there are several rela-tionships between human perceptual performance and safe-ty. Therefore, this question is discussed by considering the broad fields of psychology and cognitive science.
4.1. Experimental Results and Hypotheses
The phenomenon of narrowing of the region within the visibility field as a result of additional visual tasks (known as visual tunneling, perceptual narrowing or tunnel vision), is highly relevant to information processing systems (IPS). In order to explain the mechanism of this phenomenon, a new hypothesis on visual attention has been proposed from the viewpoint of cognitive and psychophysical science. In this hypothesis, the reasons for the occurrence of visual tunne-ling are based on the following two distinct rules [4,6,8]:
Rule 1: When the visual demand exceeds the ordinal visual task, the distance of moving visual attention is out of the region of the useful field of view.
Rule 2: When the visual demand exceeds the ordinal visual task, there is less overlap with UFOV.
Fig. 16 shows an illustration of the concept of these rules, which is derived from the concept of the depth L and width W of visual processing and the principle of constant re-sources for information processing. Specifically, this hypo-thesis can be easily applied to general situations with mov-ing fixation points by changmov-ing the movmov-ing distance D in Fig. 16.
Figure 16. Visual tunneling by psychophysical model [6].
In addition, a new concept referred to as cognitive mo-mentum, which indicates the active characteristics for in-formation processing, was recently proposed[8,9]. Accord-ing to cognitive momentum, the reason why visual tunnelAccord-ing occurs at higher visual demand is not the degradation of information processing but rather the adaptation to the changed situation for information processing caused by partitioning of resources for information processing.
4.2. Cognitive Model with Processing Mechanism
The typical results of the experiments mentioned in the previous section raise two important questions, namely, (1) why there is a difference of 230 to 290 ms in response time and a difference of 1.5° to 3.15° in angle between detection and recognition experiments, as shown in this experimental paradigm, and (2) how we can explain the existence of several types of distinct response times depending on the zone (1, 2 or 3) in the recognition experiment.
The most pervasive model of a human operator is likely the S-O-R paradigm [2], where the response is assumed to be a function of the stimulus and the organism, that is,
) ,
(S O
f R=
The Rasmussen model [1] is one such model which be-came well-known as the SLM in cognitive science [1]. It is nevertheless difficult to appreciate that the S-O-R paradigm and SLM show two fundamental similarities, such as se-quential progression through the internal mechanism and dependence on a stimulus or event to start the processing. Therefore, it is difficult to answer the above two questions by using cognitive models such as the S-O-R paradigm or SLM. One of the latest versions of this metaphor is based on the notion of human cognition as a fallible machine. This idea is most clearly expressed through an indirect definition of a feasible information processing device [1].
It is well known from brain research that there are two channels of visual information processing, where one channel concerns the detection of motion and the other concerns the recognition of the characteristics of objects [7]. From this knowledge, we can construct a model of the me-chanism of information processing corresponding to the experimental paradigm in this paper. Fig. 17 shows an IPS model for a visual task proposed by the authors [13], where the two channels correspond to information processing of foreground and background scenes respectively. As shown in the figure, the processing in both experiments (detection and recognition) is performed in parallel. Therefore, more time is required for recognition in the recognition experi-ment when presented with a visual task involving a target object located far from the fixation point, which answers both questions.
0 5 10 15 20
500 1000 1500
Useful field of view (o.)
M
e
a
n
v
a
lu
e
o
f
R
T
(
m
s
) r=0.79
0 5 10 15 20
500 1000 1500
Useful field of view (o.)
M
e
a
n
v
a
lu
e
o
f
R
T
(
m
s
) r=0.79
D : Moving distance of fixation W : Wide of processing L : Depth of processing Under more demand
Under smaller demand
D
W
W
L
L
D : Moving distance of fixation W : Wide of processing L : Depth of processing Under more demand
Under smaller demand
D
W
W
L
Figure 17. IPS model for visual task.
4.3. Effect Of UFOV and RT on Structural Safety
The performance with respect to two typical types of human perception was investigated. As a result, deteriora-tion in performance was confirmed, and the reasons were explained by the IPS model which takes into account the psychological, cognitive, and physiological aspects of the mechanism of perception. To predict the effect of deteriora-tion in perceptual ability on structural safety, we consider the causal relation between changes in UFOV and response time as shown in Fig. 18. A wider UFOV means that the moving eyes are not fixated since the peripheral field of view is wider when UFOV is wide in the case of moving eyes. However, we can assume that the visual task requires a longer time to complete with a wide UFOV than with a narrow UFOV since there are more resources for IPS in the former case at the same depth L for information processing in Fig. 16.
Figure 18. Structural safety and human perceptual properties.
As shown in Fig. 18, it may be possible to estimate the probability of failure by calculating the relation between the response time and the delay in response time. However, as shown in Fig. 15, it is difficult to obtain an exact corres-pondence in this relationship. This problem will be investi-gated in future work.
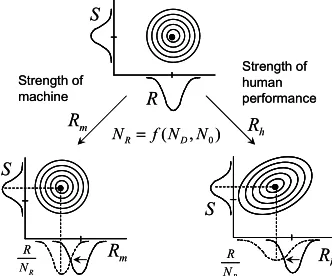
As mentioned in the discussion in Section 2, the strength of human–machine systems is determined by the strength of the machine and the human performance. However, there are substantial differences between the characteristics of sub-jective uncertainties of machine strength and human per-formance. In the former, the strength Rm of the machine is independent of the applied stress, whereas the human per-formance Rh is.
The difficulties of estimating the degree of degradation in strength of human–machine systems are due to these de-pendences and nonlinear behavior. This relation is illustrated in Fig. 19, where the strength distribution of hu-man–machine systems is independent of the subjective un-certainty associated with machines and dependent on that associated with human performance. Based on the discus-sion in this section, these relations affect the final probability of failure of structural systems, including human–machine systems, as illustrated in Fig. 20.
Figure 19. Dependency and independency of strength distribution.
Figure 20. Effect of subjective uncertainty of machine and human perfor-mance.
5. Conclusion
The relation between structural safety and the perfor-mance of the operator in terms of visual perception was investigated by focusing on the parameters of response time (RT) and the useful field of view (UFOV) in order to
eva-Recognition of character (Foreground) Recognition of movement (Background)
Object Action
Outside Inside
Receiving information Route 1 Route 2
Retina LGB
V1
Judgment IT, MST
V2 V3 V4
V2 V3 V4 MT
Recognition of character (Foreground) Recognition of movement (Background)
Object Action
Outside Inside
Receiving information Route 1 Route 2
Retina LGB
V1
Judgment IT, MST
V2 V3 V4
V2 V3 V4 MT
UFOV with fixation Eye-tracking without fixation
Understanding & Judgment Response Time
U0
U1
U2
RECOGNITION
COMMISSION from Motor censor it
tlim t0+tdelay
) (limit delay f Pt t
p = ≤
START TARGET
UFOV with fixation Eye-tracking without fixation
Understanding & Judgment Response Time
U0
U1
U2
RECOGNITION
COMMISSION from Motor censor it
tlim t0+tdelay
) (limit delay f Pt t
p = ≤
START TARGET
R m
N R
R
m
R
h
R
0
R
m
R
h
R
0
R
R h
N R
Independent Dependent
+
+
=
=
R m
N R
R
m
R
h
R
0
R
m
R
h
R
0
R
R h
N R
Independent Dependent
+
+
=
=
R S
m
R
) , (N N0
f
NR= D
S
S
R
N R
h
R
m
R
h
R
R
N R
Strength of machine
Strength of human performance
R S
m
R
) , (N N0
f
NR= D
S
S
R
N R
h
R
m
R
h
R
R
N R
Strength of machine
Psychology and Behavioral Sciences 2013, 2(2) : 20-27 27
luate the effects of deterioration of human performance in visual tasks. It is also considered that there are several rela-tionships between human perceptual performance and structural safety in human–machine systems. The causes for deterioration of human performance, such as the properties of human perception, are discussed on the basis of an IPS model. These issues will be the focus of future work, whe-reby it is necessary to formulate a method for measuring and standardizing human performance. Furthermore, to evaluate the effect of changes in human performance, the method for estimating structural reliability and safety must be linked with the method for estimating human performance.
References
[1] J. Reason, Human Error, Cambridge, UK: Cambridge Uni-versity Press, 1990.
[2] E. Hollnagel, Human Reliability Analysis -Context and Control, Massachusetts, USA: Academic Press, 1993. [3] S.K. Card, T.P. Noran, and A. Newell, The Psychology of
Human-Computer Iteraction, New Jersey, USA: Lawrence Erlbaum Associates Publishers, 1983.
[4] T. Miura, "What is the narrowing of visual field with the license of increase of speed", Proc. of 10th International Congress on Association for Accident and Traffic Medicine, 1985, pp.21-24.
[5] K. Samnel, L. Yan and P. Marianna, The Stress-Strength Model and Its Generalizations: Theory and Application, Toh Tuck Link, Singapore: World Scientific Publishers, 2003. [6] T. Miura, “Visual search in Intersections -An Underlying
Mechanism-“, IATSS Research, Vol.16, No.1, 1992, pp.42-49.
[7] S. Amari, and K. Toyama, Dictionary of Brain Science, Tokyo, Japan: Asakura Publiser Inc., 2000.
[8] T. Miura, Behavior and Visual Attention, Tokyo, Japan:
Kazama Publisher Inc., 1996.
[9] T Miura, K Shinohara and K Kanda, “Visual Attention in Automobile driving: From Eye Movement Study to Depth Attention Study”, Proc. of 2nd International Conference on Psychophysiology in Ergonomics, 1988, pp.7-8.
[10] T. Ohyama, S. Imai and T.Wake, Handbook of Sensory and Perceptive Psychology, Tokyo, Japan: Seishinn Publisher Inc., 1994.
[11] M. Ikeda and T. Takeuchi, “Influence of foveal load on the functional visual field”. Perception & psychophysics, Vol.18, No.4, 1975, pp.225-260.
[12] K. Ball and C.Owsley, “The useful field of view test: A new technique for evaluating age related declines in visual func-tion”. Journal of American Optometric Association, Vol.16, No.1, 1993, pp.71-79.
[13] K. Yamanaka and H. Nakayasu, “A model of information processing for visual task at driving a load vehicle”, Proc. of 3rd International Conference Artificial Intelligence and Ap-plications, 2003, pp.545-550.
[14] K. Yamanaka, H. Nakayasu and K. Maeda, “Experimental Study on Visual Information Transition at Driving Automo-bile for Reliability-Based Design”, Proc. of Workshop on Reliability-Based Design and Optimization, 2002, pp.251-256.
[15] K. Yamanaka, K. Maeda, T. Miyoshi, H. Hayashi and H. Nakayasu, “Evaluation of response properties an automobile driver based on design of experiment”, Advances in Trans-portation Studies an International Journal, Section B6, 2005, pp.37-55.
[16] K. Yamanaka, H. Nakayasu and T. Miyoshi, “Recogni-tion-Probability-Based Useful Field of View by Probit Me-thod”, Proc. of 13th International Workshop on Robot and Human Interactive Communication, 2004, pp.607-612. [17] K. Yamanaka and H. Nakayasu, “Measurement and
![Figure 2. Operator model [1].](https://thumb-us.123doks.com/thumbv2/123dok_us/8576410.1717848/2.595.330.535.120.331/figure-operator-model.webp)
![Figure 16. Visual tunneling by psychophysical model [6].](https://thumb-us.123doks.com/thumbv2/123dok_us/8576410.1717848/6.595.82.275.586.733/figure-visual-tunneling-psychophysical-model.webp)