ORIGINAL ARTICLE
A CROSS-SECTIONAL STUDY OF SOFT TISSUE FACIAL
MORPHOMETRY IN CHILDREN AND ADOLESCENTS
Nizam Abdullah*, Lin Naing**, Norliza Mastura Ismail** and Abdul Rashid Ismail**
*Department of Community Medicine,
School of Medical Sciences, **School of Dental Sciences, Universiti Sains Malaysia, 16150 Kubang Kerian, Kelantan, Malaysia
The aim of this study was to determine mean values for selected linear measurements on the face of children and adolescents to demonstrate gender differences in the measurements. Cross-sectional data from 262 school children (158 male, 104 female) aged between 6 and 15 years were taken by measuring certain identified facial landmarks using a sliding caliper. The landmarks were first located by careful inspection and/or palpation of the face and a mark created on the cutaneous surface, with the subject sitting in habitual occlusion in an upright position. A sliding caliper was used to measure the distances between the points. The data was analysed using SPSS version 10.0 to determine mean values, standard deviation and gender differences in the measurements. Upper facial heights, total facial height, inter-canthal distance and eye length measurements were significantly higher in male than in female for 15-year-old group (p<0.0001). The measurement between the highest and the lowest point of attachment of external ear to the head was significantly larger in male than in female for 11 year old age group.
Keywords : facial growth, soft tissue facial morphometry
Introduction
Development of normal population reference measurements for the craniofacial complex is an important component in studying craniofacial dysmorphology. Harmonious facial esthetics and functional occlusion have long been recognized as two of the goals of orthodontic treatment (1). The study of normal craniofacial growth which involves evaluation of soft-tissue integument as well as the underlying hard tissues is essential to accomplish these goals. Early observations demonstrated a concern with finding or establishing a harmonious relationship between the mouth and facial features. However, no attempts were made either to quantify changes in the facial profile with growth or to quantify the static facial pattern. While correcting malocclusions, the facial outlines should be regarded as an important guide in developing a proper treatment plan. A thorough concept of the normal growth pattern of the child’s face or any face is as important to orthodontists as the complete mastery
of the science of occlusion. Artists, surgeons and even lay people have often searched for a quantitative definition of human beauty and therefore not surprisingly, most of the researches involved the face, the attractiveness of which influences a large part of our social behaviour and relationships (2). Artists and sculptors throughout history appear to have had a clear idea of what represents normality and beauty. They show obvious cultural and racial differences (3). A review of the literature indicates that many soft-tissue profile analyses have been proposed to evaluate and quantify the soft-tissue profile. However, some analyses are too complicated or require sophisticated equipment not readily available to the clinician and, in their present form, are of little value as clinical tools. In addition, the analysis that appears to have the most clinical value have insufficient documentation of longitudinal changes. Today, improvements in medical imaging allow reproduction of external surfaces and internal structures of the living body with high resolution
26
and several analyses of the facial surfaces may also be obtained through stereophotogrammetry technology(4). Unfortunately, the state-of-the-art methods for the evaluation of three-dimensional facial structures require expensive machinery and procedures. While these methods produce large amounts of data, mathematical evaluation is difficult and of poor meaning to the clinician. It then leads to the absence of normative data in a population(5). Advances in the field of dental, orthodontics, oral and craniofacial surgery in Malaysia demands a local data base of Malaysian facial norms for more accurate pre and postoperative evaluation. This present study aims to provide reference data for selected linear measurements of the face for the Malaysian population.
Objectives
The objective of this study was to obtain reference data for 13 linear measurements of the face
and to evaluate gender differences.
Materials and Methods
A multistage cluster sampling was done to select children aged from 6 to 17 years of age for this study. One pre-school, one primary school and one secondary school from Kota Bharu district in Kelantan were selected by stratified random sampling. Children in each school were selected from the school register by simple random sampling. Only children without any craniofacial deformity were included in the study. Children with any history of trauma to the facial region were excluded.
Data from 262 school children (158 male, 104 female) aged between 6 and 15 years old were taken by measuring certain identified soft tissue facial landmarks using a sliding caliper. The measurements were performed by a single examiner. The landmarks were first located by careful inspection and/or palpation of the face and a mark was created on the
Table 2 : Mean and SD (mm) of linear distances (eye measurement and intercanthal distances) in 150 male and 104 female subjects
Age (Year)
5.5 - 6.5
6.5 - 7.5
10.5 - 11.5
14.5 - 15.5
Age (Year)
5.5 - 6.5
6.5 - 7.5
10.5 -11.5
14.5 - 15.5
r stat. (df) .75 (57) -.52 (49) -.28 (74) 4.50 (66) 2.12 (57) 1.84 (49) -.21 (42) 3.48 (66)
P value
.458
.604
.782
<001
P value
.038
.072
.837
.001
r stat. (df) .75 (57) -.52 (49) -.28 (74) 4.50 (66) 2.12 (57) 1.84 (49) -.21 (42) 3.48 (66)
P value
.458
.604
.782
<001
P value
cutaneous surface with the subject sitting in an upright position and the jaws in habitual occlusion. A sliding caliper was used to measure the distances between the points marked on the skin. The data was analysed using SPSS version 10 to determine the mean values, standard deviations and gender differences.
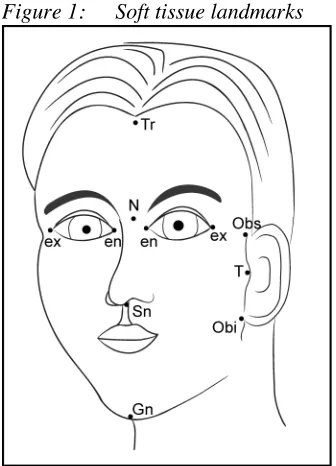
The following soft-tissue landmarks were considered: (Figure 1)
• Tr (trichion) : the midpoint of the hairline • N (nasion) : the innermost point between
forehead and nose
• Sn (subnasale) : in the midline, the junction between the lower border of the nasal septum
and the cutaneous portion of the upper lip. • Gn (Gnathion) : in the midline, the lowest point
on the lower border of the chin
• En (Endocanthion) : the inner corner of the eye fissure where the eyelids meet
• Ex (Exocanthion) : the outer corner of the eye where the eyelids meet
• Obs (Otubasion superious) : the highest point of attachment of the external ear to the head. • Obi (Otubasion inferus) : the lowest point of
attachment of the external ear to the head. • T (Tragion) : at the notch above the tragus of the
ear where the upper edge of the cartilage disappears into the skin of the face.
Table 3: Mean and SD (in millimeter) of linear distances (Ear measurement and distance to the eye and the nose) comparing between 150 male and 104 female subjects
Figure 1: Soft tissue landmarks Age (Year) 5.5-6.5 6.5-7.5 10.5-11.5 14.5-15.5 Age (Year) 5.5-6.5 6.5-7.5 10.5-11.5 14.5-15.5 (n) Male (30) Female (29) Male (29) Female (22) Male (39) Female (37) Male (52) Female (16)
(n) Male (30) Female (29) Male (29) Female (22) Male (39) Female (37) Male (52) Female (16) Mean (SD) 64.6 (3.4) 64.0 (5.0) 67.0 (3.5) 64.4 (3.4) 69.1 (4.2) 67.6 (5.3) 73.2 (3.4) 66.5 (2.7) Mean (SD) 109.1 (5.3) 103.8 (7.2) 113.3 (3.2) 107.7 (5.4) 113.6 (6.0) 102.7 (18.5) 122.5 (11.1) 112.0 (4.3) Ex-Obs t stat. (df)
.49 (57) 2.61 (49) 1.33 (74) 7.00 (66) Sn-Obs t stat. (df)
3.23 (57)
4.27 (32)
3.40 (43)
3.66 (66)
p value .629
.012
.187
<.001 p value
.002
<.001
.001
.001
Ex-Obi t stat. (df) .43 (57) 2.00 (49) .65 (74) 5.62 (66) Sn-Obi t stat. (df)
2.43 (57)
3.13 (49)
2.20 (74)
7.68 (66) p value
.671
.051
.519
<.001 p value
.018
.003
.031
<.001
Ex-T t stat. (df)
1.12 (57) 3.78 (49) .96 (59) 3.59 (66) Obs-Obi t stat. (df) 2.72 (57)
.11 (49)
5.10 (74)
1.82 (66) p value
.266
<.001
.343
.001 p value
28
4. En-En
5. Ex-Ex
6. Ex-En (left)
7. Ex-En (right)
8. Ex-Obs
9. Ex-Obi
10. Ex-T
11. Sn-Obs
12. Sn-Obi
13. Obs-Obi
Results
Mean values, standard deviations and significant differences between male and female subjects for various age groups are listed in Table 1 to 3. Eleven out of thirteen linear measurements were significantly higher in male than in female at 15 years of age (p< 0.001) and no significant gender differences were demonstrated for these measurements at the lower age group. The highest inter-sample variability was observed for the measurements from subnasal (Sn) to the highest point of attachment of the external ear to the head (Obs). The measurement between the highest and the lowest point of attachment of external ear to the head (Obs-Obi) was significantly higher in male than in female at 11 years of age. Forehead height (Tr-N) showed no significant gender difference in all age groups.
Discussion
The individuality of the human face is an important phenomenon in one’s life. No part of our anatomy provides more information like the face. Minor alterations in the size, shape, position and proportion of our face results in major perceptible differences and subtle differences between two people are instantly recognizable.
Measurements of the human face have been performed since ancient times and many measurements defined then can still be found in modern clinical anthropometry (5).
It is clear that landmarks chosen in this study were only limited to only 9 points with 13 linear measurements and they did not describe the whole
growth (6). Some authors suggested the placement of metallic markers in the growing jaws which could permit superimposition on some presumably stable structures (7).
The use of cutaneous points as was done in this study may require further investigations because facial harmony and balance are determined by the facial skeleton and its soft tissue drape (8). However, it is the structure of the overlying soft tissues and their relative proportion that provide most of the visual impact of the face.
The process of measuring human face often involves three-dimensional evaluation of human face. More recently, computerized analysis and stereophotogrammetry have been attempted. These studies of the soft tissue profile attempted to quantify changes in the overall profile, as well as in its various components (the lips, chin, and nose) which deals both with internal and external structures requiring expensive machinery and procedures. The present study is obviously limited to cutaneous points measurements, but on the other hand, it is not expensive, non-invasive and can easily be applied to a large number of subjects providing normative data.
Correspondence :
Dr. Nizam Abdullah BDS, DDPHRCS (Eng.), FICD Department of Community Medicine
School of Medical Sciences,
Universiti Sains Malaysia, health Campus, 16150 Kubang Kerian, Kelantan, Malaysia Tel: 6-09-7663700 Fax: 6-09-7642026 e-mail: [email protected]
References :
1. Samir E.B., Timoty J.H., Captain, USAF(DC)., Lawrence C & Peterson, B.S. Longitudinal soft-tissue profile changes: A study of three analyses. Am. J.
Orthod 1985; 88: 209-223.
2. Virgillio F.F., Chiarella S., Carlo F.G., and Gianluca T. Facial morpometry of television actresses compared with normal women. J. Oral Maxillofac. Surg. 1995; 53: 1008-1014.
3. Pogret MA. What are normal esthetic value? J. Oral
4. Ferrario. Soft-tissue facial morphometry from 6 years to Adulthood: A three-dimensional growth study using new modeling. Plast Reconstr. Surg.1999; 103(3): 768-778.
5. Vegter F and Hage JJ. Clinical anthropometry and canons of the face in historical perspective. Plast.
Reconstr. Surg 2000; 106: 1090-1096.
6. Maue-Dickson W. The craniofacial complex in cleft lip and palate: an update review of anatomy and function. Cleft Palate J 1979; 16: 291-317.
7. Bjork A. Prediction of mandibular growth rotation. Am
J Orthod 1969; 55: 585-599.
8. Virgilio F., Ferrario, Chiarella S., Poggio and Graziona S. Facial three-dimensional morphometry. Am.
J.Orthod. and Dentofacial Orthopedics. 1996; 109(1):