Air-Liquid Interface Method To Study Epstein-Barr Virus
Pathogenesis in Nasopharyngeal Epithelial Cells
Elizabeth A. Caves,
aSarah A. Cook,
aNara Lee,
bDonna Stoltz,
cSimon Watkins,
cKathy H. Y. Shair
a,baCancer Virology Program, UPMC Hillman Cancer Center, University of Pittsburgh, Pittsburgh, Pennsylvania, USA
bDepartment of Microbiology and Molecular Genetics, University of Pittsburgh, Pittsburgh, Pennsylvania, USA
cDepartment of Cell Biology, University of Pittsburgh, Pittsburgh, Pennsylvania, USA
ABSTRACT
Epstein-Barr virus (EBV) is a ubiquitous gammaherpesvirus that
estab-lishes a latent reservoir in peripheral B-lymphocytes with sporadic reactivation. EBV
also infects epithelial cells, predominantly resulting in a lytic infection, which may
contribute to EBV transmission from saliva. In the nasopharynx, EBV infection can
lead to the clonal expansion of a latently infected cell and the development of
sopharyngeal carcinoma (NPC). The mechanisms governing EBV pathogenesis in
na-sopharyngeal epithelium are largely unknown. An advanced understanding would
depend on a physiologically relevant culture model of polarized airway epithelium.
The recent application of the organotypic raft culture in keratinocytes has
demon-strated great promise for the use of polarized cultures in the study of EBV
permis-sive replication. In this study, the adaptation of an air-liquid interface (ALI) culture
method using transwell membranes was explored in an EBV-infected NPC cell line.
In the EBV-infected NPC HK1 cell line, ALI culture resulted in the completion of EBV
reactivation, with global induction of the lytic cascade, replication of EBV genomes,
and production of infectious progeny virus. We propose that the ALI culture method
can be widely adopted as a physiologically relevant model to study EBV
pathogene-sis in polarized nasal epithelial cells.
IMPORTANCE
Lifting adherent cells to the air-liquid interface (ALI) is a method
con-ventionally used to culture airway epithelial cells into polarized apical and
basolat-eral surfaces. Reactivation of Epstein-Barr virus (EBV) from monolayer epithelial
cul-tures is sometimes abortive, which may be attributed to the lack of authentic
reactivation triggers that occur in stratified epithelium
in vivo
. In the present work,
the ALI culture method was applied to study EBV reactivation in nasopharyngeal
ep-ithelial cells. The ALI culture of an EBV-infected cell line yielded high titers and can
be dissected by a variety of molecular virology assays that measure induction of the
EBV lytic cascade and EBV genome replication and assembly. EBV infection of
polar-ized cultures of primary epithelial cells can be challenging and can have variable
ef-ficiencies. However, the use of the ALI method with established EBV-infected cell
lines offers a readily available and reproducible approach for the study of EBV
per-missive replication in polarized epithelia.
KEYWORDS
air-liquid interface, Epstein-Barr virus, permissive infection
E
pstein-Barr virus (EBV) is a human pathogen that results in lifelong persistence, with
more than 90% seroconversion in the adult population (1). EBV infects epithelial
cells and B-lymphocytes, maintaining a latent reservoir in circulating memory B-cells
with sporadic reactivation and transmission from oral secretions (2). Unlicensed
repli-cation in B-cells can manifest clinically as infectious mononucleosis, while productive
replication in epithelial cells can be associated with immune suppression in AIDS
Received22 March 2018Accepted8 June 2018 Published18 July 2018
CitationCaves EA, Cook SA, Lee N, Stoltz D, Watkins S, Shair KHY. 2018. Air-liquid interface method to study Epstein-Barr virus pathogenesis in nasopharyngeal epithelial cells. mSphere 3:e00152-18.https://doi.org/10 .1128/mSphere.00152-18.
EditorBlossom Damania, UNC-Chapel Hill
Copyright© 2018 Caves et al. This is an open-access article distributed under the terms of theCreative Commons Attribution 4.0 International license.
Address correspondence to Kathy H. Y. Shair, [email protected].
For a commentary on this article, seehttps:// doi.org/10.1128/mSphere.00350-18.
Host-Microbe Biology
crossm
on September 8, 2020 by guest
http://msphere.asm.org/
Downloaded from
on September 8, 2020 by guest
http://msphere.asm.org/
Downloaded from
on September 8, 2020 by guest
http://msphere.asm.org/
patients in a disease known as oral hairy leukoplakia (OHL) (3). Latent infection is linked
to all forms of EBV-associated cancers, including nasopharyngeal carcinoma (NPC) (1, 4,
5). EBV genomes are typically not integrated in the host cell, existing as circular
episomal genomes in latently infected cells or as linear genomes in lytically replicating
cells (6). During latency, the variable numbers of terminal repeats at the ends of the EBV
genome fuse to produce uniquely sized BamHI-digested bands, which can be analyzed
by Southern blotting in a termini assay to differentiate the states of infection (latent
versus lytic and polyclonal versus monoclonal) (7). The state of EBV genomes in NPC
tumors is latent and monoclonal, strongly supporting the hypothesis that EBV infection
is present at the inception of neoplastic transformation (7, 8). Expression of the EBV
oncoprotein latent membrane protein 1 (LMP1) in epithelial cells and rat-1 fibroblasts
can promote oncogenic properties, including anchorage-independent growth and
increased motility, and can also result in the formation of tumors in nude mice (8–12).
Despite the association with oncogenic properties, it has been more difficult to
elucidate the early events that lead to the establishment of latency and infection
persistence in NPC (5, 13–15). The development of a robust
in vitro
method to mimic
differentiation-induced lytic reactivation in polarized epithelia, in primary or
immortal-ized airway epithelial cell lines, could significantly advance our interrogation of EBV
pathogenesis in preneoplastic mechanisms.
The conventional method to reactivate EBV is by chemical induction with histone
deacetylase (HDAC) inhibitors and protein kinase C inhibitors
(12-O-tetradecanoyl-phorbol 13-acetate [TPA] and sodium butyrate) (6, 16). Alternatively, the lytic cascade
can be triggered by transfecting the immediate early gene product zebra and late
glycoprotein gB (6, 17). However, these methods do not recapitulate
differentiation-induced reactivation and, depending on the cell line, can be abortive without
produc-tion of progeny virus to appreciable titers (16, 18, 19). Moreover, not all cell lines are
efficiently transfected and chemical induction inadvertently affects global host and
viral epigenetics. The organotypic raft culture model established for studies in human
papillomavirus (HPV) replication was recently applied to trigger EBV reactivation,
resulting in the efficient production of infectious progeny virus that spreads in stratified
primary keratinocytes (20). The organotypic raft culture can also be applied to the study
of EBV infection in human telomerase reverse transcriptase (hTERT)-immortalized
ker-atinocyte cell lines but is not always as robust a model for viral spread (21). One of the
triumphs of the organotypic raft model for the study of EBV reactivation is that it is
amenable to many standard DNA/RNA/protein molecular virology techniques
evalu-ated either at the population level or at single-cell resolution by immunostaining and
imaging methods (22). Nonetheless, the organotypic raft culture method selects for
keratinocytes and is not yet a widely adopted technique. A method that can be applied
to additional epithelial cell types and could be readily adopted for widespread use is
the air-liquid interface (ALI) culture method, which is conventionally used to polarize
primary airway epithelial cells of nasal or bronchial origin (23, 24).
The air-liquid interface (ALI) culture method establishes apical and basolateral
surfaces by seeding cells on a collagen-coated (or equivalent extracellular
matrix-coated) transwell membrane (25). Once an intact epithelium is established, the apical
medium is removed and cells are fed through a porous membrane from the basolateral
surface (Fig. 1A). Originally, the ALI method was used to establish pseudostratified
cultures of primary airway epithelial cells with apical cilia and basolateral nuclei, which
can preserve the diversity of cell types resembling native airway epithelium (23, 24). The
ALI method can also be applied to immortalized cell lines (26, 27). ALI culture
condi-tions have been routinely used for both primary and immortalized cells to study the
pathogenesis of airway microbial pathogens (27, 28). Several studies have used the ALI
method to define EBV infection parameters in polarized epithelia (26, 29, 30). However,
only the organotypic raft culture has undeniably demonstrated that infection of
stratified keratinocytes yields a permissive and productive infection (18, 20). While
those few studies have been recognized as crucial and complementary, these intricate
culture methods have yet to be widely adopted (31–33).
on September 8, 2020 by guest
http://msphere.asm.org/
There are a limited number of authenticated NPC cell lines that continue to harbor
latent EBV in culture (14, 34–36). In the present study, the ALI culture method was
evaluated for induction of the EBV lytic cascade and production of progeny virus in
EBV-infected nasopharyngeal and NPC-derived cell lines that are ordinarily latent in
monolayer culture (37–39). The HK1 cell line, described as having originated from a
differentiated NPC tumor biopsy specimen and infected with a recombinant (Akata)
EBV strain, was amenable to ALI-induced culture conditions (38, 40). Lytic reactivation
was then monitored by assessing lytic gene induction, EBV genome replication, and the
production of infectious progeny virus. The results of this study demonstrate that the
ALI method is proficient at reactivating EBV from the established HK1-EBV cell line,
yielding high titers (~10
6packaged genome equivalents per ALI culture [1.12 cm
2]) that
are secreted and infectious, thus providing an alternative method to interrogate EBV
permissive replication from polarized epithelia in an established NPC-derived cell line
and allowing the elucidation of EBV pathogenesis in nasal epithelia.
RESULTS AND DISCUSSION
Induction of the EBV lytic cascade.
The NPC HK1 cell line is derived from a
squamous carcinoma of the nasopharynx (40). The primary biopsy specimen was too
small for EBV DNA analysis, but the outgrowing HK1 cell line did not show evidence of
EBV infection as determined by staining for EBNA1 or by imaging of virus particles (40).
The HK1-EBV cell line was established by
in vitro
infection of a recombinant EBV
originating from the EBV Akata strain (38). In proliferating monolayer cultures, the
EBV-infected HK1 cell line does not show induction of the lytic cascade and expresses
a type II latency profile characterized by the expression of EBNA1, EBER1/2, LMP1,
LMP2A, LMP2B, and BART transcripts (38). In this cell line, expression of lytic genes can
be induced by the HDAC inhibitor suberoylanilide hydroxamic acid (SAHA) but is
primarily abortive and does not yield progeny virus (16). Epithelial differentiation is a
physiological trigger for EBV reactivation and can be induced by culturing cells at the
air-liquid interface (32). Therefore, the HK1-EBV cell line was tested using the ALI
epithelial cell polarization method for EBV reactivation and the timeline presented in
Fig. 1B. Upon removal of apical media, harvest time points begin 1 day after lifting to
the air-liquid interface (denoted week 0) and at weekly intervals for a total of 3 weeks.
One additional hTERT-immortalized nasopharyngeal cell line (NP460hTERT-EBV) and
ALI culture
Apical
Basolateral
Cells
(cell line or primary cells)
Porous membrane
Growth media
-2
Seed cells on membrane
-1
Remove apical media
week 0 harvest
Confirm no leakage
week 1 harvest week 2 harvest week 3 harvest
!'#$%& ()#$%& !#*+,
ALI culture meline
DNA RNA Protein
Virus
B.
Days
1 3 5 7
A.
FIG 1 (A) Schematic and (B) timeline of the ALI culture model. Epithelial cells (primary or immortalized)
are seeded on a collagen-coated transwell membrane. The polarized cells are fed from the basolateral surface.
on September 8, 2020 by guest
http://msphere.asm.org/
one natively infected NPC cell line (C666-1) were also evaluated (37–39), but only the
HK1-EBV cell line could be maintained under ALI growth conditions and could preserve
an intact epithelium under polarized conditions (data not shown).
To assess the induction of EBV lytic proteins, HK1 uninfected and EBV-infected cell
lysates were harvested at weekly intervals for 3 weeks after lifting to the air-liquid
interface. Lysates were analyzed by immunoblotting for expression of immediate early
protein zebra, early protein EaD, and the late viral capsid antigen (VCA) p18 protein, as
well as the cellular differentiation markers involucrin, keratin 10, and filaggrin (Fig. 2A).
Although the HK1 cell line is described as having originated from a differentiated
squamous carcinoma biopsy, involucrin was not evident in monolayer culture but was
robustly induced in ALI culture, consistent with the hypothesis that the ALI method
triggers terminal differentiation. At early time points, involucrin and keratin 10 levels
were induced as early as day 1, corresponding to induction of the EBV immediate early
switch protein zebra (Fig. 2A). Processed filaggrin levels were not affected and were
weak, requiring long exposures, which may reflect the low abundance and variable
detection in nasal mucosa (41, 42). The induction of involucrin was strongest in
FIG 2 Induction of EBV lytic proteins in HK1-EBV ALI culture. (A) Immunoblot analysis for the expression
of differentiation markers (involucrin, keratin 10, and processed filaggrin) and EBV lytic proteins (zebra, EaD, and VCA p18) in EBV-infected and uninfected ALI-cultured HK1 cell lines. Monolayer HK1 and HK1-EBV cultures with or without TPA/sodium butyrate induction were included for comparison and loaded at 1/10th of total protein lysates. Data for different antibodies are separated by horizontal white lines, and results from the same gel are grouped by a black border. Gels with intervening lanes that were cropped for labeling purposes are indicated by a vertical dotted line. (B) Immunofluorescence staining of HK1 and HK1-EBV cells at week 2 of ALI culture for the EBV lytic antigens zebra, EaD, and gp350 (red). (C) To reflect the frequency of reactivation, three representative fields of view are shown for the gp350 stain of HK1-EBV ALI cultures. For comparison, monolayer cultures were treated with TPA (200 nM) and sodium butyrate (5 mM) for 3 days to induce reactivation. Nuclei were counterstained with DAPI (blue). Scale bar, 50m. Images were acquired on an Olympus Provis epifluorescence microscope.
on September 8, 2020 by guest
http://msphere.asm.org/
EBV-infected HK1 cells compared to uninfected cells, but both the infected and
uninfected cell lines displayed consistent induction of involucrin and keratin 10,
supporting the idea that ALI culture triggers differentiation (Fig. 2A). In comparison to
the undetectable levels in monolayer culture, the EBV zebra, EaD, and VCA p18 proteins
were induced beginning at week 1 to week 2 post-ALI culture (Fig. 2A). Moreover,
chemical induction by treatment with TPA and sodium butyrate in monolayer culture
triggered lytic reactivation but did not result in the production of progeny virus as
determined by the green Raji unit (GRU) assay (Fig. 2A; see also Table S1 in the
supplemental material). Late lytic proteins, particularly glycoproteins, are notoriously
difficult to probe by immunoblotting; therefore, expression of EBV zebra and EaD and
of an additional late glycoprotein, gp350, was also analyzed by immunofluorescence
staining. Nuclear staining of EBV zebra and EaD proteins and the cytoplasmic staining
of gp350 further support the induction of the lytic cascade (Fig. 2B). Cells that stain
positively for gp350 represent cells that have completed induction of the lytic cascade.
Only sporadic cells stained positively for gp350 in monolayer culture when reactivated
with TPA and sodium butyrate (Fig. 2C). However, gp350-positive cells were much more
frequently detected in ALI-cultured cells (~25% to 40%) and were often detected as a
group of cells in focal areas of staining (Fig. 2C). These data support the idea that the
ALI culture method is more efficient at completing induction of the lytic cascade than
chemical reactivation in monolayer culture.
In addition to analysis of protein levels, RNA sequencing (RNA-seq) was performed
to assess the global induction of EBV lytic transcripts. Of the 78 open reading frames
(ORFs) annotated in the NCBI database, 65 were analyzed (Table S2) and 62 were
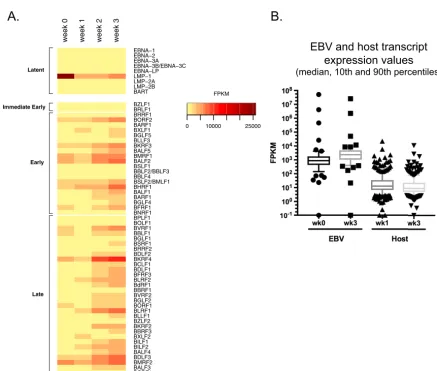
represented as a heat map (Fig. 3A). Three ORFs, EBER1, EBER2, and BNLF2A, had
extremely high numbers of reads and were not represented on the heat map but are
illustrated in Table S2. The lytic genes were globally induced by week 2 to 3 in ALI
culture, except for LMP1, LMP2B, EBER1/2, and BNLF2a, which showed a consistently
decreasing trend overall (Fig. 3A). By comparison, host genes that were differentially
regulated by at least 2-fold did not show an overall increase but a decrease in transcript
levels which likely represented host shutoff (Fig. 3B; see also Table S3).
The majority of EBV transcripts are expressed at up to 10
4fragments per kilobase of
transcript per million mappable reads (FPKM), but the abundant expression of EBERs at
10
6to 10
7FPKM is intriguing (Table S2). EBERs are noncoding nuclear transcripts that
are abundantly expressed in all EBV-associated cancers and latencies, with up to 10
6copies per cell in B-cell infections (43). Therefore, the abundant expression of EBERs is
exploited for the diagnosis of EBV-associated cancers and diseases by EBER
in situ
hybridization (EBER-ISH) (44). One understanding of EBER function is that EBER2 can
serve as a ribonucleoprotein complex to recruit DNA binding proteins to the terminal
repeats on the EBV genome (45). The only disease pathology known to be associated
with permissive replication in epithelial infection is the AIDS-associated nonmalignant
lesion known as OHL that manifests on tongue and gingival tissues (3, 32, 44).
Paradoxically, EBER transcripts are suppressed and sometimes not detected in OHL
formalin-fixed paraffin-embedded tissues, which has called into question the function
of EBERs during EBV reactivation (46, 47). The diagnosis of OHL may require secondary
confirmation by staining for zebra (48). The presence of highly abundant EBER
tran-scripts detected in the ALI culture method is consistent with the recent discovery that
EBER transcripts are also detected by EBER-ISH throughout the layers of the stratified
epithelium in organotypic raft cultures, which would suggest that EBERs are indeed
expressed during EBV reactivation in the differentiated apical layers (20). These findings,
combined with observations from the present study, would seem to imply that the
suppression of EBERs may be unique to OHL.
EBV genome replication and amplification.
EBV genome amplification and
rep-lication were assessed by quantitative PCR (qPCR) and Southern blot analyses.
Encap-sidated genomes from DNase-resistant Hirt-purified extrachromosomal DNA were
mea-sured by qPCR. Total (encapsidated and nonencapsidated) EBV genomes increased
on September 8, 2020 by guest
http://msphere.asm.org/
more than 2 log
10, beginning at 6.1
⫻
10
4EBV genomes per ALI culture at week 0 and
reaching 2.5
⫻
10
7EBV genomes per ALI culture at week 3 (Fig. 4A). The majority of
genomes were encapsidated with less than 1 log
10difference, starting at 1.1
⫻
10
4EBV
genomes per ALI culture at week 0 and reaching 3.0
⫻
10
6EBV genomes per ALI culture
at week 3 (Fig. 4A).
EBV latent genomes are circular and are detected as a single band (
⬎
10 kb) by
Southern blotting (7). Replicating EBV genomes are linear and differ by 500-bp
incre-ments corresponding to the number of tandem terminal repeats (7, 48). At week 0 and
week 1, a single band indicative of latent genomes greater than 10 kb in size was
detected (Fig. 4B). In comparison at weeks 2 and 3, multiple bands smaller than 10 kb
in size were detected with an overall increase in hybridization intensity for all detected
bands, indicative of amplified replicating genomes (Fig. 4B). However, only one band
associated with latent genomes was detected in monolayer culture and there was no
appreciable increase in band intensity, indicating that EBV genomes were not
replicat-ing as efficiently as in ALI culture (Fig. 4B).
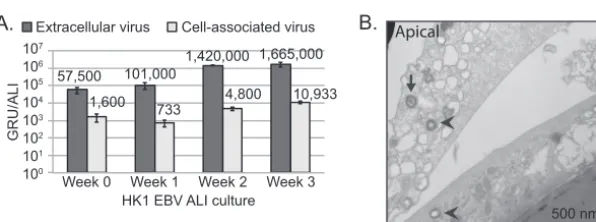
Production of EBV progeny virus.
Production of EBV progeny virus was analyzed
by determining the titers of infectious virus with the GRU assay and by imaging with
transmission electron microscopy (TEM). Raji cells are a Burkitt lymphoma cell line that
EBV and host transcript
expression values
(median, 10th and 90th percentiles)
week 0 week 1 week 2 week 3BCRF1 BALF3 BMRF2 BDLF3 BALF4 BILF2 BILF1 BXLF2 BBRF3 BKRF2 BZLF2 BLLF1 BLRF1 BORF1 BGLF2 BVRF2 BBRF1 BdRF1 BLRF2 BFRF3 BDLF1 BCLF1 BKRF4 BDLF2 BRRF2 BSRF1 BGLF1 BBLF1 BVRF1 BOLF1 BPLF1 BNRF1 BFRF1 BGLF4 BARF1 BALF1 BHRF1 BSLF2/BMLF1 BBLF4 BBLF2/BBLF3 BSLF1 BALF2 BMRF1 BALF5 BKRF3 BLLF3 BGLF5 BXLF1 BARF1 BORF2 BRRF1 BRLF1 BZLF1 BART LMP−2B LMP−2A LMP−1 EBNA−LP EBNA−3B/EBNA−3C EBNA−3A EBNA−2 EBNA−1
0 10000 25000 FPKM Latent
Immediate Early
Early
Late
A.
B.
FIG 3 Induction of EBV lytic transcripts in HK1-EBV ALI culture. (A) RNA-seq profile of EBV latent and lytic transcripts collected from
HK1-EBV cells at week 0 to week 3 of ALI culture. FPKM, fragments per kilobase of transcript per million mappable reads. (B) FPKM values of differentially regulated EBV and host transcripts withⱖ2-fold change in HK1-EBV cells between week 3 and week 0 of ALI culture. Sequence reads were aligned separately to the EBV genome or the human genome and represented as FPKM, which takes into account the total number of mapped reads, and the data can be compared between week 0 and week 3 but cannot be compared between EBV and host values.
on September 8, 2020 by guest
http://msphere.asm.org/
can be readily superinfected with EBV, but the endogenous EBV genome is truncated
and will not replicate, thus enabling the determination of the titers of ALI
culture-derived green fluorescent protein (GFP)-expressing virus (49, 50). Overall titers,
includ-ing extracellular and cell-associated virus titers, increased from week 0 to week 3.
Extracellular virus titers were consistently 2 log
10higher than cell-associated virus titers,
as would be expected from immature cell-associated virions. By week 3, there was a
total value of 1,675,933 GRUs per ALI, demonstrating that abundant and infectious EBV
virions were produced (Fig. 5A). This increase at week 3 was ~30-fold higher than the
values measured at week 0, when production of progeny virus began. In comparison to
the ALI culture results, no infectious units were measured in uninduced HK1-EBV
monolayer-cultured cells (Table S1). Despite the expected loss of sample from Hirt
purification, at week 2 to 3 of ALI culture there were 3.0
⫻
10
6to 4.3
⫻
10
6DNase-resistant encapsidated EBV genomes per ALI culture (1.12 cm
2), which
corre-sponds to 1.425
⫻
10
6to 1.676
⫻
10
6total GRUs per ALI culture (Fig. 4A and 5A). These
EBV BALF5 qPCR
+DNase -DNase
+DNase, mean -DNase, mean
1 2 3 1 2 3 1 2 3 1 2 3 Replica:
Week 0 Week 1 Week 2 Week 3 108
107 106 105 104 103 102 101 100
EBV genome copy
number per
ALI culture
Xho1.9 probe
HK1
HK1 EBV
wk0
wk1
wk2
wk3
wk0
wk1
wk2
wk3
HK1
HK1 EBV
HK1 EBV Z/gB
Monolayer
Latent
Lytic
10.0
6.0
3.0
kb
A.
B.
ALI culture
FIG 4 Measuring EBV genome amplification and replication in HK1-EBV ALI culture. (A) Quantitative PCR measuring EBV genome
equivalents in HK1 ALI-cultured EBV-infected cells. The averaged value was calculated from three biological triplicates, and each biological triplicate value and each error were determined from three technical replicates. Encapsidated genomes are DNase resistant (⫹DNase), and total (encapsidated and nonencapsidated) genomes were determined in the absence of DNase treatment (-DNase). (B) Termini assay of ALI-cultured HK1-EBV cells in comparison to zebra (Z)- and gB-transfected monolayer-cultured cells. Shown is a Southern blot of BamHI-digested genomic DNA hybridized to a random-primed and radiolabeled Xho1.9 fragment DNA probe located on the BamHI-digested fragment leftward of the EBV terminal repeats. Data are displayed from the same blot and exposure time. Intervening lanes were cropped for labeling purposes and are demarcated by a vertical dotted line.
107
106
105
104
103
102
101
100
GRU/ALI
Week 0 Week 1 Week 2 Week 3 57,500
1,600 733 101,000
4,800 1,420,000 1,665,000
10,933 Extracellular virus Cell-associated virus
HK1 EBV ALI culture
B.
500 nm
Basolateral Apical
A.
FIG 5 Production of infectious virus in HK1-EBV ALI culture. (A) Green Raji unit (GRU) titers measuring
numbers of infectious units were determined for extracellular and cell-associated virus from HK1-EBV ALI cultures. Error bars were calculated from four replicate green Raji titers. Analyses of titers from week 2 were repeated in three biological replicates with the following values: 1.15⫻106⫾3.8⫻105GRU/ml
(extracellular) and 4,000⫾949 GRU/ml (cell associated). (B) Transmission electron micrograph (TEM) of HK1-EBV cells at week 2 of ALI culture. Herpesvirus-like particles (~250 nm) were visually identified by an independent microscopist. A packaged mature virion (arrow) and unpackaged immature virions (arrow-head) are illustrated.
on September 8, 2020 by guest
http://msphere.asm.org/
data support the idea that the majority of encapsidated virions produced from ALI
culture are indeed infectious.
HK1-EBV ALI cultures harvested at week 2 were imaged for evidence of EBV virions
by TEM and assessed by an independent microscopist. Although extracellular virions
are largely washed away during TEM processing, intracellular virions can be captured.
The TEM images show an encapsidated herpesvirus-like virion of 200 to 250 nm and
two immature virions in the cytoplasm (Fig. 5B). Additionally, 1 to 2 cells layers were
observed in the TEM images, illustrating that the HK1-EBV ALI cultures were polarized
but not necessarily stratified (Fig. 5B), which is representative of the pseudostratified
differentiated ALI cultures of primary nasal epithelia (24). These data support the idea
that the ALI method is a robust method for inducing fulminant EBV lytic reactivation
without the need for chemical induction. The outcome of this study from an
NPC-derived cell line perhaps appears to contradict the observation of latent infection in
NPC tumors (7). Given that there was no evidence of EBV infection in the original NPC
biopsy specimen from which HK1 cells were derived, it is plausible that the outcome of
infection might differ from that seen with NPC tumor cells that have evolved to sustain
latent infection
in vivo
(40). Despite the paucity of authenticated NPC cell lines, it would
be interesting to test additional NPC cell lines that originate from tumors with
con-firmed EBV positivity (34). Furthermore, since HK1 cells can be recombinantly modified
and stably selected, the HK1-EBV ALI culture model offers the potential to test host and
viral factors which may predispose a neoplastic cell to EBV latent infection (25, 38). The
ALI polarization culture method has been established for primary nasal epithelial cells
(24). Furthermore, EBV infection as defined by the presence of latent or lytic markers is
not detected in nasal biopsy specimens of histologically normal areas, likely reflecting
rare or focal airway epithelial infections in asymptomatic carriers (51, 52). Due to the
absence of detection of EBV infection
in situ
from nasal biopsy specimens of healthy
tissue, in theory it is possible to study
de novo
EBV infection in ALI-cultured primary
nasal epithelial cells. Ultimately, the creation of an EBV infection model and analytical
methods to study (widespread or focal) infection in polarized ALI cultures of primary
nasal epithelial cells would be the most relevant system to evaluate EBV
de novo
infection in mucociliated epithelia (53). Given the limited availability of primary nasal
cells, the ALI culture method described for the HK1-EBV cell line thus offers a widely
accessible alternative for the study of EBV permissive replication in polarized epithelia.
To date, there have been a few exemplar studies that have explored the effect of
EBV proteins on differentiation, or differentiation-induced effects on EBV infection (18,
54–56). These experimental models include calcium-induced differentiation,
suspen-sion of cells in methylcellulose, and organotypic raft cultures (57). Keratinocytes grown
in monolayer can be induced to differentiate by high levels of calcium, which has been
applied to EBV studies by treatment with fetal bovine serum (FBS) and/or by the direct
addition of calcium (18, 21, 56). A second method to differentiate keratinocytes is by
suspending cells in methylcellulose, which has been applied to the study of
EBV-infected cells and of the effect of the EBV latent protein, LMP2A, on differentiation (21,
57). The methylcellulose method can recapitulate differentiation in a three-dimensional
(3D) culture model, but the analysis of these cells in a semisolid matrix is often limited
to protein lysates harvested from the cell population (21, 57). Organotypic rafts provide
single-cell resolution by formalin-fixed paraffin-embedding (FFPE) sectioning and
stain-ing and serve as a robust model for culturstain-ing fully stratified squamous keratinocytes,
but the keratinocyte-enriching media used to establish organotypic rafts may not
culture all NPC cell types (22). In principle, organotypic rafts, originally established for
the study of EBV infection in oral keratinocytes, can also be developed for nasal
keratinocytes (18, 20). The ALI culture method ultimately extends the application of
polarization to other epithelial cell types. When applied to primary cells, ALI culture
preserves the diversity of cell types represented in airway epithelium, including ciliated,
mucosecretory, and basal cells (22). The ALI method described in this study for an NPC
cell line (HK1) permits the analysis of protein expression at the population level but also
with single-cell resolution (Fig. 2), demonstrating that the ALI culture method, as in the
on September 8, 2020 by guest
http://msphere.asm.org/
use of organotypic rafts, is amenable to a variety of molecular virology analytical
techniques, including those involving DNA, RNA, protein, imaging, and the collection of
infectious virus. Therefore, ALI culture is a method complementary to the use of
organotypic rafts that can model EBV infection for the additional cell types represented
in polarized airway epithelium.
MATERIALS AND METHODS
Setup of the ALI culture. The overall setup of the ALI culture for the HK1 cell line has been
previously described (25). Detailed experimental parameters are as follows. A total of 0.5⫻106cells are
seeded on thin-coat collagen-coated polyester membrane transwells (Corning) (0.4m pore size, 12-mm diameter) in 0.5 ml apical medium. Cells are fed from the basolateral surface with 1 ml of media used for the propagation of HK1 cells (RPMI 1640 supplemented with 10% fetal bovine serum). Thin-coat collagen is prepared by diluting 0.1 mg/ml stock of fibrous collagen (IV) from human placenta (Sigma) in water supplemented with 200l glacial acetic acid (100% [vol/vol]), with rocking overnight at 4°C to facilitate solubility. The stock collagen solution is sterile filtered and further diluted 1:10 in 0.1 M Na2CO3to a
working concentration. Collagen stocks can be aliquoted and frozen at⫺20°C, but diluted stocks should be made fresh. For a 12-well plate, 250l of the collagen working stock is used to coat the apical surface of the transwell at 37°C for a minimum of 30 min and up to 1 h. Before the cells are seeded, the collagen solution is aspirated and gently rinsed once with phosphate-buffered saline (PBS). At 1 to 2 days postseeding, a confluent layer should form. The apical medium is removed, and the basolateral medium is replenished. Beginning as early as the next day, a successful ALI culture is established when there is no medium leakage into the apical surface, and that day is noted as day zero. Cells at the ALI are fed twice a week from the basolateral compartment and cultured for up to 3 additional weeks. The uninfected cells should have minimal apical leakage over the 3-week period and should be gently removed at every feeding. The ALI culture of EBV-infected cells increasingly disrupts the monolayer, and apical leakage is expected to increase over the 3-week period, but the integrity of the monolayer should still be apparent by visual inspection with phase microscopy.
Analysis of EBV protein induction by immunoblotting, immunofluorescence, and RNA-seq.The
subsequent procedures are described for a 12-well plate transwell configuration. At weekly intervals, protein lysates were harvested. The basolateral media and apical leakage were removed. Cells were gently rinsed once in PBS and lysed in 50l of radioimmunoprecipitation assay (RIPA) buffer supple-mented with 1 mM phenylmethylsulfonyl fluoride, 2 mM activated sodium orthovanadate, and a 1:100 dilution of protease and phosphate inhibitor cocktails (Sigma). The cells were lysed directly in the transwell by rocking at 4°C for 30 min followed by scraping and were clarified atⱖ20,000⫻gfor 5 min at 4°C. Protein concentration, separation by SDS-PAGE, and immunoblotting was performed as previously described (25). Antibodies for immunoblotting were purchased from Santa Cruz Biotechnologies (EBV zebra clone BZ1; EaD clone 0261; filaggrin clone AKH1; HSC70 clone B-6), Thermo Scientific (EBV VCA p18; keratin 10 clone Ab-2), and Sigma (involucrin clone SY5).
For immunofluorescence staining, cells were fixed in 4% paraformaldehyde at room temperature and punched out of the transwell with the lid of a cryovial (or by the use of the top end of a P1000 tip cut to the size of the transwell). The use of a scalpel is not recommended since this can wrinkle the membrane and create an uneven surface for imaging. Cells were permeabilized with 0.1% Triton X-100 –PBS for 5 min and washed in wash buffer (0.05% Tween 20 –PBS) followed by blocking with 1% bovine serum albumin–PBS for 1 h at room temperature. Cells were probed with primary antibody diluted in blocking buffer and incubated overnight at 4°C in a humidified chamber. Following three rinses in wash buffer, cells were incubated with secondary antibody diluted in PBS for 1 h at room temperature. For EBV zebra (clone BZ1), EaD (clone 0261), and gp350 (clone 0221) stains, all primary antibodies (Santa Cruz Biotechnology) were diluted 1:100. EBV zebra and EaD were detected with Cy3-conjugated donkey anti-mouse IgG secondary antibody (Jackson ImmunoResearch) at 3.75g/ml. EBV gp350 was detected with biotin-conjugated donkey anti-mouse IgG diluted at 3 g/ml and rhodamine red-conjugated streptavidin at 0.78g/ml (Jackson ImmunoResearch). Cells were counter-stained in DAPI (4=,6-diamidino-2-phenylindole) and mounted in aqueous mounting media. Epifluores-cence images were acquired on an Olympus Provis microscope with Q-Capture software. All images were adjusted for equal levels of intensity and brightness.
Total RNA was isolated using Trizol (Invitrogen) from HK1-EBV cells after induction of the lytic cycle at the indicated time points (week 0, week 1, week 2, and week 3). Briefly, cells were lysed in 1 ml of Trizol, purified with chloroform, precipitated with isopropanol followed by two washes of 75% ethanol, and resuspended in water. DNase-treated RNA (Turbo DNA-free kit; Ambion) was submitted to the Health Sciences Sequencing Core at the Children’s Hospital of Pittsburgh for quality assurance/quality control (QA/QC) analysis and quantitation on an Agilent TapeStation and Qubit. rRNA is susceptible to degra-dation during EBV reactivation; therefore, the expected RNA integrity number (RIN) can range from 2.4 to 5.5, with an expected total RNA yield in the range of 0.2 to 7g per ALI culture sample, decreasing as reactivation progresses. A more accurate measure of transcript integrity should be determined by the percentage of nucleotide fragments larger than 200 bp or by Northern blotting for intact EBV transcripts such as the abundant nonpolyadenylated EBERs.
Following QA/QC analysis, DNase-treated RNA samples were subjected to rRNA depletion using a Ribo-Zero Epidemiology kit (Illumina) and were converted into a deep sequencing library using Illumina’s Truseq stranded total RNA kit. Deep sequencing was performed on a NextSeq500 platform using a Mid-output kit and a 2⫻75-cycle paired-end run. We obtained 47.1, 49.4, 46.9, and 47.7 million reads
on September 8, 2020 by guest
http://msphere.asm.org/
for samples at week 0, week 1, week 2, and week 3, respectively. Sequence reads were trimmed by 10 nucleotides based on read quality and subsequently aligned to the EBV Akata genome (GenBank accession numberKC207813.1) or to human reference genome hg38 using TopHat2 (58) and the options “—no-novel-juncs -r 300 —library-type fr-firststrand.” Among the total reads, 0.4%, 0.2%, 0.8%, and 0.8% aligned to the EBV genome for sample week 0, week 1, week 2, and week 3, respectively; the alignment rates for hg38 were 82.7%, 84.1%, 80.0%, and 82.2%, respectively.
To generate a heat map of EBV transcript abundance, Cufflinks (59) was used to calculate FPKM values of EBV genes, which were then applied to the heatmap.2 tool in the gplots package (60). For analyzing differential host gene expression, the algorithm CuffDiff2 (61) was used to compare week 0 transcriptomes and week 3 transcriptomes with the options “—library-type fr-firststrand— compatible-hits-norm—max-bundle-frags 1000000000000.” Table S3 in the supplemental material includes data from host genes that exhibited a 2-fold change between the week 0 and week 3 samples.
Analysis of EBV DNA genome replication by qPCR and Southern blotting.Cells were harvested
by scraping in 100l of PBS followed by three cycles of rapid freezing-thawing to release virions. Cellular debris was pelleted at ⱖ20,000⫻ g for 5 min, and the supernatant was harvested and split for subsequent experiments performed with or without DNase treatment. Half of the sample was treated with a Turbo DNA-free kit (Ambion) to isolate encapsidated genomes. Both the samples subjected to DNase treatment and those left untreated were subjected to Hirt purification for isolation of extrachro-mosomal EBV genomes (22). For every 25-l sample, 415l Hirt buffer, 5l of 20 mg/ml proteinase K, and 25l of 10% SDS were added and incubated for 2 h at 37°C. This was followed by phenol-chloroform extraction (470l phenol-chloroform-isoamyl alcohol [25:24:1]) and separation into the aqueous phase by spinning atⱖ20,000⫻gfor 10 min, followed by washing the aqueous layer with 470l of chloroform and collecting the aqueous layer by spinning atⱖ20,000⫻gfor 10 min. DNA was precipitated with 0.1⫻ 3 M sodium acetate and 2.5⫻100% ethanol and was incubated overnight at⫺20°C. To pellet DNA, samples were spun atⱖ20,000⫻gfor 10 min at 4°C, washed with 300l 70% ethanol, and pelleted again atⱖ20,000⫻gfor 10 min at 4°C. The DNA pellet was air dried and resuspended in 12.5l of water. Of note, it would also be possible to perform the qPCR procedure using column-purified total genomic DNA and normalization to a cellular target but the procedure would need to be empirically optimized for sensitivity and template quantity.
For qPCR, 2l of the Hirt-purified DNA was analyzed by the Sybr green absolute quantitation method. A standard curve was generated with 100to 109copies per reaction using a BALF5 plasmid
(7,782 bp) as the template (62). Reaction mixtures were assembled with a Maxima SYBR green qPCR master mix kit (Thermo Scientific) with 0.3M of each primer, using recommended cycle conditions with ROX as a passive reference dye in a total reaction volume of 10l. Primer sequences are as follows: for qBALF5-F, 5=GAGCGATCTTGGCAATCTCT 3=; for qBALF5-R, 5=TGGTCATGGATCTGCTAAACC 3=. Reactions were amplified on a StepOnePlus instrument (Applied Biosystems) and analyzed with StepOne software (v2.3). Average values and standard deviations were calculated from triplicate technical replicas and three independent experiments. Water and uninfected HK1 ALI culture cells from corresponding weeks were used as negative controls. End values were represented as BALF5 copy number per ALI culture.
For Southern blotting, total genomic DNA was harvested from Trizol-lysed cells or could also be harvested by column purification (GeneJET genomic DNA purification kit with RNase treatment; Thermo Scientific). Total DNA was isolated from the nonaqueous phase according to manufacturer’s instructions (Invitrogen). The DNA harvested from each ALI culture was digested with BamHI, ethanol precipitated in the presence of 5 to 10g of glycogen, and loaded on an agarose gel. A linearized Xho1a (1.9-kb) probe was generated by random-prime synthesis, radiolabeled, and hybridized as previously described (63).
Measuring EBV titers.Residual media on the apical side were collected. Intracellular and
extracel-lular virus was harvested by scraping cells in 100l of RPMI media followed by an additional 50-l rinse and was collected to reach a total volume of 200l. The sample was clarified by spinning at 500⫻gfor 5 min, and the supernatant was collected and stored at 4°C as extracellular virus. The cell pellet was resuspended in 200l of RPMI media followed by three cycles of rapid freezing-thawing to release intracellular virus. Disrupted cells were spun down at 500⫻ gfor 5 min, and the supernatant was collected and stored at 4°C as cell-associated virus.
Infectious titer was determined by the green Raji Unit (GRU) assay (50). In a 96-well plate, 90l of RPMI medium was added to 10l of virus stock and titrated in 10-fold serial dilutions (100to 109). Ten
thousand Raji cells in 10 l media were added to each well and, after a 48-h inoculation period, reactivated with 200 nM TPA and 5 mM sodium butyrate overnight. A fluorescence microscope was used to count the number of GFP-positive cells in each well to determine the number of GRU per milliliter.
TEM.HK1 and HK1-EBV ALI cultures harvested at week 2 were fixed in cold 2.5% glutaraldehyde– 0.01 M PBS. Specimens were rinsed in PBS, postfixed in 1% osmium tetroxide with 1% potassium ferricyanide, rinsed in PBS, dehydrated through a graded ethanol series, and embedded in Poly/Bed 812 (Luft formulations). Semithin (300-nm-thick) sections were cut on a Leica Reichart Ultracut ultrami-crotome, stained with 0.5% toluidine blue–1% sodium borate, and examined under the light microscope. Ultrathin sections (65 nm thick) were stained with uranyl acetate and Reynold’s lead citrate and examined on a JEOL 1011 transmission electron microscope with a side-mount AMT 2-k digital camera (Advanced Microscopy Techniques).
SUPPLEMENTAL MATERIAL
Supplemental material for this article may be found at
https://doi.org/10.1128/
mSphere.00152-18
.
TABLE S1,
DOCX file, 0.01 MB.
on September 8, 2020 by guest
http://msphere.asm.org/
TABLE S2,
XLSX file, 0.05 MB.
TABLE S3,
XLSX file, 0.03 MB.
ACKNOWLEDGMENTS
We thank Mara Sullivan at the Center for Biologic Imaging, University of Pittsburgh,
for providing the transmission electron micrograph. We thank George Tsao (University
of Hong Kong) for providing the HK1 and HK1-EBV cells.
This work was supported by the Hillman Foundation and by National Institutes of
Health (NIH) Cancer Center support grant P30 CA047904 (AIDS Supplement Pilot
Award) (to K.H.Y.S.).
E.A.C., S.A.C., N.L., and D.S. conducted the experiments. E.A.C., K.H.Y.S., N.L., and S.W.
designed the experiments. All of us contributed to the interpretation of the results and
writing of the manuscript.
REFERENCES
1. Young LS, Rickinson AB. 2004. Epstein-Barr virus: 40 years on. Nat Rev Cancer 4:757–768.https://doi.org/10.1038/nrc1452.
2. Shannon-Lowe C, Rickinson AB, Bell AI. 2017. Epstein-Barr virus-associated lymphomas. Philos Trans R Soc Lond B Biol Sci 372:20160271. https://doi.org/10.1098/rstb.2016.0271.
3. Raab-Traub N, Webster-Cyriaque J. 1997. Epstein-Barr virus infection and expression in oral lesions. Oral Dis 3(Suppl 1):S164 –S170.https://doi.org/ 10.1111/j.1601-0825.1997.tb00352.x.
4. Young LS, Murray PG. 2003. Epstein-Barr virus and oncogenesis: from latent genes to tumours. Oncogene 22:5108 –5121.https://doi.org/10 .1038/sj.onc.1206556.
5. Raab-Traub N. 2015. Nasopharyngeal carcinoma: an evolving role for the Epstein-Barr virus. Curr Top Microbiol Immunol 390:339 –363.https://doi .org/10.1007/978-3-319-22822-8_14.
6. Swaminathan S, Kenney S. 2009. The Epstein–Barr virus lytic life cycle, p 285–315.InDamania B, Pipas JM (ed), DNA tumor viruses. Springer Science⫹Business Media, New York, NY.https://doi.org/10.1007/978-0 -387-68945-6.
7. Raab-Traub N, Flynn K. 1986. The structure of the termini of the Epstein-Barr virus as a marker of clonal cellular proliferation. Cell 47:883– 889. https://doi.org/10.1016/0092-8674(86)90803-2.
8. Raab-Traub N. 2012. Novel mechanisms of EBV-induced oncogenesis. Curr Opin Virol 2:453– 458.https://doi.org/10.1016/j.coviro.2012.07.001. 9. Dawson CW, Port RJ, Young LS. 2012. The role of the EBV-encoded latent membrane proteins LMP1 and LMP2 in the pathogenesis of nasopha-ryngeal carcinoma (NPC). Semin Cancer Biol 22:144 –153.https://doi.org/ 10.1016/j.semcancer.2012.01.004.
10. Shair KH, Schnegg CI, Raab-Traub N. 2008. EBV latent membrane protein 1 effects on plakoglobin, cell growth, and migration. Cancer Res 68: 6997–7005.https://doi.org/10.1158/0008-5472.CAN-08-1178.
11. Wang D, Liebowitz D, Kieff E. 1985. An EBV membrane protein expressed in immortalized lymphocytes transforms established rodent cells. Cell 43:831– 840.https://doi.org/10.1016/0092-8674(85)90256-9.
12. Mainou BA, Everly DN, Jr, Raab-Traub N. 2005. Epstein-Barr virus latent membrane protein 1 CTAR1 mediates rodent and human fibroblast transformation through activation of PI3K. Oncogene 24:6917– 6924. https://doi.org/10.1038/sj.onc.1208846.
13. Tsao SW, Tsang CM, Lo KW. 2017. Epstein-Barr virus infection and nasopharyngeal carcinoma. Philos Trans R Soc Lond B Biol Sci 372: 20160270.https://doi.org/10.1098/rstb.2016.0270.
14. Tsao SW, Tsang CM, Pang PS, Zhang G, Chen H, Lo KW. 2012. The biology of EBV infection in human epithelial cells. Semin Cancer Biol 22:137–143. https://doi.org/10.1016/j.semcancer.2012.02.004.
15. Tsao SW, Tsang CM, To KF, Lo KW. 2015. The role of Epstein-Barr virus in epithelial malignancies. J Pathol 235:323–333.https://doi.org/10.1002/ path.4448.
16. Hui KF, Ho DN, Tsang CM, Middeldorp JM, Tsao GS, Chiang AK. 2012. Activation of lytic cycle of Epstein-Barr virus by suberoylanilide hy-droxamic acid leads to apoptosis and tumor growth suppression of nasopharyngeal carcinoma. Int J Cancer 131:1930 –1940.https://doi.org/ 10.1002/ijc.27439.
17. Feederle R, Bartlett EJ, Delecluse HJ. 2010. Epstein-Barr virus genetics:
talking about the BAC generation. Herpesviridae 1:6.https://doi.org/10 .1186/2042-4280-1-6.
18. Nawandar DM, Wang A, Makielski K, Lee D, Ma S, Barlow E, Reusch J, Jiang R, Wille CK, Greenspan D, Greenspan JS, Mertz JE, Hutt-Fletcher L, Johannsen EC, Lambert PF, Kenney SC. 2015. Differentiation-dependent KLF4 expression promotes lytic Epstein-Barr virus infection in epithelial cells. PLoS Pathog 11:e1005195. https://doi.org/10.1371/journal.ppat .1005195.
19. Kenney SC, Mertz JE. 2014. Regulation of the latent-lytic switch in Epstein-Barr virus. Semin Cancer Biol 26:60 – 68.https://doi.org/10.1016/ j.semcancer.2014.01.002.
20. Temple RM, Zhu J, Budgeon L, Christensen ND, Meyers C, Sample CE. 2014. Efficient replication of Epstein-Barr virus in stratified epithelium in vitro. Proc Natl Acad Sci U S A 111:16544 –16549.https://doi.org/10 .1073/pnas.1400818111.
21. Nawandar DM, Ohashi M, Djavadian R, Barlow E, Makielski K, Ali A, Lee D, Lambert PF, Johannsen E, Kenney SC. 29 March 2017. Differentiation-dependent LMP1 expression is required for efficient lytic Epstein-Barr virus reactivation in epithelial cells. J Virolhttps://doi.org/10.1128/JVI .02438-16.
22. Temple RM, Meyers C, Sample CE. 2017. Generation and infection of organotypic cultures with Epstein-Barr virus. Methods Mol Biol 1532: 65–78.https://doi.org/10.1007/978-1-4939-6655-4_4.
23. Fulcher ML, Gabriel S, Burns KA, Yankaskas JR, Randell SH. 2005. Well-differentiated human airway epithelial cell cultures. Methods Mol Med 107:183–206.
24. Müller L, Brighton LE, Carson JL, Fischer WA, II, Jaspers I. 2013. Culturing of human nasal epithelial cells at the air liquid interface. J Vis Exp. https://doi.org/10.3791/50646.
25. Caves EA, Butch RM, Cook SA, Wasil LR, Chen C, Di YP, Lee N, Shair KHY. 2017. Latent membrane protein 1 is a novel determinant of Epstein-Barr virus genome persistence and reactivation. mSphere 2:e00453-17. https://doi.org/10.1128/mSphereDirect.00453-17.
26. Tugizov SM, Berline JW, Palefsky JM. 2003. Epstein-Barr virus infection of polarized tongue and nasopharyngeal epithelial cells. Nat Med 9:307–314.https://doi.org/10.1038/nm830.
27. Hendricks MR, Lashua LP, Fischer DK, Flitter BA, Eichinger KM, Durbin JE, Sarkar SN, Coyne CB, Empey KM, Bomberger JM. 2016. Respiratory syncytial virus infection enhances Pseudomonas aeruginosa biofilm growth through dysregulation of nutritional immunity. Proc Natl Acad Sci U S A 113:1642–1647.https://doi.org/10.1073/pnas.1516979113. 28. S Banach B, Orenstein JM, Fox LM, Randell SH, Rowley AH, Baker SC.
2009. Human airway epithelial cell culture to identify new respiratory viruses: coronavirus NL63 as a model. J Virol Methods 156:19 –26.https:// doi.org/10.1016/j.jviromet.2008.10.022.
29. Tugizov SM, Herrera R, Palefsky JM. 2013. Epstein-Barr virus transcytosis through polarized oral epithelial cells. J Virol 87:8179 – 8194.https://doi .org/10.1128/JVI.00443-13.
30. Shannon-Lowe C, Rowe M. 2011. Epstein-Barr virus infection of polarized epithelial cells via the basolateral surface by memory B cell-mediated transfer infection. PLoS Pathog 7:e1001338. https://doi.org/10.1371/ journal.ppat.1001338.
31. Hutt-Fletcher LM. 2014. Epstein-Barr virus replicating in epithelial cells.
on September 8, 2020 by guest
http://msphere.asm.org/
Proc Natl Acad Sci U S A 111:16242–16243.https://doi.org/10.1073/pnas .1418974111.
32. Hutt-Fletcher LM. 19 October 2017. The long and complicated relation-ship between Epstein-Barr virus and epithelial cells. J Virolhttps://doi .org/10.1128/JVI.01677-16.
33. Shair KHY, Reddy A, Cooper VS. 2018. New insights from elucidating the role of LMP1 in nasopharyngeal carcinoma. Cancers 10:86.https://doi .org/10.3390/cancers10040086.
34. Chan SY, Choy KW, Tsao SW, Tao Q, Tang T, Chung GT, Lo KW. 2008. Authentication of nasopharyngeal carcinoma tumor lines. Int J Cancer 122:2169 –2171.https://doi.org/10.1002/ijc.23374.
35. Strong MJ, Baddoo M, Nanbo A, Xu M, Puetter A, Lin Z. 2014. Compre-hensive high-throughput RNA sequencing analysis reveals contamina-tion of multiple nasopharyngeal carcinoma cell lines with HeLa cell genomes. J Virol 88:10696 –10704.https://doi.org/10.1128/JVI.01457-14. 36. Dittmer DP, Hilscher CJ, Gulley ML, Yang EV, Chen M, Glaser R. 2008. Multiple pathways for Epstein-Barr virus episome loss from nasopharyn-geal carcinoma. Int J Cancer 123:2105–2112.https://doi.org/10.1002/ijc .23685.
37. Tsang CM, Zhang G, Seto E, Takada K, Deng W, Yip YL, Man C, Hau PM, Chen H, Cao Y, Lo KW, Middeldorp JM, Cheung AL, Tsao SW. 2010. Epstein-Barr virus infection in immortalized nasopharyngeal epithelial cells: regulation of infection and phenotypic characterization. Int J Can-cer 127:1570 –1583.https://doi.org/10.1002/ijc.25173.
38. Lo AK, Lo KW, Tsao SW, Wong HL, Hui JW, To KF, Hayward DS, Chui YL, Lau YL, Takada K, Huang DP. 2006. Epstein-Barr virus infection alters cellular signal cascades in human nasopharyngeal epithelial cells. Neo-plasia 8:173–180.https://doi.org/10.1593/neo.05625.
39. Cheung ST, Huang DP, Hui AB, Lo KW, Ko CW, Tsang YS, Wong N, Whitney BM, Lee JC. 1999. Nasopharyngeal carcinoma cell line (C666-1) consistently harbouring Epstein-Barr virus. Int J Cancer 83:121–126. https://doi.org/10.1002/(SICI)1097-0215(19990924)83:1⬍ 121::AID-IJC21⬎3.0.CO;2-F.
40. Huang DP, Ho JH, Poon YF, Chew EC, Saw D, Lui M, Li CL, Mak LS, Lai SH, Lau WH. 1980. Establishment of a cell line (NPC/HK1) from a differenti-ated squamous carcinoma of the nasopharynx. Int J Cancer 26:127–132. https://doi.org/10.1002/ijc.2910260202.
41. De Benedetto A, Qualia CM, Baroody FM, Beck LA. 2008. Filaggrin expression in oral, nasal, and esophageal mucosa. J Invest Dermatol 128:1594 –1597.https://doi.org/10.1038/sj.jid.5701208.
42. Miwa M, Hasan S, Miwa M, Okubo K. 2016. Filaggrin exists in human nose. Allergol Int 65:338 –340.https://doi.org/10.1016/j.alit.2016.01.007. 43. Damania B, Pipas JM (ed). 2009. DNA tumor viruses. Springer Science⫹ Business Media, New York.https://doi.org/10.1007/978-0-387-68945-6. 44. Gulley ML, Tang W. 2008. Laboratory assays for Epstein-Barr virus-related
disease. J Mol Diagn 10:279 –292.https://doi.org/10.2353/jmoldx.2008 .080023.
45. Lee N, Yario TA, Gao JS, Steitz JA. 2016. EBV noncoding RNA EBER2 interacts with host RNA-binding proteins to regulate viral gene expres-sion. Proc Natl Acad Sci U S A 113:3221–3226.https://doi.org/10.1073/ pnas.1601773113.
46. Gilligan K, Rajadurai P, Resnick L, Raab-Traub N. 1990. Epstein-Barr virus small nuclear RNAs are not expressed in permissively infected cells in AIDS-associated leukoplakia. Proc Natl Acad Sci U S A 87:8790 – 8794. https://doi.org/10.1073/pnas.87.22.8790.
47. Niedobitek G, Young LS, Lau R, Brooks L, Greenspan D, Greenspan JS, Rickinson AB. 1991. Epstein-Barr virus infection in oral hairy leukoplakia: virus replication in the absence of a detectable latent phase. J Gen Virol 72:3035–3046.https://doi.org/10.1099/0022-1317-72-12-3035. 48. Gulley ML. 2001. Molecular diagnosis of Epstein-Barr virus-related
diseases. J Mol Diagn 3:1–10.https://doi.org/10.1016/S1525-1578(10) 60642-3.
49. Polack A, Delius H, Zimber U, Bornkamm GW. 1984. Two deletions in the Epstein-Barr virus genome of the Burkitt lymphoma nonproducer line Raji. Virology 133:146 –157.https://doi.org/10.1016/0042-6822(84)90433-1. 50. Delecluse HJ, Hilsendegen T, Pich D, Zeidler R, Hammerschmidt W. 1998.
Propagation and recovery of intact, infectious Epstein-Barr virus from prokaryotic to human cells. Proc Natl Acad Sci U S A 95:8245– 8250. https://doi.org/10.1073/pnas.95.14.8245.
51. Pathmanathan R, Prasad U, Sadler R, Flynn K, Raab-Traub N. 1995. Clonal proliferations of cells infected with Epstein-Barr virus in preinvasive lesions related to nasopharyngeal carcinoma. N Engl J Med 333: 693– 698.https://doi.org/10.1056/NEJM199509143331103.
52. Sam CK, Brooks LA, Niedobitek G, Young LS, Prasad U, Rickinson AB. 1993. Analysis of Epstein-Barr virus infection in nasopharyngeal biopsies from a group at high risk of nasopharyngeal carcinoma. Int J Cancer 53:957–962.https://doi.org/10.1002/ijc.2910530616.
53. Shair KHY, Reddy A, Cooper VS. 21 March 2018. New insights from elucidating the role of LMP1 in nasopharyngeal carcinoma. Cancers https://doi.org/10.3390/cancers10040086.
54. Dawson CW, Rickinson AB, Young LS. 1990. Epstein-Barr virus latent membrane protein inhibits human epithelial cell differentiation. Nature 344:777–780.https://doi.org/10.1038/344777a0.
55. Scholle F, Bendt KM, Raab-Traub N. 2000. Epstein-Barr virus LMP2A transforms epithelial cells, inhibits cell differentiation, and activates Akt. J Virol 74:10681–10689. https://doi.org/10.1128/JVI.74.22.10681-10689 .2000.
56. Birdwell CE, Queen KJ, Kilgore PC, Rollyson P, Trutschl M, Cvek U, Scott RS. 2014. Genome-wide DNA methylation as an epigenetic consequence of Epstein-Barr virus infection of immortalized keratinocytes. J Virol 88:11442–11458.https://doi.org/10.1128/JVI.00972-14.
57. Morrison JA, Raab-Traub N. 2005. Roles of the ITAM and PY motifs of Epstein-Barr virus latent membrane protein 2A in the inhibition of epithelial cell differentiation and activation of {beta}-catenin signaling. J Virol 79:2375–2382.https://doi.org/10.1128/JVI.79.4.2375-2382.2005. 58. Trapnell C, Pachter L, Salzberg SL. 2009. TopHat: discovering splice
junctions with RNA-Seq. Bioinformatics 25:1105–1111.https://doi.org/10 .1093/bioinformatics/btp120.
59. Trapnell C, Williams BA, Pertea G, Mortazavi A, Kwan G, van Baren MJ, Salzberg SL, Wold BJ, Pachter L. 2010. Transcript assembly and quanti-fication by RNA-Seq reveals unannotated transcripts and isoform switch-ing durswitch-ing cell differentiation. Nat Biotechnol 28:511–515.https://doi .org/10.1038/nbt.1621.
60. Warnes GR, Bolker B, Bonebbaker L, Gentleman R, Huber W, Liaw A, Lumley T, Maechler M, Magnusson A, Moeller S, Schwartz M, Venables B. 2016. Gplots: various R programming tools for plotting data. R package version 3.0.1.https://CRAN.R-project.org/package⫽gplots.
61. Trapnell C, Hendrickson DG, Sauvageau M, Goff L, Rinn JL, Pachter L. 2013. Differential analysis of gene regulation at transcript resolution with RNA-seq. Nat Biotechnol 31:46 –53. https://doi.org/10.1038/nbt .2450.
62. Goswami R, Shair KHY, Gershburg E. 2017. Molecular diversity of IgG responses to Epstein-Barr virus proteins in asymptomatic Epstein-Barr virus carriers. J Gen Virol 98:2343–2350.https://doi.org/10.1099/jgv.0 .000891.
63. Gulley ML, Raphael M, Lutz CT, Ross DW, Raab-Traub N. 1992. Epstein-Barr virus integration in human lymphomas and lymphoid cell lines. Cancer 70:185–191. https://doi.org/10.1002/1097-0142(19920701)70:1
⬍185::AID-CNCR2820700129⬎3.0.CO;2-J.
on September 8, 2020 by guest
http://msphere.asm.org/
Erratum for Caves et al., “Air-Liquid Interface Method To
Study Epstein-Barr Virus Pathogenesis in Nasopharyngeal
Epithelial Cells”
Elizabeth A. Caves,
aSarah A. Cook,
aNara Lee,
bDonna Stoltz,
cSimon Watkins,
cKathy H. Y. Shair
a,baCancer Virology Program, UPMC Hillman Cancer Center, University of Pittsburgh, Pittsburgh, Pennsylvania, USA
bDepartment of Microbiology and Molecular Genetics, University of Pittsburgh, Pittsburgh, Pennsylvania, USA
cDepartment of Cell Biology, University of Pittsburgh, Pittsburgh, Pennsylvania, USA
Volume 3, no. 4, e00152-18, 2018,
https://doi.org/10.1128/mSphere.00152-18
. In
Fig. 3B, one of the series for the FPKM values in the host transcriptome was mislabeled
week 1 (wk1); it should instead be week 0 (wk0). The corrected graph is shown below.
CitationCaves EA, Cook SA, Lee N, Stoltz D, Watkins S, Shair KHY. 2019. Erratum for Caves et al., “Air-liquid interface method to study Epstein-Barr virus pathogenesis in nasopharyngeal epithelial cells.” mSphere 4: e00247-19.https://doi.org/10.1128/mSphere .00247-19.
Copyright© 2019 Caves et al. This is an open-access article distributed under the terms of theCreative Commons Attribution 4.0 International license.
Published17 April 2019
FIG 3B