http://www.gjaets.com © Global Journal of Advance Engineering Technology and Sciences 24
Global Journal of Advanced Engineering Technologies and Sciences
EVOLUTION OF NEW DAMAGE CRITERION FOR ESTIMATING
BLAST INDUCED DAMAGE ON UNDERGROUND MINE STRUCTURES
DUE TO SURFACE BLASTING CARRIED IN NEIGHBORING MINES
Ajay Kumar Jha *
1*1Professor, Deptt. Of Mining Engineering, Indian Institute of Technology, Kharagpur.
Abstract
There exist numerous mine sites in India where surface blasting is carried out in close vicinity of underground coal mines, which has a potential risk of damage to the underground mine structures and persons deployed underground. In coming years, there will be more number of mine sites where surface mines will be limited up to depth of 300 m to economise in terms of handling overburden/waste due to high stripping ratio, environmental conditions imposed by regulatory agencies and unviable cost of production. This paper deals with an Indian case study where blast induced damage was estimated on roof of the underground structures due to blasting carried at neighbouring surface mine. A new approach is proposed to classify damage of underground structures due to surface blasting using the concept of “Blast Damage Factor (BDF)” and linear discriminant functions. BDF is defined in terms of induced stress, damage resistance, together termed as Strength Factor, and another dimensionless indicator of damage as Mining Factor. The damage types are classified into three groups as "Severe, Moderate and No damage". It was inferred from data analysis that the threshold site specific values of BDF for Severe damage was arrived as BDF≥3.85, Moderate damage as 1.79≤BDF<3.85 and No damage as BDF<1.79. The BDF, when converted to peak particle velocity corresponds to PPV ≥ 51 mm/s in respect of Severe damage, 24 mm/s ≤ PPV<51 mm/s in respect of Moderate damage and PPV < 24 mm/s in respect of No damage. Site-specific charts between charge weight and distance have been developed so that estimation of damage type due to impact of surface blasting on neighbouring underground mine may be carried out easily by practising blasting engineer.
Keywords:Surface blasting, Damage types, Blast damage factor, Peak particle velocity.
Introduction
http://www.gjaets.com © Global Journal of Advance Engineering Technology and Sciences 25
peak vibration (acceleration and velocity) caused by surface blasting is lower at an underground location compared to a surface point at the same SD. It was proposed that PPV relates to one-third power of charge per delay Q1/3 for underground locations.
In this study, vibration has been monitored at different locations in roofs, pillars and floors in an underground coal mine, while blasting was conducted at nearby surface coal mine benches. The blast induced vibration data were generated under a Science &Technology project sponsored by Ministry of Coal, Govt. of India with Central Mine Planning and Design Institute (CMPDI) as the nodal agency and Central Institute of Mining and Fuel Research (CIMFR) and CMPDI as implementing agencies. Peak particle velocities in the underground coal mine roofs, pillars and floors were monitored using geophones. Surface blasting and underground monitoring were synchronized so that the measured vibrations were only due to surface blasting. The monitored data were analysed using statistical techniques, and a new predictor equation of PPV based on distance R and explosive quantity per delay Q was developed. It was found that the power of charge per delay varies with local geological conditions in the best fit model. However, on average, 0.33 power of charge per delay provides a reasonably good estimate of PPVs measured in underground locations if the parting (transmitting) medium is composed of one or two rock strata.
On the other hand, due to repeated surface blasting, underground structures may also experience loading and unloading phenomena which may be detrimental to the stability of UG structures. As a result, surface mine management may force to restrict the maximum explosive charge per delay leading to planning and carrying out smaller size surface blasts in adjacent surface mines to control the blast vibration in underground within a certain threshold limits. This sub-optimal blasting operation has led to various downstream problems affecting the productivity and economics of the mining activity. Hence, there is an urgent need to understand and determine the threshold PPV up to which underground structures would be safe and can tolerate the blast induced vibration without any significant damage. This paper also elaborates on the development of “Blast Damage Factor (BDF)”, based on classification of damage using estimated PPVs, rock mass parameters, pillar and room dimensions, for underground workings arising out of surface blasts carried out in adjacent surface mines (Jha, 2010). These threshold limits are determined for both the underground mines so that safe and economic surface blasts can be planned without any significant damage potential to underground workings.
Mine Site Description
Blast vibration measurements were collected from Samleshwari OCM and Hingir Rampur UG mine operated by Mahanadi Coalfields Ltd., a subsidiary of Coal India Ltd. Figure 1 depicts a schematic view of typical vertical geological sections of the mine site. The case study mine is located in the IB valley coalfield area, which is a part of the large synclinal Gondwana basin of Raigarh-Hingir and Chattisgarh coalfields (Mahanadi valley). The Barakar and Karharbari formations are the major coal bearing formations. The area is generally free from major faults. In case study mine site, the Lajkura seam was excavated on the surface, and the HR seam IV was mined underground using Bord and Pillar mining. The average vertical distance between these seams was about 100-120 m. The inter seam rock layers are mainly composed of sandstone and shaly sandstone. Table 1 lists a brief description of the underground mines and related geotechnical parameters.
Method Of Mining
http://www.gjaets.com © Global Journal of Advance Engineering Technology and Sciences 26
Table 1: Description of underground mine and related geotechnical parameters
Particulars Case Study
Mine site
Name of the seam HR - IV Seam
Pillar size (corner to corner) (m) 29 x 29
Gallery width (m) 4.6
Gallery Height (m) 2.6
RQD (roof) 50.4
GSI (roof) 50.4
Support system Roof bolting, props and cross bars
Average rock density (t/m3) 1.84
Weighted P wave velocity(m/s) 2250
Rock layers in between surface and underground mines
Shaly coal
Carbonaceous shale Lajkura coal seam Coarse
grainedsandstoneand shaly sandstone
Weighted UCS (MPa) 24.6
Dynamic tensile strength(MPa) 6.83
Immediate roof layer up to 2.0m 2.0 m - Shale
The annual average production from Samleshwari OCM was 3 Mt with an average stripping ratio of 1.52 m3/t. The thickness of the Lajkura coal seam varied between 16 and 25 m and this seam and overburden were removed by shovel and dumper combinations. In the HR colliery, the HR seam IV had been worked by the conventional Bord and Pillar method. Figure 1 depicts the HR colliery overlaid by the Samleshwari OCM. The SamleshwariOCM was started long after the underground mine was in operation.
Figure 1. Typical layout of rock strata at case study mine site
http://www.gjaets.com © Global Journal of Advance Engineering Technology and Sciences 27
Table 2 lists explosive and drill parameters used in both mines. The burden and spacing in minesite was 5.5x6.0 m. Clayey shale with fine grained sandstone strata of 9 m thickness was removed, during monitoring of vibration in underground. Both the underground monitoring panels were located at least 800-1000 m away from the active underground workings. Hence, the influence of blasting conducted in other locations of the underground mine on the monitoring panels would be negligible.
Monitoring Of Vibration At Underground Originating From Surface Blast
Three directional transducer/ standard geophones were mounted in the roof, pillar and floor by proper mounting arrangement. Firm contact between rock/coal strata and geophone surface was ensured by placing plaster of Paris as grout material. The mounting stations in the roof were at the junction as well as in between the two junctions of galleries. Geophones were mounted in pillars about 1.0-1.3 m below the roof surface and by cutting recess/duggy of 0.5 m inside the pillar from the roof line. Geophones were mounted at least 0.5 to 1 m inside the roofs and floors. These sensors were connected to the seismographs which were located at a safe location in underground.
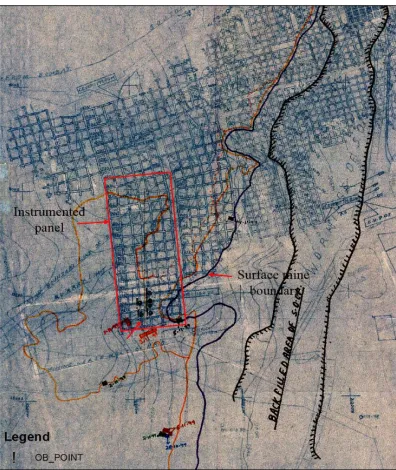
The composite mine plan depicting the opencast and underground workings is shown in the Figure 2. The figure shows the benches of OCM and experimented Bord and Pillar panel.It may be noted that Bordand Pillar panelwas only in the development stagewhen surface mine was in operation.Hence the radial distance from the blasted bench to the measurement stations varied continuously.
Table 2: Blasting details in case study mine site for overburden bench
Particulars Case Study Mine site Strata blasted Clayey shale with sandstone
overburden bench
Hole diameter (mm) 250
Hole depth (m) 9.5
Subgrade length (m) NIL
Burden x spacing (m x m) 5.5 X 6.0
Top stemming (m) 5.0
Initiation system Nonel and detonating Fuse with cord relay
Explosive type Emulsion
Explosive density (g/cc) 1.20 Explosive quantity per hole
(kg)
162
http://www.gjaets.com © Global Journal of Advance Engineering Technology and Sciences 28
Figure 2: Mine plan showing the opencastandUG workings at case study mine site
Vibrations in terms particle velocity and acceleration were recorded by geophones and stored in the base unit.Seismographs, namely BlastmateIII and Minimate Plus, were used in both case study mines to record vibration data, and underground monitoring stations are marked in Figure 2. Surface blasting and underground monitoring timing was planned by observing proper coordination between surface blasting team and underground monitoring team so that vibration in underground structures occurred only due to surface blasting. In case study mine site, a total of 67 observations were recorded at different locations in the roof, pillar and floor. Apart from vibration monitoring, fall of roof, damage in permanent ventilation stoppings and spalling of pillars were also recorded underground right after surface blast.
Peak Particle Velocity (Ppv) At Underground Monitoring Stations
The average, maximum, minimum and standard deviation of PPVs measured during the field experimentation are listed in Tables 3a-c respectively.
Table 3a: Average, max., min. and std. dev. of vibration records with geophones mounted at roof and floor
Top Priming Bottom Priming
Particulars Roof (mm/s)
Floor (mm/s)
Roof (mm/s)
Floor (mm/s) Average 83.20 33.0 89.10 36.30
Maximum 214.70 57.1 200.0 57.79
Minimum 20.63 11.4 31.50 21.20
Standard deviation
http://www.gjaets.com © Global Journal of Advance Engineering Technology and Sciences 29
Table 3b: Average, max., min. and std. dev. of vibration records with geophones mounted at roof and pillar
Table 3c: Average, max., min. and std. deviation of vibration records with geophones mounted at pillar and floor
It can be noted that geophones were mounted in the roof and floor, roof and pillar, and pillar and floor simultaneously during field measurements. From the measurements it is found that on an average PPV of roof is twice that of floor and one and half times that of pillar.
Classification Of Observed Damage
The severity of the problem can be gauged from the fact that the annual production of the Samleshwari mine in close vicinity of the Hingir Rampur underground mine has reduced to 3 Mt from 5 Mt due to restriction of explosive charge/delay and explosive charge /round being imposed by DGMS. Moreover, all the personnel working in the Hingir Rampur underground mine are to be withdrawn from the district when blasting is being carried out in the Samleshwari OCM to ensure their safety.
To assess the blast damage accurately, the study area was properly whitewashed so that the fresh fall from roof or pillar, development of new crack or extension of new crack can be visually noticed. Coal blocks detaching from roof having maximum dimension measuring up to 0.25-0.30 m3 is assumed as “Severe damage” type. The average size of coal blocks in severe damage type ranged between 0.10-0.15 m3. Some noticeable crack extension and fresh crack development was prominently witnessed in ventilation stoppings. There were number of instances when few loosened chips detached from roof or pillar and coal dust was generated after surface blast in UG workings. This type of damage is termed as “Moderate damage”. The instance of no spalling from roof or pillar as well as no new visible crack formation in ventilation stopping and other structures is categorized as “No damage”.
Development Of Predicator Equation
Authors have developed the attenuation equations of PPV based on flexible scaling law for both the Minesites and details are mentioned in earlier references (Jha, 2010, Deb and Jha, 2010). In this paper, the concepts and results are mentioned below. The attenuation law can be written in general form as
m n
PPV KQ D (1)
where,
Q = Charge weight/delay (kg)
D = Distance of the measuring transducer from blasting face (m)
K, m and n = Site constants to be determined from the measured data. Equation 1 can be rewritten in terms of scaled distance as
Top Priming
Bottom Priming Particulars Roof
(mm/s)
Pillar (mm/s)
Roof (mm/s)
Pillar (mm/s) Average 24.43 16.33 29.50 19.44 Maximum 57.75 38.50 81.80 50.80
Minimum 4.04 2.99 5.0 3.17
Standard deviation
17.90 12.44 20.88 13.75
Top Priming
Bottom Priming Particulars Pillar
(mm/s)
Floor (mm/s)
Pillar (mm/s)
Floor (mm/s) Average 18.51 10.79 12.21 7.38 Maximum 44.06 26.70 26.45 17.40 Minimum 4.91 2.92 4.13 2.50 Standard
deviation
http://www.gjaets.com © Global Journal of Advance Engineering Technology and Sciences 30 n s D PPV K Q
(2)
where s = m/n . Taking natural log in both sides, equation 2 becomes
ln(
PPV
)
ln( )
K
n
ln
D
sQ
(3)In equation 3, K, s and n are unknown. By applying least square method, K and n can be estimated if s is known. In the following, equation 3 has been used to determine value of K and n for both the mine sites by varying values of s from 0.1 to 0.75. The s value which provides the highest F statistic and R2
adjusted is considered to form the best predictor
equation.
In Minesite-2, a total of 54 sets of vibration data were recorded at mine roof of Hingir Rampur mine. In this case also, 6 data were recorded at the time of roof damage and they are omitted from statistical analysis. Out of 48 data sets, 35 data sets have been used as training data set and remaining 13 as validation data set. The predictor equation of Minesite is given in equation 4. Figure 3a shows the plot of R2
adjusted and F statistic for various values of s. In this case, the best
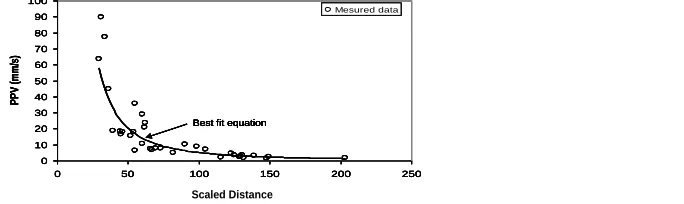
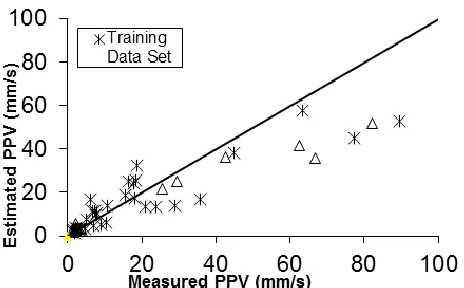
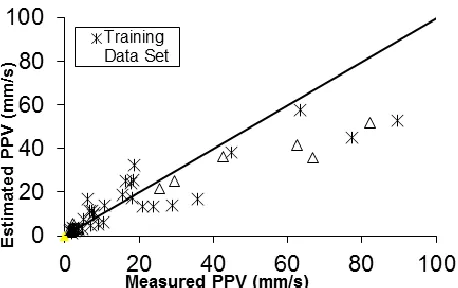
fit equation is obtained for s = 0.26. The site constant K and n have been estimated from the training data set as given in equation 4. Scatter plot of measured and the best fit equation are plotted as shown in Figure 3b. The variability of estimated PPV using equation 4.5 and measured PPV is shown in Figure 3c. It can be seen that the estimation of PPV can best be obtained if PPV ranges within 50 mm/s.
2.0082.008
0.26
52301 D 52301
PPV SD Q
(mm s
-1) (4)
From Figure 3a, it can be inferred that s = 0.5 or square root of charge per delay does not provide the best fit equation, while vibration is measured at an underground location.
Figure 3a: Relationship of Radjusted2 and F statisticparameters for case study mine site.
Figure 3b depicts the relationship between PPV and scaled distance (SD) of the best fit equation. It shows that PPVs estimated by equation 4 matches fairly well with the measured data.The scatter plot between measured (both training and validation data) and estimated PPVs also confirm the fact that the predicator equation 4 can be applied to forecast PPVs at underground locations due to surface blasting under similar geological conditions (Figure 3c).
Figure 3b: Relationship between PPV with scaled distance of case study mine site
0.0 0.1 0.2 0.3 0.4 0.5 0.6 0.7 0.8 0.9
0 0.1 0.2 0.3 0.4 0.5 0.6 0.7 0.8
s R 2a d ju s te d 0 20 40 60 80 100 120 140 160 180 200 F Sta ti s ti c
R square adjusted F statistic
s = 0.26 s = 0.5
0.0 0.1 0.2 0.3 0.4 0.5 0.6 0.7 0.8 0.9
0 0.1 0.2 0.3 0.4 0.5 0.6 0.7 0.8
s R 2a d ju s te d 0 20 40 60 80 100 120 140 160 180 200 F Sta ti s ti c
R square adjusted F statistic
s = 0.26 s = 0.5
0 10 20 30 40 50 60 70 80 90 100
0 50 100 150 200 250
Scale Distance P P V (m m /s ) Mesured data
Best fit equation
0 10 20 30 40 50 60 70 80 90 100
0 50 100 150 200 250
Scale Distance P P V (m m /s ) Mesured data
Best fit equation Best fit equation
Scaled Distance 0 10 20 30 40 50 60 70 80 90 100
0 50 100 150 200 250
Scale Distance P P V (m m /s ) Mesured data
Best fit equation
0 10 20 30 40 50 60 70 80 90 100
0 50 100 150 200 250
Scale Distance P P V (m m /s ) Mesured data
Best fit equation Best fit equation
http://www.gjaets.com © Global Journal of Advance Engineering Technology and Sciences 31
Figure 3c: Relationship between measured and estimated PPV for case study mine site
Development Of Blast Damage Factor (Bdf)
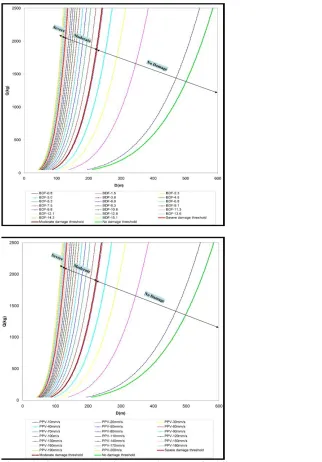
In general, several blasting factors (explosive type, explosive charge per delay), rock mass factors (dynamic tensile strength, P-wave velocity and Geological Strength Index of rock strata lying between surface mine to underground mine) and mining factors (size of rooms, distance from blasting site to monitoring station, pillar dimensions and others) can influence damage to UG structures due to surface blasting. A new concept of Blast Damage Factor (BDF) has been developed to assess the damage of underground structures using linear discriminant functions. A chart showing the relationship between Q and D are prepared for different values of PPV and BDF. The relationship can be used as a handy tool for determining safe blasting practices by estimating the explosive charge/delay at any given distance for no damage to the UG structures.
Definition of Blast Damage Factor (BDF)
Blast Damage Factor (BDF) is defined to assess the damage of underground mine workings caused by surface blasting. Yu and Vongpaisal (1996) suggested the concept of Blast Damage Index (BDI) for the same purpose. In this study, BDF is defined in terms of induced stress, damage resistance, together termed as Strength Factor, and Mining Factor and given as a dimensionless indicator of damage as:
Strength Factor Mining Factor
_
_
_ Re
tan
_
Induced Stress
Pillar Height
BDF
Damage
sis
ce
Pillar Width
(6.1a)p
C
GSI
dtsPVS
BDF
ph
W
(6.1b)Where, Blasting factor as PVS = Vector sum of peak particle velocity (PPV) in mm/s (blasting factor), Rock mass factors as = Density of rock mass in kg/m3, C
p = Compressional P- wave velocity of rock mass in m/s, dts =
Dynamic tensile strength of rock mass in N/m2, and GSI = Geological strength index of rock mass between blasting
source and underground mine.
http://www.gjaets.com © Global Journal of Advance Engineering Technology and Sciences 32
by the GSI of rock mass. Dynamic tensile strength of rock mass can be approximated by ci /3.6 where ci is the
uniaxial compressive strength of the intact rock (Mohanty, 1987, Yu and Vongpaisal, 1996). The Mining factor is inverse measure of the strength of coal pillars. The mine working factor is incorporated in BDF to evaluate the contribution of pillar geometry in the stability. In general Wp /h denotes the slenderness ratio of coal pillar and has
been used in pillar strength equation proposed by Bieniwaski and others (Herget, 1988). Hence, the composite factor will give an indicatory measure of blast induced impact assessment of surface blasts on adjacent underground structures.
For any given mining condition, the variables , Cp , GSI , dts may be assumed as nearly constant if the roof rock
remains the same. The above parameters define the geotechnical properties of rock mass. Under such assumption, it may be inferred that BDF is directly related to PVS. It may be approximated, mathematically, that BDF = f ( PVS) and PVS = h( D, Q) where f ( ) and h( )denote the arbitrary functions to be determined from datasets.
Concept of Linear Discriminant Function or Minimum Distance Classification for Generating BDF
Discriminant analysis builds a predictive model for group membership. The model is composed of discriminant functions for more than two groups based on the linear combinations of the predictive variables that provide the best discrimination between the groups. The functions are generated from a sample of cases for which group membership is known. For example, if xi denetoes the centroid or prototype impact pattern of ith class of data sets then minimum
distance linear discriminant function of ith class becomes (Zurada, 1992),
1for 1, 2, , 2
T T
i i i i
g x x x x x i k (7)
Wherek denotes the number of class. The function can then be applied to new cases that have measurements for the predictor variables but have unknown group membership. Thus discriminant analysis is used to investigate variables for group separation. A minimum distance classifier computes the distance from pattern x of unknown classification to each known prototype, xi . Then the category number of that closest or smaller distance, prototype is assigned to the unknown pattern, x . This concept is also called correlation classification because a closest match is sought between the known prototype pattern and the unknown input pattern.
Damage Prediction by Linear Discriminant Functions
As mentioned earlier, damage has been classified into “Severe, Moderate or No damage” categories. Linear discriminant functions are estimated for these categories or damage classes using predicted PVS. A class Severe or Moderate or No damage is assigned to an unknown observation (BDF) if the estimated value of discriminant function of a particular is the maximum.
Before carrying out the discriminant analysis, the total data has been divided into three parts i.e. training data, validation data and test data in ratio of 75%, 15% and 10% respectively. The total 54 vibration data recorded at roof of the Hingir Rampur due to surface blasting carried out at the Samleshwari OCP, MCL has been divided into 41 training data, 8 validation data and 5 testing data.
Linear discriminant functions are evaluated using estimated PPV data. Based on the criteria mentioned above, training data sets were assigned with a damage class based on the observed phenomena in underground. Then using equation 6b, BDF is estimated for each data set. The geotechnical parameters such as density, P-wave velocity, dynamic tensile strength and GSI for computing the BDF is taken from Table 2. Equations 8a-c denote the linear discriminant functions for case study mine site.
(
) 7.69
- 29.60
Severe
g
BDF
BDF
(8a)od
(
) 3.57
- 6.39
M erate
g
BDF
BDF
(8b)(
) 0.78
- 0.31
No
g
BDF
BDF
(8c)
http://www.gjaets.com © Global Journal of Advance Engineering Technology and Sciences 33
working chart for case study mine site based on Q versus D plots for different BDF as shown in Figures 6.
Figure 6. Relationship between Q and D for case study mine site for different BDF
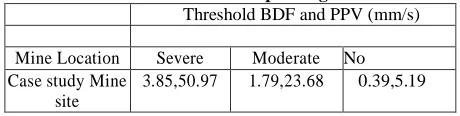
Threshold PPV and BDF values for three damage classes are listed in Table 4 for case study mine site. The results given above can be used as a guideline to determine the damage class and BDF can be obtained if D and Q are known using Figures 6.
http://www.gjaets.com © Global Journal of Advance Engineering Technology and Sciences 34
Table 4: Threshold BDF and corresponding PPV for mine site
Conclusions
In India, there are several locations where coal seams are excavated simultaneously in surface (opencast) and underground (Bord and Pillar) mines. There are considerable stability and safety concerns where surface mine blasting occur in vicinity of underground mines, as this can result in pillar spalling, roof collapse and junction failure as well as an associated loss of coal production. In this study, roof, pillar and floor vibrations were monitored in the Hingir Rampur Underground mine while blasting was carried out at adjacent surface mines. New predictor equations of the PPV have been developed based on the flexible scaled distance law. The roof vibration data of case study mine site was analysed to develop a new predictor equation of PPV at an underground location resulting from surface blasting. Scaled distance based on one-half power (square root) of charge per delay is generally applicable if vibrations are measured at surface points but may not be suitable for predicting PPV at underground installat ions. The study concludes that 0.26 power of charge per delay can be used to calculate the SD, suggesting use of variable scaling law for vibration predictor equation.
A new dimensionless blast damage factor has been developed for damage prediction of underground roof so that safe blasting can be planned at surface mines with due regard to the safety of underground workings. The threshold BDF and corresponding PPV values of severe damage, Moderate damage and No damage have been estimated using the linear discriminant function for case study mine site. From the study, it may be concluded that PPV less than 24 mm/s is unlikely to cause damage to underground structures. Relations between Q and D have been developed for different values BDFs for calculating safe explosive charge per delay at any given distance in underground mine workings. These charts can be a handy tool for practicing blasting engineers to ascertain safe charge for any known distance.
References
1. Birch, W. J. & Chaffer, R. 1983. Predictions of ground vibrations from blasting on opencast sites. Trans. Inst. Min. Metall. A 92A: A103–A107.
2. Deb D. & Jha, A. K. 2010. Estimation of blast induced peak particle velocity at underground mine structures originating from neighbouring surface mine. Mining Technology 119(1): 14-21.
3. Davies, B., Farmer, I. W. & Attewell, P. B. 1964. Ground vibrations from shallow sub-surface blasts. Engineer 217, 553–559.
4. Duvall, W. I. & Petcoff, B. 1959. Spherical propagation of explosion generated strain pulses in rock. RI 5483, US Bureau of Mines, Pittsburgh, PA, USA, 21.
5. Fourie, A. B. & Green, R. W. 1993. Damages to underground coal mines caused by surface blasting. Int. J. Surf. Min. Reclam.7 (1): 11–16.
6. Herget G. 1988. Stresses in Rock, Rotterdam, Balkema.
7. Jha A. K. 2010. Evaluation of the Effects of Surface Blasting on Adjacent Underground Mine Workings. Ph.D. Thesis, IIT Kharagpur, India.
8. Langefors, U., Kihlstrom, B. & Westerberg, H. 1958. Ground vibrations in blasting. Water Power: 335–338, 390–395, 421–424.
9. Mohanty B. 1987. Strength of rock under high strain rate loading conditions applicable to blasting. Proceedings of the 2nd symposium on rock fragmentation by blasting, Keystone, USA: 72-78.
10. Roy, P. P. 1993. Putting ground vibration prediction into practice. Colliery Guard. 241(2),:63–67.
11. Singh, P. K. 2002. Blast vibration damage to underground coal mines from adjacent open-pit blasting. Int. J. Rock Mech. Min. Sci. 39: 959–973.
12. Yu T.R. & Vongpaisal S. 1996. New blast damage criteria for underground blasting. The Canadian Institute of Mining Bulletin: 139-145.
13. Zurada J.M. 1992. Introduction to Artificial Neural systems. West Publishing Company, New York. Threshold BDF and PPV (mm/s)
Mine Location Severe Moderate No Case study Mine
site
http://www.gjaets.com © Global Journal of Advance Engineering Technology and Sciences 35
Acknowledgements (Use ‘Heading 1’ Style)
Text here… (Use ‘Body Text’ style)Note: please acknowledge collaborators here or anyone who has helped with the paper. It may also be appropriate to acknowledge company approval to publish.
Figure Captions
FIG 1Typical layout of rock strata at case study mine site
FIG 2Mine plan showing the opencast andUG workings at case study mine site
FIG 3(a) Relationship of Radjusted2 and F statisticparameters for case study mine site.
FIG 3(b) Relationship between PPV with scaled distance of case study mine site FIG 3(c)Relationship between measured and estimated PPV for case study mine site FIG 4Relationship between Q and D for case study mine site for different BDF
Table Captions
Table 1 Description of underground mine and related geotechnical parameters Table 2 Blasting details in case study mine site for overburden bench
Table 3(a) Average, max., min. and std. dev. of vibration records with geophones mounted at roof and floor Table 3(b) Average, max., min. and std. dev. of vibration records with geophones mounted at roof and pillar Table 3(c) Average, max., min. and std. deviation of vibration records with geophones mounted at pillar and floor
Table 4 Threshold BDF and corresponding PPV for mine site.
Figures
http://www.gjaets.com © Global Journal of Advance Engineering Technology and Sciences 36
FIG 2 – Mine plan showing the opencast andUG workings at case study mine site
FIG 3(a) Relationship of Radjusted2 and F statisticparameters for case study mine site.
FIG 3(b) Relationship between PPV with scaled distance of case study mine site
0.0 0.1 0.2 0.3 0.4 0.5 0.6 0.7 0.8 0.9
0 0.1 0.2 0.3 0.4 0.5 0.6 0.7 0.8
s R 2 a d ju s te d 0 20 40 60 80 100 120 140 160 180 200 F Sta ti s ti c
R square adjusted F statistic
s = 0.26 s = 0.5
0.0 0.1 0.2 0.3 0.4 0.5 0.6 0.7 0.8 0.9
0 0.1 0.2 0.3 0.4 0.5 0.6 0.7 0.8
s R 2 a d ju s te d 0 20 40 60 80 100 120 140 160 180 200 F Sta ti s ti c
R square adjusted F statistic
s = 0.26 s = 0.5
0 10 20 30 40 50 60 70 80 90 100
0 50 100 150 200 250
Scale Distance P P V (m m /s ) Mesured data
Best fit equation 0 10 20 30 40 50 60 70 80 90 100
0 50 100 150 200 250
Scale Distance P P V (m m /s ) Mesured data
Best fit equation Best fit equation
Scaled Distance 0 10 20 30 40 50 60 70 80 90 100
0 50 100 150 200 250
Scale Distance P P V (m m /s ) Mesured data
Best fit equation 0 10 20 30 40 50 60 70 80 90 100
0 50 100 150 200 250
Scale Distance P P V (m m /s ) Mesured data
Best fit equation Best fit equation
http://www.gjaets.com © Global Journal of Advance Engineering Technology and Sciences 37
http://www.gjaets.com © Global Journal of Advance Engineering Technology and Sciences 38
FIG 4 Relationship between Q and D for case study mine site for different BDF
Tables
Table 1 Description of underground mine and related geotechnical parameters
Particulars Case Study Mine site Name of the seam HR - IV Seam Pillar size (corner to corner) m 29 x 29 Gallery width (m) 4.6 Gallery Height (m) 2.6
RQD (roof) 50.4
GSI (roof) 50.4
Support system Roof bolting, props and cross bars
Average rock density (t/m3) 1.84
Weighted P wave velocity(m/s) 2250
Rock layers in between surface and underground mines
http://www.gjaets.com © Global Journal of Advance Engineering Technology and Sciences 39
Table 2 Blasting details in case study mine site for overburden bench
Table 3(a) Average, max., min. and std. dev. of vibration records with geophones mounted at roof and floor
Top Priming Bottom Priming
Particulars Roof (mm/s)
Floor (mm/s)
Roof (mm/s)
Floor (mm/s) Average 83.20 33.0 89.10 36.30
Maximum 214.70 57.1 200.0 57.79
Minimum 20.63 11.4 31.50 21.20
Standard deviation
56.61 12.81 50.53 13.24
Table 3(b) Average, max., min. and std. dev. of vibration records with geophones mounted at roof and pillar
Weighted UCS (MPa) 24.6
Dynamic tensile strength(MPa) 6.83
Immediate roof layer up to
2.0m 2.0 m - Shale
Particulars Case Study Mine site
Strata blasted Clayey shale with sandstone overburden bench
Hole diameter (mm) 250
Hole depth (m) 9.5
Subgrade length (m) NIL
Burden x spacing (m x m) 5.5 X 6.0
Top stemming (m) 5.0
Initiation system Nonel and detonating Fuse with cord relay
Explosive type Emulsion
Explosive density (g/cc) 1.20
Explosive quantity per hole (kg)
162
Charge factor (kg/m3) 0.58
Top Priming
Bottom Priming Particulars Roof
(mm/s)
Pillar (mm/s)
Roof (mm/s)
http://www.gjaets.com © Global Journal of Advance Engineering Technology and Sciences 40
Table 3(c) Average, max., min. and std. deviation of vibration records with geophones mounted at pillar and floor
Table 4 Threshold BDF and corresponding PPV for mine site.
Standard deviation
17.90 12.44 20.88 13.75
Top Priming
Bottom Priming Particulars Pillar
(mm/s)
Floor (mm/s)
Pillar (mm/s)
Floor (mm/s) Average 18.51 10.79 12.21 7.38 Maximum 44.06 26.70 26.45 17.40
Minimum 4.91 2.92 4.13 2.50
Standard deviation
12.35 7.02 7.17 4.74
Threshold BDF and PPV (mm/s)
Mine Location Severe Moderate No
Case study Mine site