RESEARCH ARTICLE
Time Based Fault Detection and Isolation in Wireless
Sensors Network
Imane Merzougui
University of Béchar, Algeria
[email protected]
Youssef Benabbassi
University of Bechar, Laboratory RIIR Univ-Oran, Algeria
[email protected]
Abstract – Wireless sensor networks have paved the way for the creation of a new generation of applications in a variety of fields. The main aim of this article is to simulate some faults in the behavior of wireless sensor networks. These faults can be classified as “failures” or “intrusions”, and in our work, we have focused on the three following faults: external factors (such as Animals, weather ...), a jamming attack in which the attacker is a mobile entity, and finally an inundation attack (successive Hello messages). In order to address the above issues we have designed a method for the detection and isolation of a faulty sensor and a simulator to show the influence of failures and to test the effectiveness of our solution using C++ programming language. This simulation is Capable of detecting and isolating a faulty sensor even in the case when multiple sensors break down at the same time.
Index Terms— Wireless Sensors Network, Fault Detection and Isolation, Attacks, Energy consumption, Simulation.
1. INTRODUCTION
Unquestionably, the beginning of the 21st century was the big bang time for information and communication technology resulting in a numerous number of sub technologies such as the internet and Wireless sensor networks. Wireless sensor networks (WSN) have caused an uproar and big difference in the field of technology, giving scientists a new vision of how the world might become in the future. National Research council has stated in a recent report that these Wireless sensor networks (WSNs) could well dwarf previous revolution in the information revolution [1].
In WSN a large number of sensor node are randomly placed in inaccessible zones [2]. However, WSN can be deployed almost anywhere needed [3]. In various real life applications, security in WSN is a crucial matter [4]. WSN node faults are usually due to the following causes the failure of modules (such as communication and sensing module) due to fabrication process problems, environmental factors, enemy attacks and battery power depletion; being out of the communication range of the entire network [5]. The node status in WSNs can be divided into two types [6-7]: normal
and faulty. Faulty in turn can be “permanent” or “static”. The so-called “permanent” means failed nodes will remain faulty until they are replaced, and the so-called “static” means new faults will not generated during fault detection. The Management of abnormal behavior of systems such as automation of failures is a major challenge in the process and the reconfiguration for fault handling.
The goal of this work is to simulate WSN’s deployment, and then analyze the collected faults, focusing on three scenarios of failure (external factor, jamming attack, inundation attack), then try to detect and isolate them using a method called “Fault Detection and Isolation Method” (FDI).
The Organization of this paper is as follows:
The section 2, presents related work in the field of fault detection in WSN.
In section 3, we explain the FDI method scheme and its concepts.
In section 4, it is represent the problematic of the paper.
In section 5, we show the Proposed Modeling.
In section 6, we will discuss the results of simulation.
The section 7, represent the conclusion of Article and the main points.
2. RELATED WORK
In an improved Distributed Fault Detection scheme proposed by Jiang |5] in which neighbors always exchange sensing measurement periodically which allows the sensor to judge its own state (good or faulty) based on the received neighbors values.
The proposed method in article [8] is a localized fault detection scheme to identify the faulty sensors; this method has a good performance only when there is a large number of neighboring nodes to be diagnosed.
RESEARCH ARTICLE
account this possibility and it is associated with a distributed Bayesian scheme for detecting and correcting these faults.
In the article [10], the authors gave taxonomy for classification of faults in sensor networks and the first on-line model-based testing technique. The technique considers the impact of readings of a particular sensor on the consistency of multi-sensor fusion. The sensor is most likely to be faulty if its elimination significantly improves the consistency of the results. They propose a solution to distinguish the random noise by using the Bayesian method on various sensors nodes. This random noise exists, if the fusion of sensors increases after running the approach. This technique is considered as Centralized technique which use sensors information and sent to the sink to conduct the fault detection.
The Article [11], presented a DFD algorithm that identified faulty sensor nodes based on comparisons between neighboring sensor nodes’ data. This comparisons use two parameters which are sliding window and some storage space, to eliminate the delay produced by the time redundancy.
The authors in article [12] gave a probabilistic Method which diagnoses intermittent faults in WSNs. The result of simulation shows that DFD algorithm based on the number of diagnostic rounds, however these rounds consist of exchanging quantification with the neighboring nodes.
In Article [13], authors made an online lightweight failure detection scheme named Agnostic Diagnosis (AD). This approach is motivated by the fact that the system metrics of sensors (e.g., radio-on time, number of packets transmitted) usually exhibit certain correlation patterns. This method contains a lot of metrics which are classified into four categories:
Timing metrics, they denote the accumulative radio-on time.
Traffic metrics, They record the accumulative number of packets transmitted by a sensor node;
Task metrics. This is the accumulative number of tasks executed;
The metrics which are count the number of parent changes. AD exploits the correlations between the metrics of each sensor using a correlation graph that describes the status of the sensor node. It uses data-mining through graphic result of correlation, that made up an abnormal correlations are appear in time.
Using management architecture, a failure detection scheme called MANNA was proposed for WSNs in the article [14]. This scheme created a manager, which has the global vision of the network, to perform complex tasks such as retrieving the node state and detect node failure. However, the centralized
management and overhead communication may not realistic for many applications.
3. THE FDI METHOD SHEME AND ITS CONCEPTS
A Fault is defect or imperfection which had responsibility of the failure or a wrongful act, it had many characteristic property of the system such as acceptable, usual, standard condition term [15]. The Fault Detection and Isolation composed on tree methods which are:
3.1.Model Free Methods
When the analytical approach to FDI is not available, the Data based Models can be used instead [16]. These models can be applied in many practical application especially those ones that have a large archive of processed data including non-linear system.
3.2.Knowledge Based Methods
Another alternative to the analytical FDI approach is the knowledge-based approach, which either makes use of the knowledge available to derive a qualitative description of the system in the form of a qualitative model or a rule-based representation [15].
3.3. Model Based Methods
It is a Comparison of actual system with a nominal model system [17].
4. PROBLEMATIC
Our problematic is a set of specific attacks and failures. A variety of attacks against WSNs is reported in the literature. To face up these attacks, various countermeasures were offered. The following main types of attacks, sorted by their assignments to the appropriate layers of the protocol stack in WSNs.
We studied three attacks or faults, which are organized as follow:
4.1. Jamming Attacks
Wireless communication systems are often susceptible to the jamming attack in which adversaries attempt to overpower transmitted signals by injecting a high level of noise [19]. The target here of attack is the media of communication. The attacker can perturb the communication by sending a signal of the same frequency used in WSN's Communications, which leads to disability of exchanging data and the unavailability of communication channels in WSN.
4.2. Inundation Attacks
RESEARCH ARTICLE
packets to explore one-hop neighbors and the attacker makes use of such packets to engage broad number of sensor nodes by inundation of traffic in the network [18]. Therefore, an attacker can exploit these packets of “HELLO” by sending a stream of such messages to flood network and to prevent other messages of exchanged beings.
4.3.External Factor
It is anything, that interrupt or break a sensor node such as an animal or an object, In this case the sensor node play a role of attacker, it will change its behavior, which it may be a fake detection, fake hello, or sending ambiguous messages to its neighbor, our work is to simulate those behaviors.
5. PORPOSED MODELLING
5.1. Isolation Phase
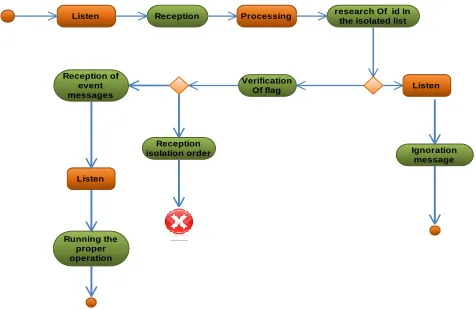
We notice that the sensor has two states; the first state is listening to messages. Once they are received by the sensor node, the second one is processing them. After that, the sensor looks for the Id in an isolated list. Then, it verifies the flag of messages or returns to the listening state.
Figure 1 Receiving Messages In Case “Isolation order”.
The verification of the flag is either in a form of isolated order or a happening event. Right after that, once messages are received, the sensor runs the proper Operation.
Sending Signalization in Case of Inundation
In this case, during which the sensor receives a “HELLO MESSAGE”. This message has two Options: if the message was received right after the period of activation, it sends a signalization to the sink.
Whereas, concerning the second option which is at the level of “activation period”, if the number of messages sent is more than three messages, a signalization is sent. After that, the sensor receives the order to isolate the event
Figure 2 Signalization.
5.2. Our Proposed Solution (TBFDI)
The main objective of this section is to present our contribution as part of this work. We start first by a description of our approach, then we discuss the environment used for the implementation of the solution, finally, we analyze the performance of our approach with the various simulations. We called our Approach “Time Based Fault Detection and Isolation “which detect three types of attacks, and isolate their influence over our network. These attacks are:
Jamming attacks which we can control by using the following procedure: “Each sensor detects an ambiguous message should send signalization “. The second attack is inundation attack, which we propose a technique to discover “Hello inundation” that makes inundation truly unsuccessful; we decompose our timer to three periods: The first period, when admin gives the order of activation. The second period, its period is given to the sensor node to transmit its hello messages, we can call it also the period of activation. The third period, when the period of activation is completed or finished. This means that any messages of Hello are rejected. The third attack is External factors. For that factor, our work is to simulate three behaviors, which are a fake detection, a fake hello, or sending ambiguous messages.
5.3. Organizational Flowchart of The Proposed Solution (TBFDI)
In the case of jamming attacks, the sensor start receiving messages from its neighbors if one of these messages is flagged as an ambiguous message, it reads the Id of the sender and then checks if this Id has been flagged before.
Listen Reception Processing research Of id In the isolated list
Ignoration message Verification
Of flag Listen Reception
isolation order Reception of
event messages
Listen
Running the proper operation
Listen Reception of hello
message Processing
During PDOA and number of messages
more than" 3" messages"
send signalization reception the order of isolation send
signalization
After PDOA and any message received
" it is not acceptable "
By adding in list of isolate attacks
RESEARCH ARTICLE
Figure 3 Jamming Solution Algorithm.
If “no” and the message is ambiguous it sends a signaling message associated with a flag to the administrator and wait for the isolation order.
If “yes”, the ID does exist in “the isolated IDs table” and the message is an ambiguous it resends the signaling message to the administrator and repeats the process again.
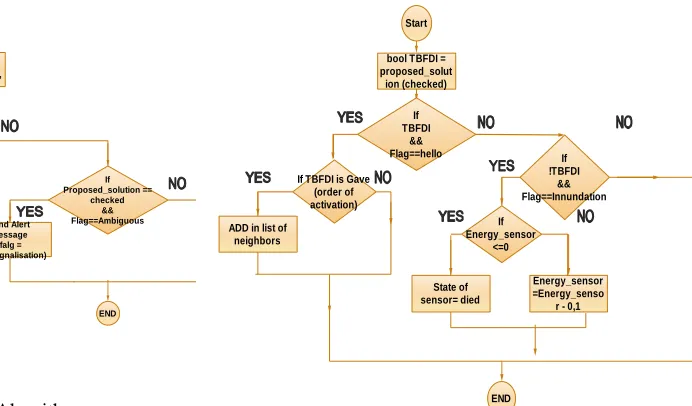
In the case of inundation attacks, Our proposed solution works as follows: After activation of the TBFDI method, a timer starts running as long as its value is smaller than a certain period. The TBFDI is considered to be “ON” and the value of “BOOL TBFDI” is equal to “1”.
If the TBFDI is “ON” and the sensor receives a HELLO message its ads the senders to its list of neighbors. In addition,
If the Timer exceeds the activation period and the sensors receives another hello message it considers it as an inundation message with goal of decreasing the energy of our power. Supply and in order to simulate that we decrease the energy level by 0.1 unit.
Moreover, if the energy level reaches the Zero level the sensor is considered to be dead. Finally, if an inundation message is received during the activation period we apply the following detection procedure: Since the inundation attack is a repeated process of sending hellos, our sensor should count the number of received hellos if it’s less or equal to 2, the sensor replies and adds its sender to its list of neighbors.
Figure 4 Inundation Solution Algorithm Part One.
Figure 5 Inundation Solution Algorithm Part Two.
If the number of received hellos exceeded two the sensor considers the received hellos as an inundation attack, therefore it sends a signaling message to the administrator and waits for the isolation order.
6. RESULTS AND DISCUSSIONS
This simulation is built using 49 sensors and 1 sink beside this field of sensing with 600 meters height and 800 meters width. We were interested to simulate three scenarios of faults by measuring the following performance metric:
Energy of network and sensor node.
For (Counter =0, Counter < Isoleted,Counter
=Counter +1; (search the isolated list) Reading the data of system
(received message): (ID,ID_transmitter,ID_receiver,Flag,
contents)
If Id_Cybil== ID_transmitter
END If Proposed_solution ==
checked && Flag==Ambiguous send Alert
message (falg = flag_signalisation) Start
Id_Cybil=Get Identificateur
send Alert message (falg = flag_signalisation)
Start
bool TBFDI = proposed_solut
ion (checked)
If TBFDI
&&
Flag==hello If
!TBFDI && Flag==Innundation
If Energy_sensor
<=0
END If TBFDI is Gave
(order of activation) ADD in list of
neighbors
Energy_sensor =Energy_senso
r - 0,1 State of
sensor= died
Start
Int_reception=0
If T BFDI
&& Flag==Innundation
If Int_receptio
n==3 Int_reception
=Int_reception+1
If Int_receptio
n<2 send message
"hello" to
neighbors send Alert message (falg = flag_signalisatio
n)
RESEARCH ARTICLE
Number of neighbors of sensor node.
Number of attacks.
In order to ensure the performance of our network, we plotted four graphs for three cases:
6.1.The case of External factor
Energy of network: it is represent the sum of all sensors in our network.
Figure 6 Network’s Energy (EXTERNAL FACTOR).
The consumption is falling gradually in normal way from time unit 1 to 27; we have 15 second between each unit of time. The consumption of energy is about average: we considered the unit time 15s.So we consider the average of energy change as the following way:
𝐴𝑣𝑟=∑ 𝐸𝑛𝑔𝐷𝑖𝑓𝑓/ 𝑇𝑖𝑚𝑒.
𝐴𝑣𝑟𝐸 = 44
210= 0,21 Energy unit
We may observe abnormal graduation of energy consumption between 27 and 47-time unit, when we are adding an External Factors.
𝐴𝑣𝑟𝐸′ =8648
165 = 52,41 Energy unit
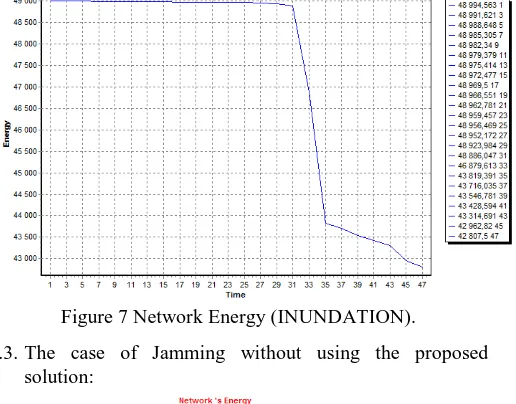
6.2.The case of inundation without using the proposed solution
We notice a considerable falling of energy when we are adding an inundation attacks at the time 27, that falling considered amount:
Normal state:
𝐴𝑣𝑟𝐼 =21042 = 0,20. Energy unit.
Attack state:
𝐴𝑣𝑟𝐼′=6145
165 = 37,24. Energy unit
Figure 7 Network Energy (INUNDATION).
6.3.The case of Jamming without using the proposed solution:
Figure 8 Network energy (JAMMING).
We observe a considerable falling of energy when the adding of jamming attack at the time 27, that falling considered amount:
Normal state:
𝐴𝑣𝑟𝐽 =21042 = 0,20 Energy unit.
Attack state:
𝐴𝑣𝑟𝐽′= 872
165 = 5,28. Energy unit
6.4.The Applying Of Time Based Fault Detection and Isolation:
RESEARCH ARTICLE
Figure 9 Number of Attacks Over Area of Study.
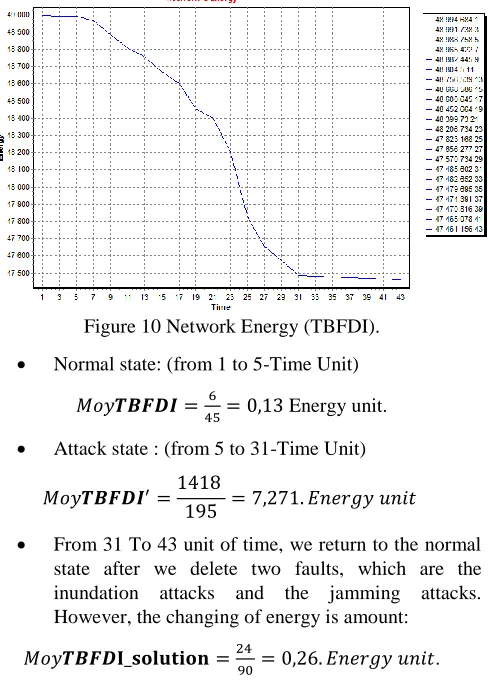
This following graph shown network’s energy in case when we activate our solution, this energy is calculated by sum the Energy of All sensors. However, The TBFDI authorizes us to detect fault (inundation & jamming) and isolate their influence.
Figure 10 Network Energy (TBFDI).
Normal state: (from 1 to 5-Time Unit)
𝑀𝑜𝑦𝑻𝑩𝑭𝑫𝑰 =456 = 0,13 Energy unit.
Attack state : (from 5 to 31-Time Unit)
𝑀𝑜𝑦𝑻𝑩𝑭𝑫𝑰′=1418
195 = 7,271. 𝐸𝑛𝑒𝑟𝑔𝑦 𝑢𝑛𝑖𝑡
From 31 To 43 unit of time, we return to the normal state after we delete two faults, which are the inundation attacks and the jamming attacks. However, the changing of energy is amount:
𝑀𝑜𝑦𝑻𝑩𝑭𝑫𝐈_𝐬𝐨𝐥𝐮𝐭𝐢𝐨𝐧 =24 90 = 0,26. 𝐸𝑛𝑒𝑟𝑔𝑦 𝑢𝑛𝑖𝑡.
Finally, in order to figure out the number of neighbors of each sensor, those allow knowing the state of sensor nodes, which
are the faulty ones.
Figure 11 Neighbors Number.
6.5.Resulted table:
Fault state
External factor
inundation attacks
Jamming attacks
Solution Proposed
Normal 0,21 0,20 0,20 0,13
Abnormal 52,41 37,24 5,28 7,271
Differences 52,20 37,04 5,08 7,141
Table 1 Energy Change
As we can see in table 1 we are comparing the energy consumption in the normal state of the network (i.e. the network does not attacked by the proposed attacks), and the abnormal state when the network is attacked. Therefore, in the first state it indicates that the energy flows in the stable way. The second state, the energy consumption is increasing rapidly.
The differences between the two cases (normal/abnormal) show us the measure of energy consumption. These values are extracted from our simulation that is created using C++ language (C++ builder platform). This application simulates the deployment of sensors, the proposed attackers, their influences, and draws graphs of the energy consumption.
Finally, this table describes the energy consumption of the network during the attacks and after Appling the proposed solution, as we can see our proposed solution TBFDI does minimize the energy conception and ensures the performance of the network.
7. CONCLUSION
RESEARCH ARTICLE
considered. In this paper, we have proposed a time-based algorithm for the detection and isolation of three different WSN’s failures. This algorithm has proved its ability to detect three types of faults but it has some drawbacks such as its decreased performance when the size of the network gets bigger, therefore their might be some improved version of this algorithm in the future that addresses this problem.
REFERENCES
[1] D. Estrin et al.,” Embedded, Everywhere: A Research Agenda for Networked Systems of Embedded Computers,” (Nat’l Research Council Report), 2001.
[2] A. Anuba Merlyn, A. Anuja Merlyn, ‘‘Energy Efficient Routing (EER) For Reducing Congestion and Time Delay in Wireless Sensor Network’’, International Journal of Computer Networks and Applications (IJCNA), ISSN: 2395-0455, Volume 1, Issue 1, November – December, 2014, pp.1-10.
[3] Sercan VANÇİN, Ebubekir ERDEM, ‘‘Design and Simulation of Wireless Sensor Network Topologies Using the ZigBee Standard’’,International Journal of Computer Networks and Applications (IJCNA), ISSN: 2395-0455, Volume 2, Issue 3, May – June, 2015, , pp. 135-143.
[4] Prachi, ‘’ A Probabilistic Key management Protocol based on Kryptograph for WSN’’, International Journal of Computer Networks and Applications, ISSN: 2395-0455, Volume 2, Issue 2, March –April, 2015, pp.76-83
[5] Jiang P.,” A New Method for Node Fault Detection in Wireless Sensor Networks. Sensors” (Basel, Switzerland), 2009, pp.1282-1294. [6] Chessa S., Santi P.,” Comparison based system level fault diagnosis in
Ad hoc networks (Proceedings of IEEE 20th Symp),” On Reliable Distributed Systems (SRDS) New Orleans. IEEE Press; 2001. pp. 257– 266.
[7] Chessa S, Santi P,” Crash faults identification in wireless sensor networks,” Comput. Common, 2002, pp. 1273–1282.
[8] Chen J.R., Kher S., “Somani A, Distributed fault detection of wireless sensor networks”. Proceedings of the International Conference on Mobile Computing and Networkings; Los Angeles, CA, USA. September 2006, pp. 65–72.
[9] Krishnamachari B., Iyengar S.,” Distributed Bayesian algorithms for fault-tolerant event region detection in wireless sensor networks”. IEEE Trans. Compute, 2004, pp. 241–250.
[10] Koushanfar F., Potkonjak M., “Vincentelli A.S. On-Line Fault Detection of Sensor Measurements,” Proceedings of the IEEE Sensors; Toronto, ON, Canada, October 2003, pp. 974–979.
[11] M. Lee and Y. Choi, “Fault Detection of Wireless Sensor Networks,”Elsevier Computer Communications, vol. 31, no. 14 September 2008, pp. 3469–3475.
[12] P. Khilar and S. Mahapatra, “Intermittent Fault Diagnosis in Wireless Sensor Networks,” in Proc. of IEEE 10th International Conference on Information Technology (ICIT), Rourkela, India, December 2007. [13] Miao X., Liu K., He Y., Liu Y. Papadias D.,” Agnostic diagnosis:
Discovering silent failures in wireless sensor networks,” Proceedings of the IEEE INFOCOM; Shanghai, China. 10–15, April 2011, pp. 1548– 1556.
[14] Ruiz LB, Siqueira IG, Oliveira LBe, Wong HC, Nogueira JM, Loureiro AAF. “Fault management in event-driven wireless sensor networks,”
In: Proc. of the 7th ACM Int’l Symp. On Modeling, Analysis and
Simulation of Wireless and Mobile Systems. Venice, 2004, pp.149−156.
[15] Maria Jesús de la Fuente,” Fault Detection and Isolation: an overview,” Dpto. Ingenieria de Sistema’s y Automatico Universiade de Valladolid. 2010
[16] P.M. Frank, E. Alcorta Garcia, B. Köppen-Seliger,” Modelling for fault detection and isolation versus modelling for control,” Department of Measurement and Control, Gerhard-Mercator-University Duisburg, Bismarckstr Duisburg, Germany Accepted 28 July 2000.
[17] Simani, S., Fantuzzi, C., & Patton, R. J.,” Model-based fault diagnosis in dynamic systems using identification techniques”. Springer Science & Business Media, 2013.
[18] Saranya, J., & Padmavathi, G.,” A Brief Study on Different Intrusions and Machine Learning-based Anomaly Detection Methods in Wireless Sensor Networks”. Int. J. Advanced Networking and Applications, 2015, pp. 2414-2421.
[19] Chiang, J. T., & Hu, Y. C.,” Cross-layer jamming detection and mitigation in wireless broadcast networks,” In Proceedings of the 13th annual ACM international conference on Mobile computing and
networking, 2007, September, pp. 346-349.
Authors
Imane Merzougui obtained her Master degree in Computer Science from University of Bechar, Algeria in 2015. Her research interests are wireless sensor networks and security.