Estimating sensory texture of cooked rice using full
and optimized predictive regression models
Youngseung Lee1†, Han Sub Kwak1,2†, Marura Lenjo3, Jean François Meullenet3*
1Department of Food Science and Nutrition, Dankook University, Yongin-si 448–701, Korea; 2Natural Nutraceuticals Industrialization Research Center, Dankook University, Cheonan-si 330-714 Korea; 3Department of Food Science, University of Arkansas, Fayetteville, AR 72701 USA; †These authors contributed equally to this study
*Corresponding Author: Jean François Meullenet, Department of Food Science, University of Arkansas, 2650 N. Young Avenue, Fayetteville, AR 72704. Phone: (479) 575-6822, Fax: (479) 575-6936, E-mail: [email protected].
Received: 28 September 2015; Revised: 22 November 2015; Accepted: 24 November 2015; Published Online: 24 November 2015
INTRODUCTION
Estimating food quality by correlating sensory evaluation results and instrumental measurement has been widely studied (Chen, et al., 2005; Jeong, et al., 2013; Lee, et al., 2014). Texture characteristics of cooked rice play a major role in the selection of properly cooked rice (Nishinari, 1996). Recently, estimating cooked rice quality by instrumental measurements – Toyo taste meter and eating quality indicator – has been conducted by correlating consumer acceptance ratings in order to find out which instrumental parameters were related with consumer acceptance. Kwak et al. (2015a) have shown differences in drivers’ liking and disliking of aseptic-packaged cooked rice based on consumer acceptance and two instrumental measurements using partial least square regression (PLSR) analysis. The instrumental measurements were not highly correlated with consumer acceptability or many descriptive attributes in aseptic-packaged cooked rice. For frozen-cooked rice, hardness and stickiness based on the texture analyzer were highly correlated with consumer acceptance (Kwak et al., 2015b). However, these studies were mainly focused on the relationship between consumer acceptance and instrumental
quality measurement rather than the relationship between attribute intensities and texture profiles.
Several researchers have studied instrumental evaluation of cooked rice texture in order to estimate the intensities of texture attributes from descriptive analyses. One of the widely used instrumental texture measurement methods was Ottawa extrusion cell (Juliano, et al., 1984; Meullenet, et al., 1998). However, the dimensions of traditional Ottawa cell require a large amount of samples (approximately 100 g) for evaluation. After the introduction of Ottawa cell for rice texture measurement, a extrusion cell method with lower amount of cooked rice was designed to measure cooked rice texture (Sitakalin and Meullenet, 2000). The results showed a more accurate predictive model by the small extrusion cell analysis. Applying appropriate statistical methods to analyze these results are necessary in order to deliver a better estimation model. Traditionally PLSR was used for the estimation by using the entire results (Kwak et al., 2015a; Meullenet, et al., 1998). If there are noise results that distort the average results, these outliers would be negatively influence the validation of the estimation model. Jackknife resampling method (JRM) is the statistical method for optimization by deleting noise data The objective of this study was to predict descriptive texture characteristics of cooked rice with a texture analyzer using a full predictive
model (partial least square regression; PLSR) and an optimized predictive model (jackknife resampling method; JRM). Texture profiles of
102 cooked rice samples were measured using a spectral stress strain analysis. Eleven sensory texture characteristics were evaluated using a trained descriptive panel. The JRM showed slightly better prediction for sensory texture attributes than PLSR due to the removal
of insignificant variables. The following three sensory attributes were strongly predicted by JRM based on the calibration model correlation coefficient (Rcal): cohesion of bolus (Rcal = 0.78), adhesion to lips (Rcal = 0.83), and hardness (Rcal = 0.72). Cohesiveness, toothpull and toothpack were moderately predicted (Rcal ≥ 0.60). The results from the texture analyzer were able to estimate sensory texture attributes, which were directly related to texture characteristics such as hardness, stickiness and cohesiveness.
Keywords: Rice; Texture; Partial least square regression; Jackknife resampling
A B S T R A C T
http://www.ejfa.me/
(higher than ±2 standard deviations) from the full statistical model (Martens and Martens, 2001). By removing the noise data, there would be a higher chance to generate a more robust predictive model for estimation. Therefore, the objective of this study was to estimate sensory texture attributes of cooked rice by an instrumental texture measurement named spectral stress strain analysis (SSSA) using two regression models, PLSR analysis and JRM.
MATERIALS AND METHODS
Rice samplesAll varieties were harvested from the University of Arkansas Rice Research and Extension Center at Stuttgart, AR, USA. Moisture contents of harvested rice were ranged 17 – 19% (wet base). Three long grain rice varieties (Oriza sativa var. Drwe, Bengal, and Kaybonnet) were used for the evaluation and total numbers of rice samples were 102. Samples were dried (12 – 13% w/w) and stored by the University of Arkansas Rice Processing Plant.
Descriptive analysis
Eleven trained panelists with three years of experience in Spectrum descriptive analysis method (Meilgaard, et al., 1999) evaluated eleven texture attributes for 102 cooked rice samples. Attributes evaluated and their definitions are presented in Table 1. The eleven attributes were intensified during four evaluation stages following the general procedure for eating cooked rice. During the initial stage of evaluating cohesion of bolus, particles size and adhesiveness to lips were evaluated. In the second stage, hardness and cohesiveness were evaluated by compressing samples between lips followed by releasing the samples to determine the intensities of attributes. During the chewdown stage that panelists used to masticate the cooked rice, cohesiveness of mass, roughness of mass, and toothpull were evaluated. During the last stage, the panelists evaluated toothpack, loose particles, and residual film related to mouthfeel after eating cooked rice.
Rice (300 g) was washed using a tap water and then put into an electronic rice cookers (National, model SR-W10FN, National Co., Osaka, Japan) with 600 g of tap water (Meullenet, et al., 1999). Samples were transferred to glass bowls preheated at 75 ± 2oC, and the glass bowls were put
into Styrofoam cups and covered with watch glasses to minimize temperature change. Water and soda cracker were provided to individual panelists to clean their palate between samples. The panelists evaluated one sample at a time in individual booths under incandescent lighting. During the evaluation sessions, fifteen samples were presented at each session and twelve samples were presented at the last session with a random sample order. A warm-up sample
was presented to the panelists prior to the actual evaluations. Panelists used paper ballots and the 16-point category scale labelled from ‘0’ on the left side and ‘15’ on the right side.
Instrumental texture analysis
Temperature was closely monitored during the test because it could affect rice texture (Okabe, 1979). Room temperature was not effective for measuring texture of cooked rice (Meullenet, et al., 1998; Meullenet, et al., 1999). In addition, room temperature could be different from the temperature of cooked rice for descriptive analysis. In order to maintain temperature of the cooked rice same as the descriptive analysis, individual small batch cooking was applied. Briefly, milled rice (10.0 g) and water (17 g) were put into a 100 mL beaker and cooked using an electronic rice cooker (National, model SR-W10FN) under steam conditions. For uniform cooking, beakers were placed at the center of the cooker and had 1 cm distance from the side of the cooker. Water (350 mL) was added to the rice-cooker for equivalent heat transfer to the beakers. Rice was steamed for 30 min with the regular cooking option.
The measurement of cooked rice texture was performed using SSSA (Sitakalin and Meullenet, 2000). Extrusion cells were removed to be cleaned one at a time from the rice cooker. Instrumental testing was performed immediately after getting out of a beaker from the rice cooker. Instrumental texture measurement was conducted using a texture analyzer (model TA-XT2i, Texture Technologies, Scarsdale, NY, USA). The testing conditions were a 25 Kg load cell, 2.0 mm/s of cross-head speed, and 85 mm total distance. A typical force deformation curve and stages by SSSA is shown in Fig. 1. The curve was divided into four stages; packing, compression, extrusion, and tension (Fig. 1).
Statistical analysis
Unscrambler (version 7.5, CAMO, Throndheim, Norway) was used to generate predictive models in this study. PLSR was used for predicting descriptive sensory attributes from force-distance data of the texture profile analysis. Full cross-validation method was employed to evaluate model robustness. The JRM was employed to remove instrumental variables that created noise in the evaluations. The calibration model correlation coefficient (Rcal), full cross validation correlation coefficient (Rval), root mean square error of calibration (RMSEC), and root mean square error of prediction (RMSEP) and robustness (RMSEP/RMSEC) were presented to compare two predictive models (Lee, et al., 2008).
RESULTS AND DISCUSSION
et al., 2015a; Meullenet, et al., 1999). Predictive parameters for PLSR analysis and JRM were shown in Table 2. The robustness values for each attribute were close to 1 in Table 2; therefore, the statistical models in this study were appropriate (Lee, et al., 2008). For the attributes in
the initial stage, cohesion of bolus and adhesion to lips were well predicted by two statistical models. Cohesion of bolus (Rcal = 0.71) showed significant improvement of the model statistics by JRM (Rcal = 0.78). Especially, Rval (0.72) by the JRM was better than that (0.64) from Fig 1. A typical force deformation curve of cooked rice by the spectral stress strain analysis (From Lenjo and Meullenet, 2000, with the written permission from the editor of Discovery Magazine, The Student Journal of Dale Bumpers College of Agricultural, Food and Life Sciences, University of Arkansas).
Table 1: Attribute, definition and tasting procedure for cooked rice
Attribute Definition Tasting procedure
Initial stage
Cohesion of bolus The degree to which the unchewed sample holds
or ticks together Place ¼ teaspoon of sample in mouth and immediately evaluate how tightly the mass is sticking or holding together. Do not chew or manipulate!
Particle size The amount of space the particle takes up in
the mouth Place sample in center of mouth and evaluate
(How big are the particles?) Do not chew or manipulate!
Adhesion to lips The degree to which the sample adheres
to the lips Compress sample between lips, release and evaluate the degree to which the product remains on the lips. First bite/chew
Hardness The force required to compress the sample Compress or bite through sample one time with molars or incisors
Cohesiveness The amount the sample deforms rather than splits
apart, cracks or breaks Place sample between the molar teeth and compress fully. May also be done with incisors Chewdown
Cohesiveness of mass The amount that the chewed sample holds together Chew sample with molar teeth up to 15 times and evaluate (Loose mass---Tight mass)
Roughness of mass The amount of roughness perceived on the
surface of the chewed sample Chew the sample with molars and evaluate the irregularities on the surface of the sample mass Hint: You are looking for the large lumps, bumps,
hills and valleys, etc.
Toothpull The force required to separate the jaws during
mastication Chew sample 2-3 times and evaluate.
Residual
Residual film The amount and degree of residue felt by the
tongue when moved over the surface of the mouth Swallow the sample and feel the surface of the mouth with the tongue to evaluate Toothpack The amount of product packed into the crowns of
your teeth after mastication Chew sample 10-15 times, expectorate and feel the surface of the crowns of the teeth to evaluate Loose particles The amount of particles remaining in and on the
the PLSR. The RMSEC (0.43) and RMSEP (0.49) of the optimized model were lower than those from the full predictive model. This meant that the data are located close to the average of the data (RMSEC) and the predictive model (RMSEP). Adhesion to lips was the best predictive attributes by the texture analyzer. Rcal by PLSR was 0.75; while the Rval by the PLRS was lower as of 0.68. The JRM showed lower RMSEC and RMSEP than those values from the PLSR analysis. JRM showed better prediction for adhesion to lips than PLSR. Contrary to the cohesion of bolus and adhesion to lips, particle size was poorly predicted by optimized model (Rcal = 0.30). Optimization of the model resulted in a slight improvement in the correlation coefficient (Rcal = 0.46). Particle size was not closely related to the texture of cooked rice but related to the shape so that there was a low correlation coefficient between the results from the descriptive analysis and the texture analyzer. Kwak et al. (2015a) reported low correlation coefficients between instrumental measurements and descriptive attributes of aseptic-packaged cooked rice for indirect attributes such as color, transparency, and kernel size, which were the appearance rather than the texture attributes.
For the first bite/chew stage, hardness was well predicted by the texture analyzer (Rcal = 0.69) for the full model with a low RMSEC (RMSEC = 0.28, Table 2). The optimized model had a correlation coefficient of Rcal = 0.72 and RMSEC = 0.27, which showed slight improvement compared to the full model. The optimized predictive model showed better prediction cohesiveness. The correlation coefficient for the full model for cohesiveness was 0.44, while the optimized model had 0.69. Improvement of
the model statistics was shown removing outliers of the results from the texture analyzer throughout the JRM. The RMSEC and RMSEP became lower as the JRM applied for cohesiveness.
In chewdown stage, the attributes were moderately estimated by presenting 0.51 - 0.62 of Rcal. Cohesiveness of mass and toothpull were slightly better by the JRM when looking at Rcal and Rval (Table 2). Removing outliers were not well effective for these attributes. The full optimized model showed better prediction of roughness of mass (Rcal = 0.62) than the optimized model (Rcal = 0.51). Since roughness of mass was the attributes for the perception of surface of cooked rice mass in mouth (Table 1), it was close to the surface feeling during masticating of the sample and not directly related to the texture characteristics measured by the texture analyzer.
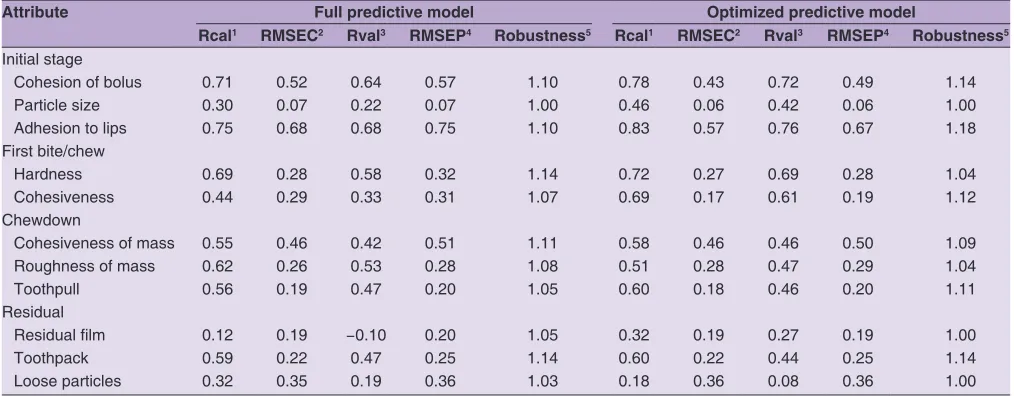
For residual attributes, residual film and loose particles were poorly estimated by the PLSR and JRM models (Rcal = 0.12 – 0.32, Table 2). The lower Rcal values would be that these attributes were not directly related to the texture parameters from the texture analyzer. Residual feeling and loose particles (Table 1) were almost impossible to estimate by the texture analyzer. These characteristics were the perception by the mouth and tongue rather than the physical characteristics measured by the texture analyzer. Toothpack was moderately estimated by the PLSR (Rcal = 0.59) and the JRM (Rcal = 0.60). Since the definition of toothpack was ‘the amount of product packed into the crowns of your teeth after mastication (Table 1)’ it was related to the stickiness characteristic, which can be measured by the texture analyzer. The optimized model, Table 2: Full and optimized predictive model statistics of rice sensory texture attributes by partial least square regression
(Part of the table from Lenjo and Meullenet, 2000, with the written permission from the editor of Discovery Magazine, The Student Journal of Dale Bumpers College of Agricultural, Food and Life Sciences, University of Arkansas)
Attribute Full predictive model Optimized predictive model
Rcal1 RMSEC2 Rval3 RMSEP4 Robustness5 Rcal1 RMSEC2 Rval3 RMSEP4 Robustness5
Initial stage
Cohesion of bolus 0.71 0.52 0.64 0.57 1.10 0.78 0.43 0.72 0.49 1.14
Particle size 0.30 0.07 0.22 0.07 1.00 0.46 0.06 0.42 0.06 1.00
Adhesion to lips 0.75 0.68 0.68 0.75 1.10 0.83 0.57 0.76 0.67 1.18
First bite/chew
Hardness 0.69 0.28 0.58 0.32 1.14 0.72 0.27 0.69 0.28 1.04
Cohesiveness 0.44 0.29 0.33 0.31 1.07 0.69 0.17 0.61 0.19 1.12
Chewdown
Cohesiveness of mass 0.55 0.46 0.42 0.51 1.11 0.58 0.46 0.46 0.50 1.09
Roughness of mass 0.62 0.26 0.53 0.28 1.08 0.51 0.28 0.47 0.29 1.04
Toothpull 0.56 0.19 0.47 0.20 1.05 0.60 0.18 0.46 0.20 1.11
Residual
Residual film 0.12 0.19 −0.10 0.20 1.05 0.32 0.19 0.27 0.19 1.00
Toothpack 0.59 0.22 0.47 0.25 1.14 0.60 0.22 0.44 0.25 1.14
Loose particles 0.32 0.35 0.19 0.36 1.03 0.18 0.36 0.08 0.36 1.00
however, did not show significant increase in the prediction of toothpack.
When looking at the attributes in each stage, the texture measurements in the initial, first bite/chew and chewdown stages could be estimated more accurately than the residual stage. Cohesion of bolus, adhesion to lips, and hardness showed strong Rcal based on the JRM (Rcal > 0.7). In addition, cohesiveness showed Rcal close to 0.7. Texture sensory attributes for the chewdown stages showed moderate correlations with Rcal of 0.51 to 0.60. The subjects evaluated the attributes in chewdown stage after several mastications; therefore, one-bite texture measurement system in this study might not reflect the attributes in chewdown stage accurately. Lee et al. (2009) also reported that such attributes being assessed throughout the chewdown stages as hardness of mass, cohesiveness of mass and number of chews were better predicted by the mastication assessment systems in poultry. The SSSA might have higher accuracy for estimating the texture sensory attributes at the early biting/chewing stage of cooked rice.
CONCLUSION
Two regression models – PLSR and JRM – were applied to estimate sensory texture attributes of cooked rice using the results from the texture analyzer. The JRM showed slightly stronger relations than the PLSR when estimating sensory attribute using the texture analyzer. Removing outliers from the full optimized model, PLSR, was proven to be effective to increase calibration model correlation coefficient and to decrease root mean square error of calibration in general. Due to the limitation of the texture analyzer, statistical models for estimating sensory texture attributes were appropriate only for sensory texture attributes directly related to the texture characteristics. Human evaluation is necessary for non-texture attributes of cooked rice. Throughout this study, cohesion of bolus, adhesion to lips, hardness, cohesiveness, toothpull and toothpack, which were directly related to the texture parameters, were able to estimate their intensities using the texture analyzer.
Authors’ contributions
Study design and management: J. F. M. Conducted the experiments: M. L. Analysis and interpretation of data: M. L, H. S. K., Y. L. Drafting of manuscript: H. S. K. Critical revision: Y. L., J. F. M.
REFERENCES
Chen, J., C. Karlsson and M. Povey. 2005. Acoustic envelope detector for crispness assessment of biscuits. J. Texture. Stud. 36: 139-156.
Jeong, Y., Y. A. Jang, Y. H. Chang and Y. Lee. 2013. Prediction of consumer acceptability of potato chips with various moisture contents using survival analysis. Food Sci. Biotechnol. 22: 1621-1627.
Juliano, B. B., C. M. Perez, E. P. Alyo-Shing, V. B. Ramanov, A. B. Blakeney, L. A. Welsh, N. H. Choudhyry, L. L. Delgado, T. IwasakI, N. Shibuya, A. P. Mossman, B. Siwi, D. S. Damardjati, H. Suzuki and H. Kimura. 1984. International cooperative test on texture of cooked rice. J. Texture Stud. 15: 357-376.
Kwak, H. S., M. Kim, Y. Lee and Y. Jeong. 2015a. Identification of key sensory attributes for consumer acceptance and instrumental quality of aseptic-packaged cooked rice. Int. J. Food Sci. Technol. 50: 691-699.
Kwak, H. S., M. Kim and Y. Jeong. 2015b. Physicochemical properties and determination of key instrumental quality measurement parameters of frozen-cooked rice by correlating consumer acceptance. J. Food Qual. 38: 192-200.
Lee, Y. S., C. M. Owens and J. F. Meullenet. 2008. A novel laser air puff and shape profile method for predicting tenderness of broiler breast meat. Poult. Sci. 87: 1451-1457.
Lee, Y. S., C. M. Owens and J. F. Meullenet. 2009. Tenderness perception of poultry major pectoralis muscle during mastication. J. Food Sci., 74: S413-S422.
Lee, Y., R. Xiong and J. F. Meullenet. 2014. Prediction of sensory texture of broiler breast meat using instrumental spectral stress– strain analysis. Int. J. Food Sci. Technol. 49: 2269-2275. Lenzo, M. and J. F. Meullenet. 2000. Prediction of rice sensory texture
attributes using spectral strain stress analysis and the jack-knife model optimization method. Discov. Mag. 1: 40-46.
Martens, H. and M. Martens. 2001. Multivariate analysis of quality. An Introduction. Wiley, Chichester, UK.
Meilgaard, M., G. V. Civille and B. T. Carr. 1999. Sensory Evaluation Techniques. 3rd ed. CRC Press, Inc., Boca Raton, Florida, USA.
Meullenet, J. F. C., J. Gross, B. P. Marks and M. Daniels. 1998. Sensory descriptive texture analyses of cooked rice and its correlation to instrumental parameters using an extrusion cell. Cereal Chem. 75: 714-720.
Meullenet, J. F. C., C. Sitakalin and B. P. Marks. 1999. Prediction of rice texture by spectral stress strain analysis: a novel technique for treating instrumental extrusion data used for predicting sensory texture profiles. J. Texture Stud. 30: 435-450.
Nishinari, K. 1996. New texture modifiers for foods, interactions among different food hydrocolloids and their potential of application. Kagaku Seibutsu. 34: 197-204.
Okabe, M. 1979. Texture measurement of cooked rice and its relationship to the eating quality. J. Texture Stud. 10: 131-152. Sitakalin, C. and J. F. C. Meullenet. 2000. Prediction of cooked rice