Original Research Article
Impact of socio-demographic variables and morbid conditions on
general health component of perceived health using SF-36 form
Sanjeev K. Sharma, Atul K. Singh*, Dharmendra K. Gupta,
Shashi Saxena, Meenakshi Singh, Shyam B. Gupta
INTRODUCTION
India is going through a period of transition, both epidemiological as well as demographic and there is an increasing prevalence of non communicable diseases (NCDs) as a result of industrialization, socio-economic development, urbanization, changing lifestyles and dietary habits etc., thereby resulting in a growing burden of NCD’s.1
NCDs are a leading cause of deaths both in
developing and developed countries, nearby two out of every three deaths on the planet are now attributed to NCDs. United Nations (UN) estimates that by 2030, 52 million people will die annually due to NCDs i.e. five times as many deaths as the estimated deaths toll for infectious diseases.2 These diseases like hypertension, diabetes mellitus not only deteriorates objective health but also influence one's perception of health which is known as self perceived health (SPH).3,4 Perceived health
ABSTRACT
Background: Perceived health (PH) is a subjective assessment of the health and it is a strong, independent and reliable predictor of morbidity, mortality. It includes so many aspects that are difficult to capture clinically such as incipient disease, physiological, psychological reserves. We assessed the impact of diabetes mellitus (DM), hypertension (HTN), co-morbidity and other associated factors on the general health (GH) dimension of the PH of the patients attending the outpatient department (OPD), Inpatient department (IPD), rural health training centre (RHTC) and urban health training centre (UHTC) of Shri Ram Murti Smarak Institute of Medical Sciences (SRMS, IMS), Bareilly.
Methods: PH status of the patients was assessed by the GH dimension of the physical component summary of PH using the 36-Items short form health survey (SF-36).
Results: The impact of morbidity deteriorate the GH score but hypertensive patients scored poor results as compared to those with DM and comorbid patients (p>0.05). Age was inversely related with GH scores but male gender, higher education (p<0.05) and good occupation were all associated with higher GH score. There was not much influence of geographical area on the GH scores but urban score slightly better and the association was insignificant (p>0.05).
Conclusions: Male young patients from urban area, educated and good job performed better score for GH and association was significant for education and occupation. The presence of morbidity and co-morbid condition deteriorate the GH of the patients. The impact of various socio-demographic factors on the PH status was also evident in the study.
Keywords: Self-perceived health, General health, Diabetes mellitus, Hypertension, Co-morbidity
Department of Community Medicine, Shri Ram Murti Smarak Institute of Medical Sciences, Bareilly, U.P., India
Received: 08 March 2019
Revised: 25 March 2019
Accepted: 27 March 2019
*Correspondence:
Dr. Atul K. Singh,
E-mail: [email protected]
Copyright: © the author(s), publisher and licensee Medip Academy. This is an open-access article distributed under the terms of the Creative Commons Attribution Non-Commercial License, which permits unrestricted non-commercial use, distribution, and reproduction in any medium, provided the original work is properly cited.
is subjective or self-assessment of their health and includes many aspects that are difficult to capture clinically, such as incipient disease, disease severity, physiological and psychological reserves and social functions. Till now more emphasis was given to the objective health by policy planners and health care providers but now there is a need to assess the subjective health also because it is strong, independent and reliable indicator ofmortality as well as morbidity as shown by many studies.5-7 There are few such type of studies in India, none in the Uttar Pradesh region. Hence it was planned to carry out this study to initiate an innovative & inexpensive approach. The study was planned to assess the impact of diabetes mellitus, hypertension, co-morbidity and of various socio demographic factors on general health of patients.
METHODS
This facility based cross-sectional observational study was conducted among registered subjects of diabetes mellitus (DM), hypertension (HTN) and co-morbid (DM+HTN) patients aged ≥ 35 years attending the OPD, IPD, RHTC and UHTC of Shri Ram Murti Smarak Institute of Medical Sciences, Bareilly. The sample included all patients aged 35 years and above suffering from diabetes mellitus, hypertension or with co-morbidity for more than 6 months, who attended the OPD, IPD, RHTC and UHTC of SRMS, IMS during the study period
from 1st June 2012 –31st May 2013. So, a total of 1130 subjects participated in the study after considering the exclusion criteria i.e. patients Suffering from DM/HTN for less than 6 months, age <35 years, Type 1 DM, gestational DM, impaired glucose tolerance (IGT).
Two forms were used to collect the required data. The first was a checklist containing items of socio-demographic and other epidemiological correlates. The second was Hindi translated and patient friendly modified version of RAND SF-36 questionnaire, used to assess the general health. It included 6 items under general health dimension of self perceived health. Weightage was given for each question according to response i.e. 0 for worst and 100 for best performance, then the average score was calculated of all 6 questions which is the average general health score of individual patient. Analysis was performed using SPSS version 20.0 and stat Direct Ltd version 2-70-800 software with level of significance set at 0.05. Chi-square test was applied wherever applicable.
RESULTS
A total of 1130 subjects participated in the study in which the rural-urban distribution revealed rural preponderance as majority of the subjects belong to rural area (53%) compared to urban (47%). It was also observed that majority (63.7%) were of non-geriatric age group (<60 years) while 36.3% belonged to geriatric age group (Table 1).
Table 1: Distribution of study subjects according to age, sex and geographical area.
Age group (years)
Urban Rural
Grand total
Male Female Total Male Female Total
No. % No. % No. % No. % No. % No. % No. %
35-40 32 23.53 20 14.71 52 38.24 46 33.82 38 27.94 84 61.76 136 12.04
40-45 35 27.34 25 19.53 60 46.88 36 28.13 32 25 68 53.13 128 11.33
45-50 37 22.16 30 17.96 67 40.12 49 29.34 51 30.54 100 59.88 167 14.78
50-55 45 25.42 33 18.64 78 44.07 66 37.29 33 18.64 99 55.93 177 15.66
55-60 38 33.93 23 20.54 61 54.46 30 26.79 21 18.75 51 45.54 112 9.91
60-65 52 27.51 45 23.81 97 51.32 60 31.75 32 16.93 92 48.68 189 16.73
65-70 30 27.78 22 20.37 52 48.15 32 29.63 24 22.22 56 51.85 108 9.56
70-75 22 30.99 15 21.13 37 52.11 21 29.58 13 18.31 34 47.89 71 6.28
>75 17 40.48 10 23.81 27 64.29 8 19.05 7 16.67 15 35.71 42 3.72
Total 308 27.26 223 19.73 531 46.99 348 30.8 251 22.21 599 53.01 1130 100
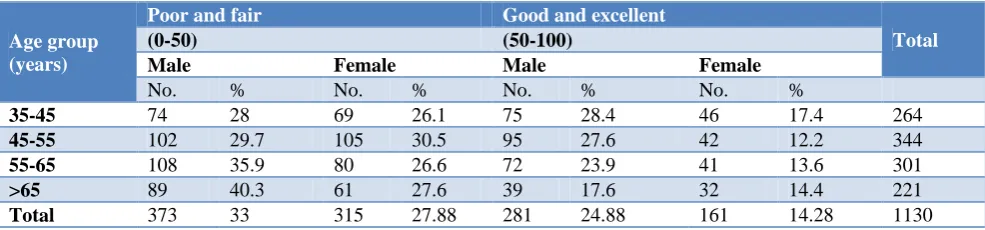
Table 2: General health scoring according age and sex.
Age group (years)
Poor and fair Good and excellent
Total
(0-50) (50-100)
Male Female Male Female
No. % No. % No. % No. %
35-45 74 28 69 26.1 75 28.4 46 17.4 264
45-55 102 29.7 105 30.5 95 27.6 42 12.2 344
55-65 108 35.9 80 26.6 72 23.9 41 13.6 301
>65 89 40.3 61 27.6 39 17.6 32 14.4 221
It is also evident that out of the 1130 total subjects, majority (57.90%) was of male as compare to female (42.10%) and on the basis of average GH scoring, as age advances male scoring better as compare to female subjects (Table 2).
GH score of the subjects according to their geographical area which shows that rural preponderance (53%) was evident in the study and urban participant score better than rural but again results are not significant on statistical analysis (p>0.05) (Table 3).
The GH scoring according occupation of participant and it is evident that higher qualified person score better as compare to poor qualification, it is also confirmed by getting significant results on application of chi square test (p<0.05) (Table 4).
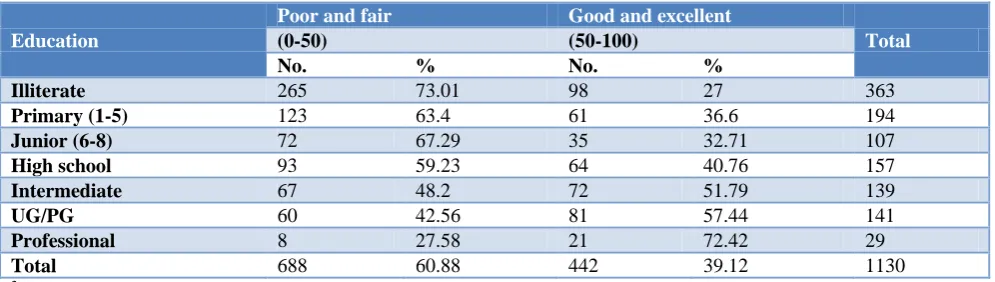
On observation of the average GH scoring as per the education level of study subjects, as education improve GH scored more in good and excellent group i.e. intermediate, UG/PG and professor scored good & excellent in higher percentage and it found highly significant on statistical analysis (p<0.05) (Table 5).
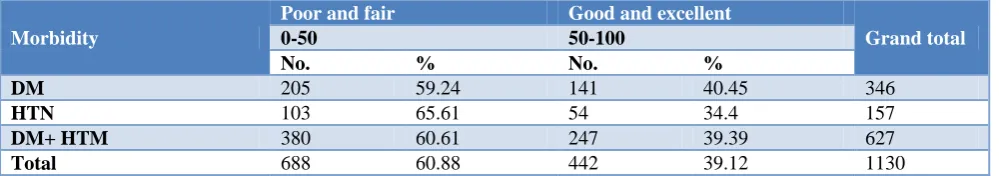
On comparing the respondents by morbidity (DM, HTN or DM+HTN) and GH average score in Table 6, it was observed that overall majority were those subjects who had either DM or dual morbidity in both score categories as compared to those who had HTN alone. It was further observed that the morbidity either DM or HTN or both had significant impact on GH scoring but in present study hypertensive patient scored poor but it is insignificant (p>0.05) on application of statistics (Table 6).
Table 3: General health scoring according geographical area.
Geographical area
Poor and fair Good and excellent
Total
(0-50) (50-100)
No. % No. %
Urban 313 58.9 218 41 531
Rural 375 62.6 224 37.4 599
Total 688 60.88 442 39.12 1130
2
=1.43, df=1, p=0.2318.
Table 4: General health scoring according their occupation.
Occupation
Poor and fair Good and excellent
Total
(0-50) (50-100)
No. % No. %
Unemployed 53 55.79 42 44.21 95
Unskilled worker 87 72.5 33 27.5 120
Semiskilled Worker 8 33.33 16 66.67 24
Skilled worker 241 69.05 108 30.95 349
Clerical/ shop owner/ farmer 294 56.76 224 43.24 518
Semi profession 2 40 3 60 5
Profession 3 15.79 16 84.21 19
Total 688 68.88 442 39.12 1130
2
=46.1, df=6, p=0.000.
Table 5: General health scoring according their education.
Education
Poor and fair Good and excellent
Total
(0-50) (50-100)
No. % No. %
Illiterate 265 73.01 98 27 363
Primary (1-5) 123 63.4 61 36.6 194
Junior (6-8) 72 67.29 35 32.71 107
High school 93 59.23 64 40.76 157
Intermediate 67 48.2 72 51.79 139
UG/PG 60 42.56 81 57.44 141
Professional 8 27.58 21 72.42 29
Total 688 60.88 442 39.12 1130
2
Table 6: General health scoring according their morbidity.
Morbidity
Poor and fair Good and excellent
Grand total
0-50 50-100
No. % No. %
DM 205 59.24 141 40.45 346
HTN 103 65.61 54 34.4 157
DM+ HTM 380 60.61 247 39.39 627
Total 688 60.88 442 39.12 1130
2
=1.88, df=2, p=0.3906.
DISCUSSION
In this study, age inversely influence the GH dimension, as the age advances the score decreased, similar findings was obtained in a study by Wang et aland Joshi et al.3,4 Baert et al also reported in their study carried out in 25 European Countries that age inversely influenced the GH dimension.8 In present study the relationship between GH average scoring and sex was found to be insignificant (p>0.05). Gender influence was evident as average score for GH was better achieved by males as compared to females. Similar findings were also observed in various other studies.9,10
In the present study, education significantly influenced the general health (GH) dimension of physical component summary (PCS) of perceived health. As the education level improve, the average GH score increases in good and excellent category while it decreases in poor and fair. The findings of this study are consistent with the study carried out in India in which illiterate and below matriculates were less likely found to perceive their health as good or excellent as compared to higher educated ones.11 The results also collaborates with the findings of other studies in which educational attainment was found to be significant determinant of perceived health.3,8,9,12-14
In case of occupation which is also influence the GH dimension of PCS significantly and found that semi-professional and semi-professional group scored better as compare to unemployed, unskilled group of occupation. Same results are also found in the study done by Wang et al.3 Contrary to our study, Gueorguieva et al did not find any significant impact of occupation on changes in health.15 Demirichyan et al also found that unemployed subjects scored poor as compare to their counterparts.16
In present study, there was no significant influence of geographical area for GH but urban subjects scored slightly better as compare to rural counterpart while Grigoriev et al in his study in Belarus city of Russia found the opposite results.17 Similar results found by the Bakshi et al and Babones et alin their study reported that individuals residing in rural area are less likely to perceive their health as good or excellent as compared to their urban counterparts.11,13
In the study, the impact of morbidity either due to DM or HTN alone or co-morbidity (DM+HTN) was not found to be significant for GH dimension. While in present study hypertensive patients scored more poor results. So many studies shows the same results.14,18-20
CONCLUSION
Male patients from the younger age group with urban background with good education and good job performed better score for general health and their association was significant for education and occupation, while geographical area and morbidity had insignificant impact. SPH is considered to be a predictive variable of one’s own morbidity and mortality and is an inexpensive and non-interventional method which is presumed to be far better than physician’s evaluation as depicted by literature review on the topic.
Recommendations
The present study provides preliminary understanding of the factors influencing the SPH in this country with enormous socio cultural diversities, further longitudinal studies should be planned to explore more qualitative as well as quantitative data and other related variables to provide better insight into the factors that hinder or promote health and wellbeing. There is a need to frame a policy to include the subjective part of health in all health related studies because it is simple, inexpensive and more valuable than physician’s evaluation.
Limitation
Due to paucity of literature & research being done on SPH in India, I had to compare my results with foreign studies.
Relevance of the study
ACKNOWLEDGEMENTS
Dedicated to late Prof. V.P. Shrotriya, Ex Principal, SRMS-IMS and Ex principal S.N. Medical College Agra. I am thank full to Dr. S.B. Gupta principal SRMS IMS Bareilly for all guidance, proposition and cooperation in writing this paper.
Funding: No funding sources Conflict of interest: None declared
Ethical approval: The study was approved by the Institutional Ethics Committee
REFERENCES
1. Reddy KS, Yusuf S. Emerging epidemic of
cardiovascular diseases in developing countries. Circulation. 1998;97:596-601.
2. Suarez R. The Silent, Deadly Epidemic of Non-Communicable Disease. 2011; Available at: http://www.pbs.org/newshour/rundown/2011/09/the -silent-deadly-epidemic-of-non-communicable-disease.html. Accessed on 3 January 2019.
3. Wang R, Zhao Y, He X, Ma X, Yan X, Sun Y, et al.
Impact of Hypertension on health-related quality of life in a population based study in Shanghai, China. Public Health. 2009;123:534-9.
4. Joshi K, Kumar R, Avasthi A. Morbidity profile and
its relationship with disability and psychological distress among elderly people in Northern India. Int J Epidemiol. 2003;32(6):978-87.
5. Kaplan GA, Goldberg DE, Everson SA, Cohen RD,
Salonen R, Tuomilehto J, et al. Perceived health status and morbidity and mortality: evidence from the Kuopio ischaemic heart disease risk factor study. Int J Epidemiol. 1996;25:259–65.
6. Fylkesnes K. Determinants of health care
utilization—visits and referrals. Scand J Soc Med. 1993;21:40–50.
7. Idler EL, Benyamini Y. Self-rated health and
mortality: A review of twenty seven community studies. J Health Soc Behav. 1997;38:21–37.
8. Baert K, Noore BD. Perception of health and access
to health care in theEU-25 in 2007. Statistics in Focus Eurostate. 2009:24.
9. Prusty RK, Kumar A, Gogoi M. Pattern of Self-perceived Health, Immobility and Hospitalization among Elderly in India. Middle East J Age Ageing. 2011;8(6):8-27.
10. RGI-Registrar General of India. Sample
Registration System Statistical Report 2006. New Delhi: 2007.
11. Bakshi S, Pathak P. What makes them feel
healthier? The correlates of self-perceived health among older adults in India [MPRA Paper No. 40541] 2012: 1-15.
12. International Institute for Population Sciences & World Health Organization (IIPS and WHO). Health System Performance Assessment, 2006. 13. Babones SJ. The consistency of self-rated health in
comparative perspective. Public Health.
2009;123:199-201.
14. Self-Rated Fair or Poor Health Among Adults With
Diabetes United States, 1996-2005 Free JAMA 2006;296(24):2917-20.
15. Gueorguieva R, Sindelar JL, FalbaTA, Fletcher J M, Keenan P, WuR, et al. The Impact of Occupation on
Self-Rated Health: Cross-Sectional and
Longitudinal Evidence from the Health and Retirement Survey. J Gerontol B Psychol Sci Soc Sci. 2009;64(1):118–24.
16. Grigoriev P, Grigorieva O. Self-perceived health in Belarus:evidence from the income and expenditures of household’s survey. Demographic Res. 2011;24(23):561-78.
17. Demirchyan A, Petrosyan V, Thompson ME.
Gender differences in predictors of self-rated health in Armenia: a population-based study of an economy in transition. Int J Equity Health. 2012;11:67.
18. Thommasen H, Zhang W. Health-related quality of life and type 2 diabetes: A study of people living in
the Bella Coola Valley Issue. BCMJ.
2006;48(6):272-8
19. Lee MH, So ES. Impact of Hypertension-Related Comorbidity on Health-Related Quality of life:A Population -Based survey in South Korea. Asia Pacific of J Public Health. 2012;24(5):753-63. 20. Stewart AL, Greenfield S, Hays RD, Wells K,
Rogers WH, Berry SD et al. Functional status and well-being of patients with chronic conditions. JAMA. 1989;262:907-13.