Original Research Article
Prevalence of risk factors and 10 year risk estimation of cardiovascular
diseases among rural population of Mysuru, Karnataka
Prathyusha Kadiyala
1*, M. Renuka
2, Praveen Kulkarni
2, M. R. Narayanamurthy
2INTRODUCTION
Cardio vascular diseases (CVD) comprise a group of diseases of the heart and the vascular system. The major conditions are ischemic heart disease (IHD), hypertension and cerebrovascular disease (stroke).1
Non-communicable diseases (NCD) accounts for 68% of global deaths with cardiovascular diseases being the leading cause (46% of all NCD deaths).2 South East
Asian Region (SEAR) accounts for 20.8% of total CVD deaths. Compared with all other countries, India suffers the highest loss in potentially productive years of life, due to deaths from CVD in people aged 35-64 years.1
India is currently experiencing a rapid epidemiologic transition. The escalating epidemic of NCD in India is a public health challenge. WHO estimates that these diseases (with mostly preventable risk factors) account for 60% of all deaths and significant morbidity in India.3
ABSTRACT
Background: Cardiovascular diseases (CVD) are leading cause of death among non-communicable diseases (NCD). Many people in developing countries are detected late and die from NCDs, often in their most productive years. Prevention of CVD is an essential step to control the epidemic of NCDs. Thus, this study was undertaken to assess the prevalence of risk factors and to estimate the risk of CVD in the next 10 years.
Methods: A community based cross-sectional study was conducted among 608 individuals aged ≥40 years in rural area of Mysuru. Data was collected using Semi structured questionnaire and 10 year CVD risk was estimated using World Health Organization/International Society of Hypertension (WHO/ISH) risk prediction charts.
Results: A total of 608 study participants (mean age 56.76±11.07 years; male:female ratio 1.2:1) were included in the study. The prevalence of tobacco (32.9%) and alcohol (20.1%) consumption was significantly higher among males compared with females. Hypertension, diabetes and obesity prevalence was 39.5%, 15.5% and 28.1% respectively. One-fifth of population had moderate (20-39%) estimated risk and 7.4% had very high (≥40%) risk of developing CVD event in next 10 years. The estimated high risk (≥30%) of CVD events was statistically higher among individuals who were non-literates, unemployed, physically inactive, middle and above socioeconomic status.
Conclusions: In the present study, CVD risk factors and estimated risk of CVD were significantly prevalent in the rural population. The use of simple tools like WHO/ISH risk prediction charts to estimate CVD risk is recommended in low resource settings at Community level, as the benefit of screening outweighs the risk of missing an opportunity to prevent CVD.
Keywords: Cardiovascular disease, Risk factors, Estimated ten year CVD risk, WHO/ISH risk prediction chart, Prevention
Department ofCommunity Medicine, 1ACS Medical College, Chennai, Tamilnadu, 2Jagadguru Sri Shivarathreshwara (JSS) Medical College, Mysuru, Karnataka, India
Received: 20 December 2018
Accepted: 30 January 2019
*Correspondence:
Dr. Prathyusha Kadiyala,
E-mail: [email protected]
Copyright: © the author(s), publisher and licensee Medip Academy. This is an open-access article distributed under the terms of the Creative Commons Attribution Non-Commercial License, which permits unrestricted non-commercial use, distribution, and reproduction in any medium, provided the original work is properly cited.
Despite the reduction in the incidence of coronary heart disease (CHD) in developed nations, the scenario in developing nations poses a serious challenge.4 Most reviews have shown that low Socio-Economic Status (SES) and/or living in low and middle-income countries (LMIC) increased the risk of developing cardiovascular diseases.5
Over three-quarters of CVD deaths take place in LMIC.6 People in low and middle-income countries often do not have the benefit of integrated primary health care programmes for early detection and treatment of people with risk factors compared to people in high-income countries. They have less access to effective and equitable health care services which respond to their needs.2
Despite intervention in the form of a national programme on NCD, the efforts are nascent and need to be up scaled and integrated for diseases like diabetes, cardiovascular ailments and stroke. NCD require a renewed focus on prevention and management.
The most important behavioural risk factors of heart disease and stroke are the unhealthy diet, physical inactivity, tobacco and alcohol consumption. The effects of behavioural risk factors may show up in individuals as raised blood pressure, raised blood glucose, raised blood lipids, and overweight and obesity. These “intermediate risks factors” can be measured in primary care facilities and indicate an increased risk of developing a heart attack, stroke, heart failure and other complications. There are also a number of underlying determinants of CVDs or "the causes of the causes". These are a reflection of the major forces driving social, economic and cultural change–globalization, urbanization and population ageing. Other determinants of CVDs include poverty, stress and hereditary factors.6
CVDs which were once considered to be more common in developed countries, urban areas, high socioeconomic class, older age and males is no longer a true situation as incidence is increasing in low and middle-income countries, rural areas, affecting younger adults and women also. There is an immense need for creating awareness among the population to adopt a healthy lifestyle and behavioural changes, early detection of risk factors like hypertension, diabetes, high cholesterol and management of them by adopting necessary preventive and therapeutic measures. Along with the early detection of risk factors, estimating the risk of the cardiovascular event in the next 10 years will help in making individuals aware about the measures they need to take to prevent any untoward cardiovascular events in future.
In view of interplay of multiple factors in the etiology of CVDs the WHO and the ISH have formulated WHO/ISH cardiovascular risk prediction charts for use in different sections of the globe using the best available mortality and risk factor data.7 Different charts are available for the
14 WHO epidemiological sub regions around the world. These colour coded charts predict 10 year risk of fatal or non-fatal major cardiovascular event (myocardial Infarction or stroke).
As WHO/ISH cardiovascular risk prediction charts are graphical and easy to understand, the general population can be explained about their individual risk, and hence motivated to adopt necessary preventive measures to delay any untoward outcome.8
While the need for effective CVD prevention strategies and health system strengthening to combat CVD is glaringly obvious, there is very little actual research output especially in rural areas of India. In this context, the present study intended to screen rural population for CVD risk factors and estimate the risk for the cardiovascular event using WHO/ISH risk prediction charts which help in motivating them to adopt necessary preventive or therapeutic measures to prevent any adverse cardiovascular events.
METHODS
A community based cross-sectional study was conducted over a period of twelve months (January 2016 to December 2016). The study population was selected from 15 villages under primary health centre (PHC) Hadinaru (population 28,652) and 8 villages under PHC Suttur (population 13,609) which are rural field practice areas of JSS Medical College. The sample size was 543, calculated based on the prevalence of hypertension (CVD risk factor) in rural Karnataka of 14.96% with 3% absolute precision and confidence level of 95%.9 Adding a non-response rate of 10% i.e 54, the sample size required was 597. The required sample was divided among 23 villages using population proportion to size. From each village, houses were selected using systematic random sampling and participants aged 40 years and above were included in the study. In total, 608 individuals participated in the study. People who had established coronary heart disease, stroke or other atherosclerotic diseases and unavailable for two consecutive visits to the village were excluded from the study.
The study was approved by the Institutional Ethical Committee. After obtaining written informed consent from the participants, data on sociodemographic variables were obtained using semi-structured questionnaire.
and the top of the iliac crest. Hip circumference was measured at the level around the widest portion of the buttocks using a non-stretchable tape. Subjects with a waist circumference of ≥102 cm (men); ≥88 cm (Women) and Waist to Hip Ratio (WHR) ≥0.90 cm (Men); ≥0.85 cm (women) were said to have abdominal obesity or at substantially increased risk of metabolic complications.12 Two measurements of blood pressure were taken (first reading after 5 min of rest and the second at the end of interview) using a mercury sphygmomanometer in sitting position in the right arm with appropriate size cuff. Average of two readings was taken as final reading.13 Hypertension is defined as systolic blood pressure (SBP) of ≥140 mmHg and/or diastolic blood pressure (DBP) of ≥90 mmHg and/or history of hypertension and on anti-hypertensive medications. Pre hypertension is defined as SBP between 120-139 and DBP of 80-89 mmHg.14 Random capillary blood glucose (RCBG) was collected under aseptic precautions using Accucheck glucometer. An individual was diagnosed as diabetic if random capillary blood glucose ≥200 mg/dl and/or with previous history of diabetes and on anti-diabetic medications. An individual is diagnosed as impaired glucose tolerance (IGT) if random capillary blood glucose is ≥140 mg/dl and <200 mg/dl.15
Risk factors such as tobacco and alcohol consumption, family history of CVD, history of DM and hypertension, type of diet (Vegetarian or mixed) was elicited. WHO global physical activity questionnaire (GPAQ) was used to assess physical activity and participants were categorized based on the total Metabolic equivalents/week (MET/week) as physically inactive (<600 MET/week) and physically active (≥600 MET/ week).16 Psycho-social stress was estimated by Gurmeet Singh’s presumptive stressful life events scale (PSLES) and classified as no stress (score 0-40), mild/moderate stress (41-200) and severe stress (>200).17 SEAR-D specific WHO-ISH Risk prediction chart without cholesterol set was used to estimate the individual’s 10 year risk of a fatal or non-fatal major cardiovascular event (Myocardial Infarction or stroke).7 The variables included in estimating risk were age, sex, blood pressure, smoking status and presence or absence of diabetes mellitus. The ten year risk was classified into five levels as >10%; 10 to <20%; 20 to <30%; 30 to <40%; and >40% risk.
Study participants who were diagnosed with hypertension and/or diabetes were referred to the physician for the confirmatory diagnosis and management. Counseling was given to the participants about healthy lifestyle such as cessation of tobacco and alcohol use, increased physical activity, healthy diet etc.
The data obtained was coded and entered into Microsoft excel and analyzed using SPSS software version 22. Descriptive statistics such as frequencies and percentages; mean and standard deviation were calculated. Inferential statistics like ANOVA and
Chi-square test were applied. The statistical significance was evaluated at 5% level of significance.
RESULTS
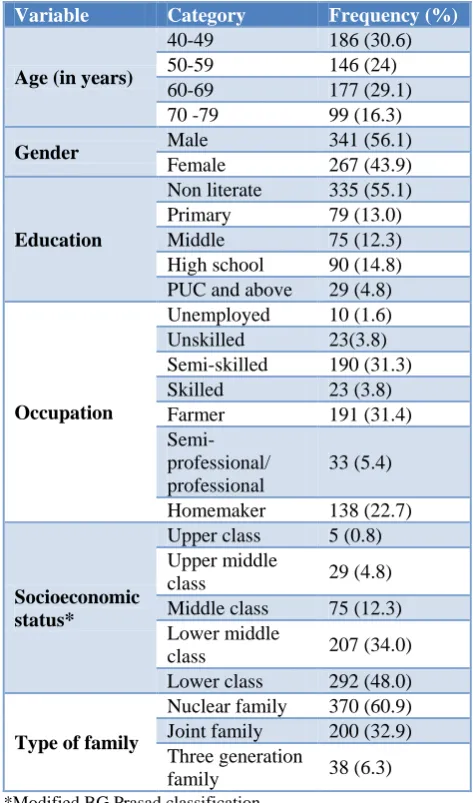
Table 1 represents the Sociodemographic characteristics of the study participants. Mean age of the study population was 56.76±11.07 years with male:female ratio of 1.2:1. More than half of them were non literate (55.1%) and belonged to lower or lower middle (62.7%) socioeconomic class. Majority of them were farmers or semiskilled by occupation and belonged to Nuclear families.
Table 1: Sociodemographic characteristics of the study participants (N=608).
Variable Category Frequency (%)
Age (in years)
40-49 186 (30.6) 50-59 146 (24) 60-69 177 (29.1) 70 -79 99 (16.3)
Gender Male 341 (56.1)
Female 267 (43.9)
Education
Non literate 335 (55.1) Primary 79 (13.0) Middle 75 (12.3) High school 90 (14.8) PUC and above 29 (4.8)
Occupation
Unemployed 10 (1.6) Unskilled 23(3.8) Semi-skilled 190 (31.3) Skilled 23 (3.8) Farmer 191 (31.4)
Semi-professional/ professional
33 (5.4)
Homemaker 138 (22.7)
Socioeconomic status*
Upper class 5 (0.8) Upper middle
class 29 (4.8) Middle class 75 (12.3) Lower middle
class 207 (34.0) Lower class 292 (48.0)
Type of family
Nuclear family 370 (60.9) Joint family 200 (32.9) Three generation
family 38 (6.3)
*Modified BG Prasad classification
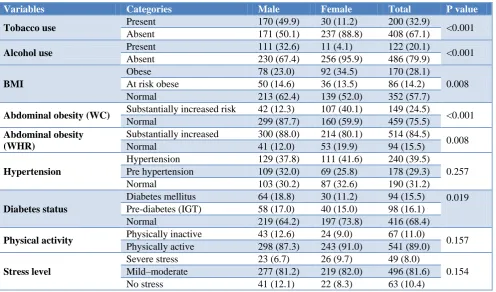
was 37.8% and 41.6%, respectively, but the difference was not statistically significant (p=0.275). The higher proportion of females has obesity and abdominal obesity determined by WC compared to males and the difference was statistically significant. However at risk obese and
abdominal obesity determined by WHR was statistically higher among males compared to females. Physical inactivity and severe stress were seen in 11% and 8% of subjects with no gender preponderance.
Table 2: Prevalence of cardiovascular disease risk factors in the study population based on gender (N=608).
Variables Categories Male Female Total P value
Tobacco use Present 170 (49.9) 30 (11.2) 200 (32.9) <0.001
Absent 171 (50.1) 237 (88.8) 408 (67.1)
Alcohol use Present 111 (32.6) 11 (4.1) 122 (20.1) <0.001
Absent 230 (67.4) 256 (95.9) 486 (79.9)
BMI
Obese 78 (23.0) 92 (34.5) 170 (28.1)
0.008 At risk obese 50 (14.6) 36 (13.5) 86 (14.2)
Normal 213 (62.4) 139 (52.0) 352 (57.7)
Abdominal obesity (WC) Substantially increased risk 42 (12.3) 107 (40.1) 149 (24.5) <0.001 Normal 299 (87.7) 160 (59.9) 459 (75.5)
Abdominal obesity (WHR)
Substantially increased 300 (88.0) 214 (80.1) 514 (84.5)
0.008 Normal 41 (12.0) 53 (19.9) 94 (15.5)
Hypertension
Hypertension 129 (37.8) 111 (41.6) 240 (39.5)
0.257 Pre hypertension 109 (32.0) 69 (25.8) 178 (29.3)
Normal 103 (30.2) 87 (32.6) 190 (31.2)
Diabetes status
Diabetes mellitus 64 (18.8) 30 (11.2) 94 (15.5) 0.019 Pre-diabetes (IGT) 58 (17.0) 40 (15.0) 98 (16.1)
Normal 219 (64.2) 197 (73.8) 416 (68.4)
Physical activity Physically inactive 43 (12.6) 24 (9.0) 67 (11.0) 0.157 Physically active 298 (87.3) 243 (91.0) 541 (89.0)
Stress level
Severe stress 23 (6.7) 26 (9.7) 49 (8.0)
0.154 Mild–moderate 277 (81.2) 219 (82.0) 496 (81.6)
No stress 41 (12.1) 22 (8.3) 63 (10.4)
Note: Numbers within brackets indicate percentages; M-men; W-women.
Figure 1: Distribution of study subjects according to the estimated ten year CVD risk based on WHO/ISH
risk prediction charts (N=608).
Figure 1 shows the CVD risk estimation and it was found 7% subjects had a very high CVD risk (>40%) and around one-fifth of study population had high risk (20-39%) of the CVD events in next 10 years. The estimated 10 year CVD risk was higher for males compared to females (p=<0.001). However the very high (≥40%) risk was more in females (9.7%) than males (5.6%) (Figure 2).
Table 3 shows that the mean age, SBP, DBP, RCBG, weight, BMI, waist circumference, waist hip ratio (WHR) were found to have a statistically significant difference among the five estimated CVD risk groups. Post hoc tests (Bonferroni) revealed that there was the significant difference between the estimated high risk groups (>40% and 30-39%) with other estimated risk groups with respect all the variables except for BMI and waist circumference.
Figure 2: Gender wise distribution of estimated ten year cardiovascular disease risk.
54%
19% 15%
5% 7%
<10% 10 – 19% 20 – 29% 30 – 39% > 40%
0% 20% 40% 60% 80% 100%
Male Female
51 58.8
17.6 21
18.2 9.7
7.6 5.6 9.7
Percentage
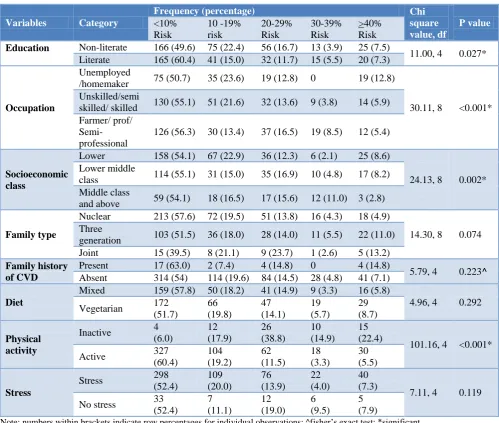
When the variables not used in estimating 10 year CVD risk by WHO/ISH risk prediction charts were cross tabulated against the estimated CVD risk groups it was found that estimated high risk (≥30%) of CVD events in
10 years was statistically higher among individuals who were non-literates, unemployed, physically inactive, belonging to middle class and above socioeconomic status (Table 4).
Table 3: Association between physical parameters and ten year CVD risk.
Variables Mean F-value P value#
<10% risk 10-19% 20–29% 30–39% ≥40%
Age (years) 49.84 63.46 66.11 65.61 66.60* 135.7 <0.001
SBP (mmHg) 127.85 134.57 148.7 159.29 169.78* 103.43 <0.001
DBP(mmHg) 81.99 82.50 85.57 88.93 94.44* 18.307 <0.001
RCBG
(mg/dl) 122.98 132.79 141.44 159.96 175.49
*
9.19 <0.001
Weight (kg) 58.37 54.26 55.94 63.57* 58.46 5.16 <0.001
BMI (kg/m2) 22.85 21.66 21.60 23.03 23.24 3.486 0.008
WC (cm) 87.25 86.06 87.89 93.11 92.58 4.812 0.001
WHR .92 .93 .95 .98* .95 6.38 <0.001
#
ANOVA test;*significant difference found with Bonferroni (post hoc) test.
Table 4: Association between various variables and estimated ten year CVD risk.
Variables Category
Frequency (percentage) Chi
square value, df
P value
<10% Risk
10 -19% risk
20-29% Risk
30-39% Risk
>40% Risk
Education Non-literate 166 (49.6) 75 (22.4) 56 (16.7) 13 (3.9) 25 (7.5)
11.00, 4 0.027* Literate 165 (60.4) 41 (15.0) 32 (11.7) 15 (5.5) 20 (7.3)
Occupation
Unemployed
/homemaker 75 (50.7) 35 (23.6) 19 (12.8) 0 19 (12.8)
30.11, 8 <0.001* Unskilled/semi
skilled/ skilled 130 (55.1) 51 (21.6) 32 (13.6) 9 (3.8) 14 (5.9) Farmer/ prof/
Semi-professional
126 (56.3) 30 (13.4) 37 (16.5) 19 (8.5) 12 (5.4)
Socioeconomic class
Lower 158 (54.1) 67 (22.9) 36 (12.3) 6 (2.1) 25 (8.6)
24.13, 8 0.002* Lower middle
class 114 (55.1) 31 (15.0) 35 (16.9) 10 (4.8) 17 (8.2) Middle class
and above 59 (54.1) 18 (16.5) 17 (15.6) 12 (11.0) 3 (2.8)
Family type
Nuclear 213 (57.6) 72 (19.5) 51 (13.8) 16 (4.3) 18 (4.9)
14.30, 8 0.074 Three
generation 103 (51.5) 36 (18.0) 28 (14.0) 11 (5.5) 22 (11.0) Joint 15 (39.5) 8 (21.1) 9 (23.7) 1 (2.6) 5 (13.2)
Family history of CVD
Present 17 (63.0) 2 (7.4) 4 (14.8) 0 4 (14.8)
5.79, 4 0.223^
Absent 314 (54) 114 (19.6) 84 (14.5) 28 (4.8) 41 (7.1)
Diet
Mixed 159 (57.8) 50 (18.2) 41 (14.9) 9 (3.3) 16 (5.8)
4.96, 4 0.292 Vegetarian 172
(51.7)
66 (19.8)
47 (14.1)
19 (5.7)
29 (8.7)
Physical activity
Inactive 4 (6.0)
12 (17.9)
26 (38.8)
10 (14.9)
15 (22.4)
101.16, 4 <0.001* Active 327
(60.4)
104 (19.2)
62 (11.5)
18 (3.3)
30 (5.5)
Stress
Stress 298 (52.4)
109 (20.0)
76 (13.9)
22 (4.0)
40 (7.3)
7.11, 4 0.119 No stress 33
(52.4)
7 (11.1)
12 (19.0)
6 (9.5)
5 (7.9)
DISCUSSION
With the epidemiological transition from communicable diseases to NCD and CVD being a leading cause of NCDs death, prevention of CVD is an essential component in reducing overall mortality. Multiple risk factors play a role in the development of CVD. Detecting these risk factors at the earliest along with predicting the risk of CVD in next 10 years help in preventing any untoward outcomes in the future. This community based study was conducted to estimate the prevalence of various CVD risk factors and estimate the 10 year CVD risk using WHO/ISH risk prediction charts. The prevalence of tobacco and alcohol consumption was 32.9% and 20.1% respectively and was significantly higher among men than women. Similar findings were found in a study done in a rural Haryana and central India.18,19 Obesity and abdominal obesity were statistically higher among females than males calls for more women centered approach in rural areas to sensitize them about these risk factors and preventive measures.
The difference between prevalence of diabetes among males (18.8%) and females (11.2%) was statistically significant. The prevalence of hypertension and physical inactivity was 39.5% and 11% respectively with no gender preponderance. Findings of a study conducted in northern India revealed similar results that no gender differences was present with regard to parameters like physical inactivity and hypertension.20 Several studies were conducted in different parts of India to assess the CVD risk factors and the prevalence of the hypertension in our studies were in concordance with these studies.19,21,22
Several studies were performed across the world using both with and without cholesterol sets of WHO/ISH risk prediction charts. In the present study, it was found that 7.4% had very high (≥40%) risk, 4.6% had 30-39% risk, 14.5% had 20-29% risk, 19.1% had 10-19% estimated risk of developing fatal or non-fatal CVD event in 10 years. In the current study, estimated overall CVD risk was statistically higher in males than females. Studies done in many low and middle income countries23-25 revealed that among the moderate or high-risk groups, males showed a higher preponderance which was in accordance with our study findings.
Studies done on group C employees at JIPMER, Puducherry and supporting staff of a tertiary hospital, Mysore found the estimated 10 year risk of having a cardiovascular event of >10% in only 1.7% and 3.7% of study participants respectively.26,27 As these estimates were done in a staff of tertiary care hospitals, where they have more opportunity to get screened early for risk factors of CVD and take necessary therapies required for it, the results are much lower as compared to our results which were estimated in a rural community. Yet another study performed by Ghorpade et al in rural Puducherry
found 17% of the participants had >10% risk of occurrence of cardiovascular events.8 A study done in central India found the estimated 10 year risk of a cardiovascular event of ≥30% risk in 4%, 20-29 % risk in 7%, 10-19% risk in 17% of study participants attending the OPD of a tertiary hospital using without cholesterol charts.19 Estimated 10 year CVD risk of more than 20% was found to be 6%, 2.3%, and 1.3% of the study population of Cambodia, Malaysia, and Mongolia, respectively in a multicentric study conducted by Otgontuya et al.23A similar study conducted in Nepal by Dhungana et alreported an estimated risk of more than 20% in 14.6% of the study population.28 The reasons for the high proportion of estimated CVD risk in our study are not presently known; however, these studies were conducted in different sets of populations across world, population differences related to genetic as well as environmental, socio-demographic and lifestyle factors may contribute to the wide difference in the prevalence of the higher risk of CVDs.
It was found in the present study that estimated high risk (≥30%) of CVD events in 10 years was statistically higher among individuals who were non-literates, unemployed, physically inactive, belonging to middle class and above socioeconomic status.
Similar findings of the higher risk associated with lower levels of education was found in a study done by Winkleby et al.29 A study done by Gupta et alshown that majority of the CVD risk factors such as smoking and tobacco use, low physical activity, uncontrolled hypertension, uncontrolled hypercholesterolemia and diabetes were also more common among the low socioeconomic individuals.30 The present study found that CVD risk among rural population is on rise and needs intensive primary and secondary prevention efforts (health promotion, screening for early detection and management) to reduce the CVD burden.
Limitations
Blood cholesterol level which is an important risk factor for CVD could not be included in the study due to logistic constraints. Detailed dietary/food frequency assessment was not undertaken in the present study.
CONCLUSION
Funding: No funding sources Conflict of interest: None declared
Ethical approval: The study was approved by the Institutional Ethics Committee
REFERENCES
1. Park K. Park’s textbook of Preventive and Social Medicine. 24th ed. Chapter 6, Epidemiology of Chronic Non-communicable Diseases and Conditions; Jabalpur India: Banarsidas Bhanot; 2017: 383-6.
2. WHO Cardiovascular diseases (CVDs) Factsheet, 2015. Available at http://www.who.int/mediacentre/ factsheets/fs317/en/. Accessed 20 November 2018. 3. World Health Organization, Non communicable
Diseases (NCD) Country Profiles, 2014: 91.
4. Mackay J, Mensah GA. The atlas of heart disease and stroke. World Health Organization & Center for Disease Control and Prevention; 2012. Available at http://www.who.int/cardiovascular_diseases/resourc es/ atlas/en/. Accessed 20 November 2018.
5. Sommer I, Griebler U, Mahlknecht P, Thaler K, Bouskill K, Gartlehner G, Mendis S. Socioeconomic inequalities in non-communicable diseases and their risk factors: an overview of systematic reviews. BMC Public Health. 2015;15(1):914.
6. WHO Cardiovascular diseases (CVDs) Fact sheet, 2017. Available at http://www.who.int/mediacentre/ factsheets/fs317/en/. Accessed 20 November 2018. 7. WHO/ISH Risk prediction charts for 14 WHO
epidemiological sub-regions, 2007. Available at http://ishworld.com/downloads/activities/colour_cha rts_24_ Aug_07. pdf. Accessed 20 November 2018. 8. Ghorpade AG, Shrivastava SR, Kar SS, Sarkar S,
Majgi SM, Roy G. Estimation of the cardiovascular risk using World Health Organization/International Society of Hypertension (WHO/ISH) risk prediction charts in a rural population of South India. Int J Health Policy Manag. 2015;4(8):531–6.
9. Madhu B, Srinath KM, Ashok NC. Hypertension: Prevalence and its associated factors in a rural south Indian Population. Indian J Public Health Res Development. 2012;3(4):105-9.
10. Centers for Disease Control and Prevention. National Health and Nutrition Examination Survey (NHANES) anthropometry procedures manual; 2009. USA: CDC. 2012.
11. World Health Organization 2000 The Asia-Pacific perspective. Redefining obesity and its treatment. International Diabetes Institute. Health Communications Australia Pty. Ltd. Available at http://www.obesityasia pacific.com/default.htm. Accessed 20 November 2018.
12. WHO Expert Consultation. Waist Circumference and Waist-Hip ratio- Report of a WHO expert consultation. World Health Organization. Geneva. 2008.
13. Frese EM, Fick A, Sadowsky HS. Blood pressure measurement guidelines for physical therapists.
Cardiopulmonary physical therapy journal. 2011;22(2):5-12.
14. Bell K, Twiggs J, Olin BR. Hypertension: The silent killer: updated JNC-8 guideline recommendations. Alabama Pharmacy Association. 2015:1-8.
15. American Diabetes Association. Diagnosis and classification of diabetes mellitus. Diabetes care. 2014;37(1):81-90.
16. World health organization. Global Physical Activity Questionnaire (GPAQ) Analysis Guide. Surveillance and Population-Based Prevention of Noncommunicable Diseases Department World Health Organization. Geneva 27, Switzerland. Available at: http://www.who.int/chp/steps/ resources/GPAQ_Analysis_ Guide.pdf. Accessed on 20 November 2018.
17. Singh G, Kaur D, Kaur H. Presumptive stressful life events scale (PSLES)-a new stressful life events scale for use in India. Indian J Psychiatry. 1984;26(2):107.
18. Krishnan A, Shah B, Lal V, Shukla DK, Paul E, Kapoor SK. Prevalence of risk factors for non-communicable disease in a rural area of Faridabad district of Haryana. Indian J Public Health. 2008;52(3):117-24.
19. Patil CR, Thakre SS, Thakre SB, others. A cross-sectional study on the risk factors for cardiovascular disease and risk profiling of adults in central India. J Clin Prev Cardiol. 2017;6(3):104-8.
20. Kar SS, Thakur JS, Virdi NK, Jain S, Kumar R. Risk factors for cardiovascular diseases: Is the social gradient reversing in northern India. Natl Med J India. 2010;23(4):206-9.
21. Shah B, Mathur P. Surveillance of cardiovascular disease risk factors in India: The need and scope. Indian J Med Res. 2010;132:634-42.
22. Parashar M, Dwivedi S, Agarwalla R, Kishore J, Shaikh Z. Risk factors for cardiovascular diseases among male workers of building construction site in Delhi. J Clin Prev Cardiol. 2017;6:99-103.
23. Otgontuya D, Oum S, Buckley BS, Bonita R. Assessment of total cardiovascular risk using WHO/ISH risk prediction charts in three low and middle income countries in Asia. BMC Public Health. 2013;13(1):539.
24. Nordet P, Mendis S, Dueñas A. Total cardiovascular risk assessment and management using two prediction tools, with and without blood cholesterol. MEDICC Rev. 2013;15:36–40.
25. Mendis S, Lindholm LH, Anderson SG. Total cardiovascular risk approach to improve efficiency of cardiovascular prevention in resource constrain settings. J Clin Epidemiol. 2011;64:1451–62. 26. Aswin K, Ghorpade AG, Kar SS, Kumar G.
Cardiovascular disease risk factor profiling of group C employees in JIPMER, Puducherry. J Family Med Prim Care. 2014;3:255-9.
supporting staff of a tertiary care hospital, Mysuru, India. Heart India. 2016;4:13-6.
28. Dhungana RR, Khanal MK, Pandey AR, Thapa P, Devkota S, Mumu SJ, et al. Assessment of short term cardiovascular risk among 40 years and above population in a selected community of Kathmandu, Nepal. J Nepal Health Res Counc. 2015;13:66-72. 29. Winkleby MA, Jatulis DE, Frank E, Fortmann SP.
Socioeconomic status and health: how education, income, and occupation contribute to risk factors for cardiovascular disease. American J Pub Health. 1992;82(6):816-20.
30. Gupta R, Gupta KD. Coronary heart disease in low socioeconomic status subjects in India:" an evolving epidemic". Indian Heart J. 2009;61(4):358-67.
Cite this article as: Kadiyala P, Renuka M, Kulkarni P, Narayanamurthy MR.Prevalence of risk factors and 10-year risk estimation of