2Rutherford Appleton Laboratory, Didcot, Oxfordshire, UK
3Department of Physics and Astronomy, University of Glasgow, UK
4Space and Plasma Physics, School of Electrical Engineering, KTH, Stockholm, Sweden
Received: 8 January 2008 – Revised: 14 May 2008 – Accepted: 6 July 2008 – Published: 11 August 2008
Abstract. Optical data are compared with EISCAT radar ob-servations of multiple Naturally Enhanced Ion-Acoustic Line (NEIAL) events in the dayside cusp. This study uses nar-row field of view cameras to observe small-scale, short-lived auroral features. Using multiple-wavelength optical obser-vations, a direct link between NEIAL occurrences and low energy (about 100 eV) optical emissions is shown. This is consistent with the Langmuir wave decay interpretation of NEIALs being driven by streams of low-energy electrons. Modelling work connected with this study shows that, for the measured ionospheric conditions and precipitation char-acteristics, growth of unstable Langmuir (electron plasma) waves can occur, which decay into ion-acoustic wave modes. The link with low energy optical emissions shown here, will enable future studies of the shape, extent, lifetime, grouping and motions of NEIALs.
Keywords. Ionosphere (Auroral ionosphere, Plasma waves and instabilities) – Space plasma physics (Wave-wave inter-actions)
1 Introduction
Naturally Enhanced Ion-Acoustic Lines (NEIALs) have been seen in Incoherent Scatter Radar (ISR) data for almost 20 years, as an increase in received power of up to 3 orders of magnitude above the normal thermal level. NEIALs have been observed in the night-side ionosphere using the Mill-stone Hill radar (Foster et al., 1988) and mainland EISCAT radars at Tromsø (Collis et al., 1991; Rietveld et al., 1991, 1996), and more recently in the dayside cusp region using
Correspondence to: J. M. Sullivan
the EISCAT Svalbard Radar (ESR) (Buchert et al., 1999; Grydeland et al., 2003; Ogawa et al., 2006). This paper is based on the latter class of NEIALs, occurring in the dayside ionosphere. Interferometry studies at Svalbard, using multi-ple receivers to resolve features within the main radar beam, have shown that the structures responsible for these enhance-ments can be of the order of 100 m across, i.e. much smaller than the radar beam width. This implies that the scattering cross section must be increased by up to 5 orders of magni-tude to explain NEIAL observations (Grydeland et al., 2003). For a review summarising the observations of NEIALs from various sites, and the proposed theories to explain them, see Sedgemore-Schulthess and St.-Maurice (2001).
of the parametric decay mechanism for low energy electron beams can account for the observed link with rayed aurora, now known to contain a significant population of low energy electrons.
Theoretical models of parametric decay, although able to explain general features of observations, cannot yet re-produce the behaviour of NEIALs in the dayside cusp en-tirely. NEIAL occurrences can also sometimes be explained in terms of ion-streaming instabilities (Wahlund et al., 1992), but density requirements are often prohibitively high to match observations in the cusp. However, observations of NEIALs in the night-side ionosphere show behaviour more consistent with a current driven (i.e. ion-electron streaming instability) interpretation, especially with enhancements oc-curring at low altitudes (<250 km). There are also indica-tions that night-side NEIALs are often seen near the edges of structured auroral arcs, as opposed to within filamentary rays (Collis et al., 1991; Michell, 2007). This suggests the possi-bility that dayside and nightside echoes may be the result of differing generation processes, but with similar signatures in the radars.
Previous optical camera studies of dayside NEIALs have used imaging either with a long-pass cut-off filter applied or in white light, and concentrated on the prompt N2(1st pos-itive band at 670 to 750 nm) and N+2 (1st negative bands at 427.8 and 470.9 nm) emissions. The low-energy component of auroral precipitation can be imaged using the forbidden oxygen (OII)2P–2D emission at 732 and 733 nm, which is predominantly produced by auroral electrons with energies of around 100 eV.
Few studies have compared auroral emissions present within the radar beam with the occurrence of NEIALs. Where attempts have been made to quantify different emis-sions, the parallax effects of using instruments at loca-tions separated from the radar have not been taken into ac-count. Geometry considerations become very important at the small-scale level needed to study NEIAL behaviour. This is discussed further in Sect. 3.1.1 of the present paper.
Previous studies have suggested that high-energy parti-cles may also have an important part to play in the gener-ation of NEIALs (Lunde et al., 2007). It may be possible to differentiate between different NEIAL generation mech-anisms by determining whether the presence of high-energy precipitation directly drives the instability itself or provides more favourable conditions for NEIALs to be observed at ISR wavelengths.
In this paper, the relationship between multiple NEIAL events and incoming particle precipitation energies is stud-ied in detail, using simultaneous auroral imaging at differ-ent wavelengths. In addition data from a Defence Meteoro-logical Satellite Program (DMSP) satellite pass at approx-imately 800 km altitude is combined with Langmuir wave modelling. The average altitude for NEIAL generation was found to be around 700 km in this study. The DMSP data therefore greatly enhances our ability to investigate directly
driving conditions at NEIAL altitudes, as well as using sig-natures from optical measurements up to 300 km in altitude.
2 Ground-based instrument details
2.1 EISCAT Svalbard Radar (ESR)
The ESR is an incoherent scatter radar facility, using one 42 m antenna, fixed in the field-aligned direction of 181.0◦ in azimuth and 81.6◦in elevation, and one steerable 32 m an-tenna. The location, just outside Longyearbyen at 78◦90N, 16◦20E, on the Norwegian island of Spitsbergen, means it is ideally situated to study dayside cusp phenomena. For the period of interest studied here the radar programme “tau0” was used, an alternating code experiment covering all alti-tudes from 120 km to 1200 km. Data were recorded from the 32 m and 42 m dishes alternately. At the time of the obser-vations presented, the 32 m antenna was deployed at a low elevation and therefore only the 42 m measurements are used here. The integration time is 6.4 s but followed by a gap of 6.4 s for each data point.
2.2 Optical instrumentation
The Spectrographic Imaging Facility (SIF) was in operation at the Auroral Station in Adventdalen at 78◦120N, 15◦500E, i.e. approximately 7 km north-west of the ESR. The Univer-sity of Southampton and UniverUniver-sity College London instru-ment platform consists of a narrow field auroral imager and a High Throughput Imaging Echelle Spectrograph (HiTIES). Supporting photometers with interchangeable filters are also available.
Fig. 1. Modelled (OII) (2P–2D) doublet emission in units of [photons/cm3/s], as a function of energy and altitude.
was used, centred on the forbidden oxygen (OII)2P–2D dou-blet at 732 nm and 733 nm. This emission is most effectively excited by low energy (100 eV) electron precipitation, peak-ing at altitudes of around 300 km. Figure 1 shows the en-ergy and altitude dependence of the forbidden oxygen emis-sion, as modelled using the electron transport model of Lum-merzheim and Lilensten (1994).
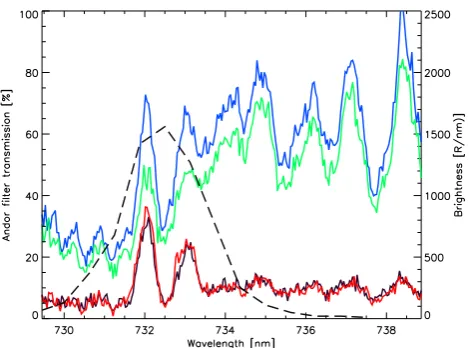
Emission from the forbidden oxygen doublet is embed-ded in that from the first positive band of molecular nitrogen (N21PG) between 670 and 750 nm in the auroral spectrum. Figure 2 shows measurements taken with the HiTIES spec-trograph covering the wavelength range of the Andor imager. During the initial operations presented here, the mosaic fil-ter containing the forbidden oxygen doublet panel was not in use; the example spectra shown in Fig. 2 are from a later interval. The four different colours show the emission spec-tra present in four consecutive 30 s intervals. It can be seen how the differing levels of the oxygen doublet at 732 nm and 733 nm and the background nitrogen bands both contribute to the emission within the Andor passband, shown by the black dashed line. This is discussed in detail in Dahlgren et al. (2008b). The contaminant (N21PG) emission in the Andor camera is almost independent of characteristic energy, being instead proportional to the total energy flux. This emission is excited at lower altitudes compared with the (OII) emission, with a peak emission altitude at around 110 km.
The existing optical imager on the platform, here termed “SIF”, at the same location as Andor, was also used in this study. It was directed towards the magnetic zenith and mapped onto the sky using observed stars from the SAO catalogue. SIF is an intensified CCD imager, with 25 frames per second temporal resolution and a 16◦by 12◦ field of view. For this event, SIF was fitted with a long pass RG645 filter with passbandλ>645 nm. This was chosen to exclude the long-lived 630 nm and 557.7 nm emissions,
mak-Fig. 2. HiTIES spectrograph plot showing the intensities of auroral emission lines as a function of wavelength. Data from four consec-utive 30 s integrations are shown by (in order) the black, blue, green and red lines. The response of the filter used on the Andor imager is shown by the black dashed curve.
ing this imager primarily sensitive to the (N21PG) and (N+2) Meinel emissions in the passband (but also including the (OII) doublet, and a number of atomic oxygen transitions).
Frames from both imagers were flat-fielded and corrected for the dark level. The observations were taken in morning twilight conditions, so the varying contribution to the images due to sunlight was subtracted, along with the instrumental dark-noise level. The sunlight contribution was estimated by a linear fit to brief periods of clear sky before and after the main auroral event in both cameras. Both imagers were in-tensity calibrated, using stars visible in the clear sky periods used for sunlight subtraction. This star calibration procedure is documented in full in Ivchenko et al. (2008)1. Dropouts occurred in the intensity level recorded by the Andor imager at regular intervals, which were caused by overheating (tem-perature control systems are now employed on the final ASK instrument). Measurements during these periods have been removed, leading to a non-continuous Andor data set. Care-ful analysis of the remaining data confirms that the gain was uniform and stable.
3 Observations
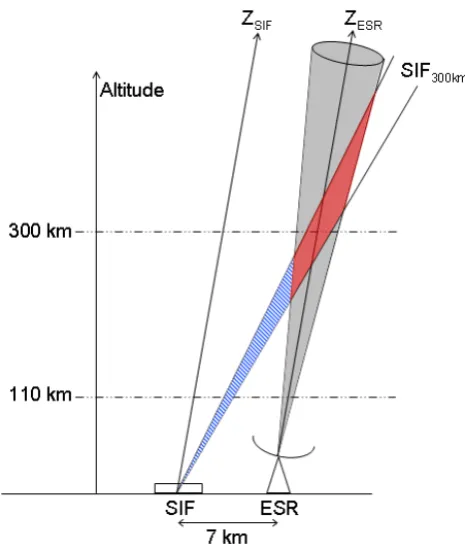
[image:3.595.51.284.61.228.2]Fig. 3. Representation of the viewing geometry used in this study. The emission volumes observed by the two imagers at the Auroral Station site are compared to the scattering volume illuminated by the ESR beam.
conditions as measured by the Advanced Composition Ex-plorer (ACE) and DMSP data can be found in Lorentzen et al. (2007).
The observations took place during a period of active solar wind conditions measured by the ACE spacecraft, following a coronal mass ejection a few days earlier. The earthward component of the solar wind speed averaged 650 km s−1 throughout the interval. A sharp drop in the solar wind density and dynamic pressure occurred at ACE between 08:10 UT and 09:20 UT. Using a calculated 40-min lag time, this corresponds exactly to the interval in which NEIALs are seen in the radar data. The Interplanetary Magnetic Field (IMF) measurements showed aBZcomponent turning posi-tive at 07:45 UT at the ACE spacecraft, which for the propa-gation delay estimated here, corresponds to 08:25 UT at the dayside magnetopause. IMFBZthen remained weakly posi-tive until 09:20 UT in ACE measurements, again correspond-ing to the end of the interval in which NEIALs are seen in the ionosphere. IMFBY was strongly negative throughout the interval.
Observations from a nearby DMSP satellite pass indicate a lobe reconnection configuration, with an anti-clockwise lobe convection cell over Svalbard. Soft particle precipitation is present throughout the interval, with associated Joule
heat-ing and strong pulsed ion upflow in the region of our obser-vations. Data from the Longyearbyen station of the IMAGE magnetometer network (Viljanen and H¨akkinen, 1997) show a negative bay in the X-component of magnetic field peak-ing at 08:45 UT with an amplitude of around 200 nT, repre-senting the passage of a large-scale current overhead. The interval studied here takes place during disturbed magnetic activity directly following this feature. Quasi-periodic oscil-lations, with amplitudes of approximately 50 nT, are seen in the IMAGE magnetometer data until 10:00 UT.
This study compares the level of the emissions present in both of the narrow-view imagers with the times of NEIAL power enhancements in the ESR. The time resolution of the radar data available for this study is not high enough to follow the behaviour and evolution of an individual NEIAL, which varies on a sub-second time scale. The collection of raw volt-age level data at millisecond resolution was unfortunately not implemented at the radar for this campaign season, but will now be in operation whenever possible for future ESR runs during cusp hours. However, this interval contains an unprecedented number of NEIALs occurring in a relatively short period, which allows us to make a statistical study of the relationship between NEIALs and the aurora present in the radar beam.
3.1 Optical analysis
Previous studies have used wide-angle optical instruments to study the auroral precipitation characteristics over Svalbard during times of NEIALs. However, the filamentary NEIALs and the dynamic structured aurora seen to be associated with them are small-scale in nature. This means it is important to use optical measurements of higher spatial resolution. It is also important to use different wavelength emissions in the radar beam to provide information about the precipitating energy spectrum.
3.1.1 Viewing geometry
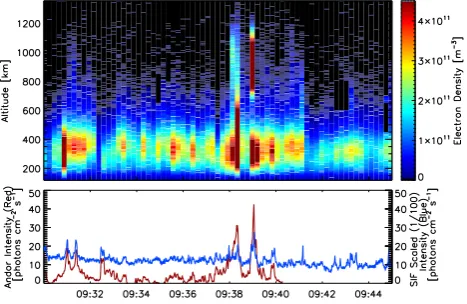
Fig. 4. Data for the interval 09:30–09:45 UT. Top panel: ESR raw electron density (scaled Debye-corrected backscattered power) as a function of altitude and time. Bottom panel: Intensity of the optical emission within the solid angle corresponding to the radar beam at 300 km altitude for the Andor imager (in red) and the SIF imager (in blue).
emissions by altitude, was shown to be possible by Semeter (2003).
However, the separation causes a new source of the ni-trogen contaminant in the Andor imager. Figure 3 shows a representation of the source of this possible contamination, with an exaggerated view of the observation geometry used here. The area on the Andor image representing the position of the ESR beam at 300 km will mainly consist of the con-tribution from low-energy emission within the beam, shown by the red shaded region. However there may also be some emission from higher energy precipitation outside the beam at lower altitudes, shaded in blue, contributing to the total line of sight intensity. By comparing the Andor (OII) inten-sity with the inteninten-sity in the wider filter of the SIF imager at the same look direction, this contamination can be quantified. It can also be seen in Fig. 3 that when observing from a site separated from the radar, aurora from high-energy particles seen in the direction of magnetic zenith, will not be located in the main radar beam, due to the low altitude of emission. Previous studies looking at the relationship between high en-ergy particles and NEIALs have not always accounted for this (Lunde et al., 2007). Since the filaments associated with NEIALs have been shown to have scale sizes much smaller than the width of the radar beam, this is an important consid-eration.
3.1.2 Observational results
[image:5.595.310.547.64.218.2]From the analysed E-region radar data over the entire in-terval (not shown here), it is apparent that there is a much larger population of high-energy electrons precipitating at the beginning of the period, associated with the prior inter-val of southward IMF. As time progresses, the precipitation
Fig. 5. As Fig. 4, for the interval 09:45–10:00 UT.
becomes more dominated by low-energy precipitation. The implications of this are discussed further in Sect. 5.
The data from 08:45 UT to 10:00 UT have been split into 15 min sections in order to study how the relationship be-tween auroral emission and NEIALs was affected by the varying characteristics of the incoming precipitation. Fig-ures 4 and 5 show the relationship between the enhancements in ESR backscattered power and the intensity of the optical emissions in two consecutive 15 min periods. The top panel shows the temperature-corrected backscattered power from the ESR, scaled to represent units of electron density (ap-plies only for thermal plasma), as a function of altitude on the vertical axis and time on the horizontal axis.
Fig. 6. Multi-wavelength composite image showing the optical (OII) enhancement associated with the NEIAL signature at 09:39:03 UT. The frames shown were taken at 09:38:53, 09:38:58, 09:39:03, 09:39:08 and 09:39:13 UT from left to right. The direction of north is vertically downwards and the east direction is to the left for the image orientation as shown here. The white circles shown progressively further out from the centre of the image, represent the position of the ESR beam (FWHM 0.6 degrees) at altitudes of infinity, 300 km and 110 km respectively. The result of not taking into account the parallax effect, i.e. effectively assuming infinite altitude, can clearly be seen.
There is some evidence for enhancements in electron den-sity at or below about 400 km, corresponding to NEIAL events at higher altitudes, for example at 09:39 UT in Fig. 4. In cases where the low-altitude enhancement is separate from the NEIAL at higher altitude, with a clear distinction be-tween maxima as in the example noted, these are likely to be real density enhancements. The radar data alone therefore shows direct evidence for soft electron precipitation accom-panying NEIALs, with electrons of 100 eV energy causing an ionisation peak at around 250 km altitude (modelled us-ing the electron transport model of Lummerzheim and Lilen-sten, 1994, and shown in Whiter, 2008). However, because of the use of the zero-lag profile and the associated large range ambiguity, care must be taken where there is no clear dis-tinction. There is the possibility of NEIAL enhancements affecting range gates at lower altitudes.
The second panel shows the calibrated intensity from the solid angle corresponding to the cross section of the radar beam at 300 km on the Andor and SIF images, in red and blue respectively. An ESR beam width (full width at half power) of 0.6 degrees is assumed here. With a much larger filter passband than Andor, the intensity levels in the SIF camera are in general much larger, and have been scaled by a fac-tor of 0.01 in order to show them on the same axis. There is also some slowly varying offset in the SIF intensity, that is predominantly due to continuous emission excited by the high energy precipitation but may also contain some residual continuum and solar scattering background. As discussed in detail above, the Andor imager is predominantly responding to the low energy oxygen doublet (OII) emission, with some contamination from the background nitrogen bands, while the SIF imager is primarily sensitive to the (N21PG) emis-sions in the passband, with some contamination from (OII) and other nitrogen emission. The relative brightness of (OII) and (N21PG) emissions therefore depends on the energy of the precipitating particles.
These time intervals, taken from the end of the period of NEIAL activity, when the emission from high energy
pre-cipitation is low, show a clear correlation between discrete NEIALs and times of increased in-beam Andor emission. It can be seen that the main peaks in Andor, corresponding to the times of NEIALs are characterised by an increase in the Andor to SIF ratio, ie. the Andor intensity is predomi-nantly enhanced. This confirms that at these times Andor is responding specifically to an increase in low energy precipi-tation enhancing the (OII) emission, rather than an increase in the (N2 1PG) background. The increased Andor to SIF ratio at times of NEIALs therefore implies that the related auroral structures are the direct result of low energy electron fluxes, entering the topside ionosphere i.e. “primary precipi-tation”, and not due to secondaries resulting from successive collisions of higher energy precipitating particles as they pass through the ionosphere.
3.2 Imaging an individual NEIAL
Throughout the entire interval of interest, rayed coronal au-rora was observed, with a large scale drift northwards across the sky. NEIALs occur at the same time as short-lived auro-ral structures pass through the radar beam. These have been shown to be predominantly low energy features.
Overlaid images from both Andor and SIF, as shown in Fig. 6, can provide an image of the optical evolution of a NEIAL signature, both spatially and in energy. In the com-posite images Andor data are shown in red, SIF data in blue. The overlaid frames shown are taken at 5 s intervals, with the central (third) image at 09:39:03. This corresponds to the dis-crete NEIAL signature and the related optical intensification at 09:39:03, as shown in Fig. 5.
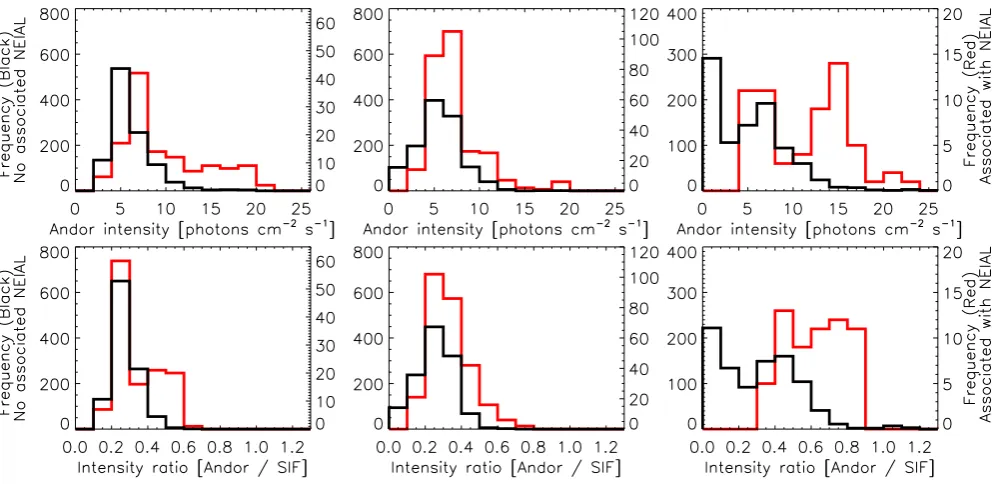
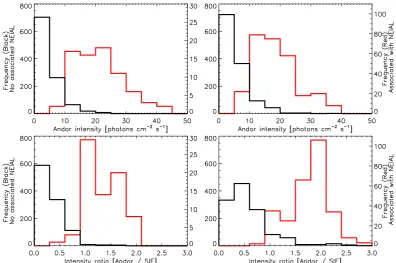
Fig. 7. Andor intensities and Andor/SIF ratios separated into data points associated with a NEIAL (shown in red), and those where no NEIAL was recorded, (shown in black). The histograms shown are for 15 min intervals of data, starting, from left to right at 08:45 UT, 09:00 UT and 09:15 UT, respectively.
mapping the radar beam at an infinite altitude. The circles positioned progressively further away from the centre of the image represent the location of the radar beam at 300 km and 110 km respectively, i.e. the peak-emission altitudes for (OII) and (N21PG) emission, respectively. It can be seen that the feature responsible for the discrete enhancement in the (OII) emission at 300 km altitude is a spatial structure, with a rayed arc passing through the ESR beam.
4 Statistical analysis
A statistical analysis of the interval 08:45 UT to 10:00 UT was made to compare the incidence of fine scale aurora with NEIAL signatures present in the ESR beam. A sampling length of 15 min was chosen as optimum for the changing ionospheric conditions.
The Andor imager intensity values were separated accord-ing to whether or not they were associated with a NEIAL signature in the radar. This was defined as whether they oc-curred within a time (T±τ) whereT is the time of the near-est recorded NEIAL event in the radar, andτ is 6.4 s, the temporal uncertainty due to the resolution of the radar data points. NEIAL signatures were identified using the backscat-tered ESR data integrated over the altitudes between 500 km and 1200 km, i.e. well above normal F-region ionisation al-titudes. Individual features with integrated powers over a chosen threshold criteria well above the background level
showed up distinctly, and were classed as NEIAL events. As mentioned previously, power enhancements due to satellites had already been removed from the data set. The time series of auroral intensity from the SIF imager was interpolated to the lower temporal resolution (2 frames per second) of the Andor imager. This allows the calculation of ratios for each time step and therefore separates (OII) emission events from (N21PG) contamination features.
Figure 7 shows the resulting histograms for the three con-secutive 15 min intervals from 08:45 UT until 09:30 UT, pro-gressing from left to right. The top panels show the inten-sity values recorded by the Andor camera (again integrated within the beam location at 300 km as in Figs. 4 and 5), sep-arated into those associated with a NEIAL event (shown in red) and those with no associated NEIAL (shown in black). It can be seen that in the first two time intervals the dif-ference between the two is negligible, but in the third plot, starting at 09:15 UT, the separation between the populations becomes significant, with NEIAL events associated with in-creased emission in the Andor. This distinction is also seen in the plot of camera ratios (bottom panel) for this time sec-tion, confirming that it is increased levels of (OII) emission that are associated with NEIAL signatures.
Fig. 8. As Fig. 7 for the 15 min intervals starting at 09:30 UT (left column) and 09:45 UT (right column).
in the Andor/SIF ratio (which may be somewhat affected by the background level in the SIF intensity). Even though the separation is distinct, it is not exclusive, with a third popu-lation of precipitation which may or may not cause NEIALs to be generated, i.e. an auroral population near the trigger-ing criteria. This implies that the critical threshold for the generation of NEIALs is not fixed, and may depend on other factors in the ionosphere.
The high occurrence frequencies shown in these his-tograms reflect, in part, the high temporal resolution of the optical data, in comparison with the integration time for each radar data dump, and also a degree of binning applied to clar-ify trends. Using the chosen threshold criteria to identclar-ify NEIALs, the numbers of affected radar data dumps in each successive 15 min interval, starting at 08:45 UT through to 09:45 UT, are 5, 20, 4, 3 and 13, respectively.
5 The role of high-energy precipitation
As shown in Figs. 7 and 8 there is a relationship between times of increased (OII) emission and NEIAL signatures. However, the difference between the population associated with a NEIAL and that which is not, becomes more dis-tinct progressing through the interval 08:45 UT to 10:00 UT, and only becomes significant after 09:15 UT. As mentioned in Sect. 3.1.2, a large population of high-energy particles is present at the start of these observations, which diminishes
over time (Fig. 9). An almost unambiguous relationship be-tween NEIALs and auroral intensity is clear when the high energy precipitation is at its lowest. This implies it is the low energy precipitation that is the direct driver for the NEIAL events, and that the relationship between NEIALs and auro-ral activity becomes harder to discern when the Andor imager is responding more to contaminating emission in the pass-band from high-energy precipitation. During times of strong (N21PG) aurora, the relatively weak contributions from the (OII) doublet to the Andor bandpass are overpowered by the molecular emissions, and become hard to discern. This may explain why there is no significant relationship between the aurora and NEIAL occurrence, even in the ratio plot, for the data between 08:45 UT and 09:15 UT.
Figure 9 shows the radar E-region raw electron densi-ties, representing the effect of ionisation, averaged over each 15 min interval between 08:45 UT and 10:00 UT. Radar data dumps identified as NEIALs have been treated as missing data in the averaging. E-region ionisation is caused directly by the precipitation of high (>1 keV) energy electrons (Rees, 1989). The ionisation profiles therefore clearly show the higher levels of high-energy precipitation at the beginning of the interval, diminishing over time.
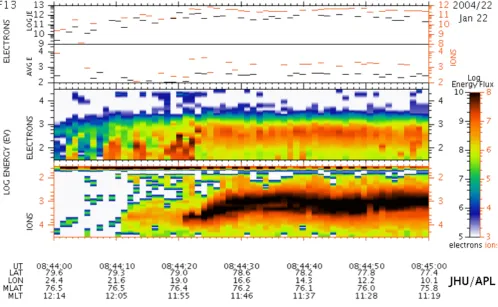
Longyearbyen. The DSMP spacecraft measure downward fluxes of ions and electrons, of energies from 30 eV to 30 keV in 19 channels, with a time resolution of one second. The time of closest approach is at 08:44:46 UT, just before the onset of the interval studied here, when the satellite passes within approximately 20 km, and to the north, of the ESR beam.
Figure 10 shows the DMSP F-13 spectrogram for ions and electrons for the interval 08:44 UT to 08:45 UT. Strong bursts of low-energy (around 100 eV) electrons are observed at 08:44:09, 08:44:14 and 08:44:20 UT. The initial distribution function of energetic electrons,g(v)=Av−δwas obtained us-ing DMSP F-13 measurements of differential energy flux at 08:44:20 UT, fitted with a power law. The number den-sity of energetic electrons above velocityv=v0,n(v=v0)is given byn(v=v0)=
R∞
v=v0g(v)dv. The power-law indexδ≈4 gave a power law fit to the shape of the DMSP spectrum as a whole. This distribution (shown with a dashed line in Fig. 12) was used as one of the inputs to a Langmuir turbu-lence model, based on that described in Kontar and P´ecseli (2002) and Kontar and P´ecseli (2005).
The model self-consistently describes the interaction of electrons, Langmuir waves, and ion-acoustic waves in F-region ionospheric plasma using the approximation of weak turbulence theory. Weak turbulence kinetic equations are solved in time and k-space with time-dependent injection of electrons. Using the assumptions of Kontar and P´ecseli (2002), we can write the kinetic equation for the resonant interactionωpe=kvof electrons and Langmuir waves (Vede-nov et al., 1962).
∂f
∂t =
4π2e2 m2 ∂ ∂v Wk v ∂f
∂v −v ∂f 0 ∂x x=x
S
(v, t ), (1)
wheref (v, t )is the electron distribution function,Wk(k, t ) is the spectral energy density of Langmuir waves playing the same role for waves as the electron distribution function does for particles. The last term introduced in Eq. (1) is a source/sink of electrons mimicking free downward precipi-tating electrons along the magnetic field lines. The precipita-tion of electrons is modelled by scatter-free one-dimensional streaming from the satellite locationx=0 (where electrons
2 3 4 5 6 7
x 1010 120
Average Electron Density [m−3]
[image:9.595.310.546.63.259.2]09:45 − 10:00
Fig. 9. Average ESR raw electron densities (Debye-corrected) for consecutive 15 min intervals between 08:45 UT and 10:00 UT.
were measured at approximately 850 km) to the depth of the point of simulationxS=150 km (the average NEIAL altitude was observed to be around 700 km), described by
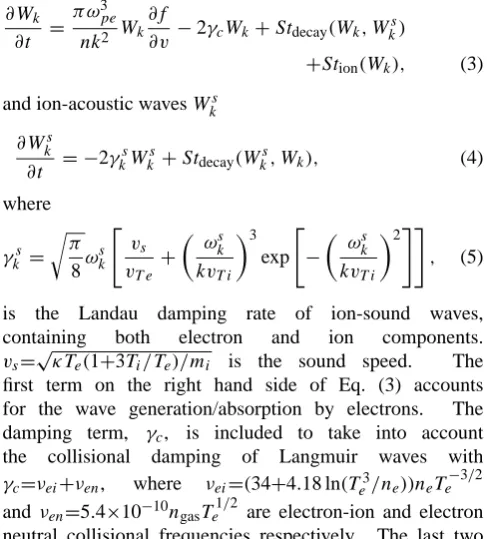
f0(v, x, t )=g(v)exp(−(x−vt )2/d2), (2) whered=30 km, andg(v)=Av−δ is the initial distribution function from satellite data. Equation (1) is solved simul-taneously with the corresponding equations for Langmuir wavesWk
∂Wk
∂t =
π ω3pe
nk2 Wk
∂f
∂v −2γcWk+Stdecay(Wk, W s k)
+Stion(Wk), (3) and ion-acoustic wavesWks
∂Wks
∂t = −2γ s kW
s
k +Stdecay(Wks, Wk), (4) where
γks =
r π 8ω s k " vs vT e
+
ωs k kvT i
3 exp " − ωs k kvT i
2## , (5)
is the Landau damping rate of ion-sound waves, containing both electron and ion components.
vs=
√
κTe(1+3Ti/Te)/mi is the sound speed. The first term on the right hand side of Eq. (3) accounts for the wave generation/absorption by electrons. The damping term, γc, is included to take into account the collisional damping of Langmuir waves with
[image:9.595.306.550.444.714.2]Fig. 10. DMSP spectrogram from the F-13 satellite, for the interval 08:44 UT to 08:45 UT.
Table 1. Plasma parameters for the simulations.
Altitude, km Te, K Ti, K fpe, MHz ngas,cm−3
700 6000 1400 2.0 5×10⁵
terms on the right hand side of Eq. (3) and the last term in Eq. (4) describe nonlinear wave-wave interactions. Specifi-cally, the term,Stdecay, describes the decayLL0+S of a Langmuir waveωL(kL)into a ion-sound waveωS(kS)and a “daughter” Langmuir waveω0L(kL0), while the term Stion denotes Langmuir wave scattering from ions,L+i→L0+i0
which is also known as nonlinear Landau damping (see Kontar and P´ecseli, 2005, for details). The initial level of Langmuir and ion-sound waves was taken to be thermal
Wk(t=0)=WT andWkS(t=0)=WTS.
As mentioned above, the model was run for an altitude of 700 km, which was found to be the average height of peak power in the raw spectra for all NEIAL data dumps. Back-ground ionospheric parameters were taken from GUISDAP ESR analysis results, at a time resolution of 64 s. Param-eter results were integrated between 600 km and 800 km to
increase signal to noise levels, collected over the interval 08:45 UT to 10:00 UT. Appropriate binning was used to find a clear modal value for electron density, electron tempera-ture and ion temperatempera-ture. It is important to note that using data from the entire interval means that dumps containing NEIALs, where the analysed values are unreliable, will also be included. However, despite the large numbers of NEIALs in this period, there are still far more thermal dumps than en-hanced, leaving the modal value unaffected. Realistic neutral densityngasvalues are taken from altitude profiles from the MSIS model. The plasma parameters used in the simulations are given in Table 1.
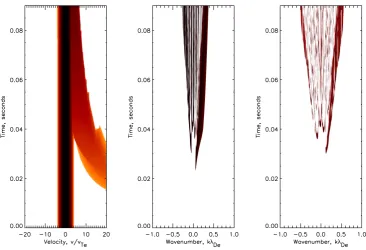
Fig. 11. Evolution of electron distribution function (left panel), Langmuir waves (middle panel) and ion-acoustic waves, (right panel) in time and velocity/wavenumber spaces.
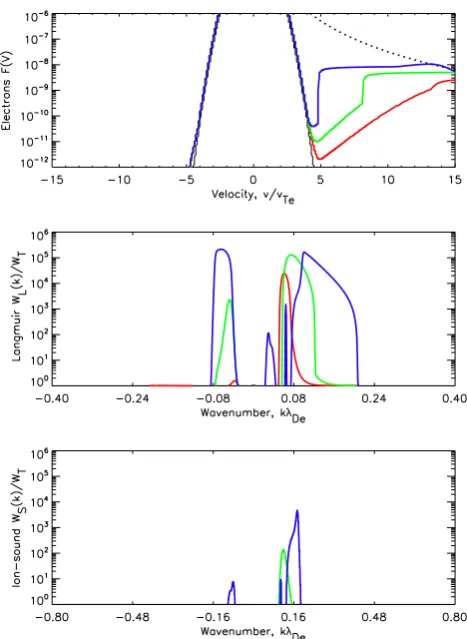
after approximately 30 ms. After this time, Langmuir waves with higher wavenumberkLstart to decay and produce ion-acoustic waves with largerkS. The normalised scattering k-vector (kBraggλDe) of ion-acoustic waves detected with the ESR is approximately 0.5, withλDe=2.4 cm for the values of electron density and temperature used here. Generated ion-acoustic waves at this k-vector, should be observed as NEIALs in ESR data. The simulation results in Fig. 11 show that the radar should first detect downward propagating (up-shifted) ion-acoustic waves approximately 75 ms after the start of simulations. Upward propagating (downshifted) ion-acoustic waves with the same intensity atkBraggλDe∼−0.5 only appear later in the simulations at approximately 90 ms (Fig. 11). The level of ion-acoustic turbulence is around three orders of magnitude above the thermal level, as shown in Fig. 12. It should be noted that Fig. 12 only shows the simulation results up to 35 ms and does not include the later time steps corresponding to when waves are present at ESR k-vectors. After 40 ms since the start of simulations, ion-acoustic wave activity remains similar in magnitude, with a maximum spectral energy density three orders above the thermal level, seen atkBraggλDe∼0.5 after 80 ms. However at these later times wave activity becomes present at a large range of discrete k-vectors, completely swamping the ear-lier features. Time steps later than 35 ms have therefore been omitted from this figure, so that the temporal evolution of the wave growth can still be seen.
7 Discussion and conclusions
In this paper, a clear link has been shown between NEIALs in the dayside cusp and emission from low-energy (100 eV or less) electrons, using auroral imaging in the forbidden (OII) emission doublet. The results from cameras at two different wavelengths imply that this emission is due to low energy primary electron precipitation, and not secondaries linked to incoming particles of higher energy. Incoming bursts of such electrons, “supra-thermal electron bursts” have been shown to be related to dispersive Alfv´en wave activity and accel-eration processes (Chaston et al., 2007). One NEIAL event shown in detail here reveals the drift of a small long-lived feature (seen in the imager field of view for over 20 s), briefly intersecting the radar beam. This is interpreted as the NEIAL being a spatially distinct feature, as opposed to a purely tem-poral change within the radar scattering volume. The results here suggest that filaments associated with ion-acoustic en-hancements can be persistent within a larger region of precip-itation, and are only detected as they pass through the main radar beam.
Fig. 12. Electron distribution function f (v) [cm−4s], Lang-muir waves,Wk(k)/WT, and ion-acoustic waves,Wks/WTs for the plasma parameters at 700 km at 25, 30, and 35 ms (red, green, and blue lines, respectively). The dotted line in the electron distribution panel gives the initial electron distributiong0(v)(the power-law fit to the satellite data at 08:44:20 UT).
thermal level. The ability to drive the model using the ob-served spectrum of precipitation at NEIAL altitudes, as well as observing the effects in terms of auroral emissions lower down in the ionosphere, is of great importance in understand-ing NEIALs.
High-energy particle precipitation is present to some ex-tent throughout the period in which NEIAL signatures are observed by the ESR. However, statistical analysis indicates that energetic precipitation is not directly linked to NEIAL occurrence. In this case it is masking the relationship with lower energy precipitation. NEIALs in the dayside cusp re-gion are predominantly recorded during times of dynamic rayed aurora (Blixt et al., 2005), and are not observed at times of low-energy quiet arcs which have no high energy component. This suggests that the presence of some ener-getic particles is favourable for NEIALs to be seen in ESR data.
One possible explanation for this is that a broad mix of precipitating electron energies, i.e. such that has been shown
to be present in dynamic rayed auroral forms, has a larger spread of electron beam velocities than a purely low energy population. Using the “parametric decay” interpretation, this therefore increases the bandwidth of the unstable electron population causing the growth of Langmuir waves, which directly increases the range of wavelengths over which ion-acoustic waves are enhanced (Forme, 1999). A wider range of precipitating energies therefore increases the chance of en-hancement at the fixed wavelength of an IS radar. A greater beam energy spread also increases the chance of satisfying the Bragg conditions for enhanced downshifted and the up-shifted line to be observed simultaneously. The vast majority of raw spectra identified as NEIALs in this study show clear enhancements in both lines, although with the time resolu-tion available in this experiment, temporal averaging cannot be ruled out.
Another effect of energetic precipitation may be its role in enhancing the electron temperature in the surrounding ionosphere. From the summary plot showing the analysed radar parameters (shown in Lorentzen et al., 2007), it can be seen that this interval of NEIAL activity is associated with strongly elevated electron temperatures compared to ion temperatures, a feature common in previous NEIAL stud-ies. A higher ratio of electron temperature to ion temper-ature, as well as increasing the bandwidth of ion-acoustic enhancements, reduces the Landau damping of ion-acoustic waves. The criteria for instability is that the generation of ion-acoustic waves should be faster than their absorption, which is only possible whereTeTi. This is consistent with studies that have shown the occurrence of NEIALs to be rarer during times of high ion temperature (Ogawa et al., 2006).
In a subsequent paper, we will look in detail at the fine-scale structure and motions of the precipitation we have shown here to be linked to NEIAL generation.
Acknowledgements. We thank Ian McCrea and Ivan Finch at the EISCAT Support Group, Rutherford Appleton Laboratory for valu-able discussions and help with processing the ESR data, and Geoff Daniell for help with the statistical analysis. We also thank the January 2004 EISCAT and optical campaign teams and An-dor Inc. for providing the iXon detector on loan. EISCAT is an International Association supported by China (CRIRP), Finland (SA), France (CNRS), Germany (DFG), Japan (NIPR and STEL, Nagoya), Norway (NFR), Sweden (VR) and the United King-dom (STFC). E. P. Kontar acknowledges the financial support of an STFC Advanced Fellowship. N. Ivchenko is supported by a grant from the Swedish Research Council (VR). The DMSP par-ticle detectors were designed by Dave Hardy of AFRL, and data obtained from JHU/APL. We thank Dave Hardy, Fred Rich, and Patrick Newell for its use.
Topical Editor K. Kauristie thanks M. Rietveld and another anonymous referee for their help in evaluating this paper.
References
G., and Whiter, D.: Morphology and dynamics of aurora at fine scale: first results from the ASK instrument, Ann. Geophys., 26, 1041–1048, 2008a, http://www.ann-geophys.net/26/1041/2008/. Dahlgren, H., Ivchenko, N., Sullivan, J., Lanchester, B. S., Whiter, D., Marklund, G., and Strømme, A.: Using spectral char-acteristics to interpret auroral imaging in the 732.0 nm O+ line, Ann. Geophys., 26, 1905–1917, 2008b, http://www.ann-geophys.net/26/1905/2008/.
Forme, F. R. E.: A new interpretation on the origin of enhanced ion acoustic fluctuations in the upper ionosphere, Geophys. Res. Lett., 20, 2347–2350, 1993.
Forme, F. R. E.: Parametric decay of beam-driven Langmuir wave and enhanced ion-acoustic fluctuations in the ionosphere: a weak turbulence approach, Ann. Geophys., 17, 1172–1181, 1999, http://www.ann-geophys.net/17/1172/1999/.
Foster, J. C., del Pozo, C., Groves, K., and St. Maurice, J.-P.: Radar observations of the onset of current driven instabilities in the top-side ionosphere, Geophys. Res. Lett., 15, 160–163, 1988. Grydeland, T., La Hoz, C., Hagfors, T., Blixt, E. M., Saito, S.,
Strømme, A., and Brekke, A.: Interferometric observations of filamentary structures associated with plasma instability in the auroral ionosphere, Geophys. Res. Lett., 30, 1338, doi:10.1029/ 2002GL016362, 2003.
Grydeland, T., Blixt, E. M., Løvhaug, U. P., Hagfors, T., La Hoz, C., and Trondsen, T. S.: Interferometric radar observations of filamented structures due to plasma instabilities and their relation to dynamic auroral rays, Ann. Geophys., 22, 1115–1132, 2004, http://www.ann-geophys.net/22/1115/2004/.
Ivchenko, N., Blixt, E. M., and Lanchester, B. S.: Multispectral observations of auroral rays and curls, Geophys. Res. Lett., 32, 18 106, doi:10.1029/2005GL022650, 2005.
Kontar, E. P. and P´ecseli, H. L.: Nonlinear development of electron-beam-driven weak turbulence in an inhomogeneous plasma, Phys. Rev. E, 65, 066 408, doi:10.1103/PhysRevE.65.066408, 2002.
Kontar, E. P. and P´ecseli, H. L.: Nonlinear wave interac-tions as a model for naturally enhanced ion acoustic lines in the ionosphere, Geophys. Res. Lett., 32, 5110, doi:10.1029/ 2004GL022182, 2005.
Lorentzen, D. A., Kintner, P. M., Moen, J., Sigernes, F., Ok-savik, K., Ogawa, Y., and Holmes, J.: Pulsating dayside au-rora in relation to ion upflow events during a northward inter-planetary magnetic field (IMF) dominated by a strongly nega-tive IMF BY, J. Geophys. Res. (Space Physics), 112, 3301, doi:
Naturally enhanced ion-acoustic lines at high altitudes, Ann. Geophys., 24, 3351–3364, 2006,
http://www.ann-geophys.net/24/3351/2006/.
Rees, M. H.: Physics and chemistry of the upper atmosphere, Cam-bridge atmospheric and space science series, CamCam-bridge Univer-sity Press, Cambridge, 1989.
Rietveld, M. T., Collis, P. N., and St.-Maurice, J.-P.: Naturally En-hanced Ion Acoustic Waves in the Auroral Ionosphere Observed With the EISCAT 933-MHz Radar, J. Geophys. Res., 96, 19 291– 19 305, 1991.
Rietveld, M. T., Collis, P. N., van Eyken, A. P., and Løvhaug, U. P.: Coherent echoes during EISCAT UHF Common Programmes, J. Atmos. Terr. Phys., 58, 161–174, doi:10.1016/0021-9169(95) 00027-5, 1996.
Rietveld, M. T., Isham, B., Grydeland, T., La Hoz, C., Leyser, T. B., Honary, F., Ueda, H., Kosch, M., and Hagfors, T.: HF-pump induced parametric instabilities in the auroral E-region, Adv. Space Res., 29, 1363–1368, doi:10.1016/S0273-1177(02)00186-2, 2002.
Sedgemore-Schulthess, K. J. F. and St.-Maurice, J.-P.: Naturally en-hanced ion-acoustic spectra and their interpretation, Surv. Geo-phys., 22, 55–92, doi:10.1023/A:1010691026863, 2001. Semeter, J.: Critical comparison of OII(732–733 nm), OI(630 nm),
and N2(1PG) emissions in auroral rays, Geophys. Res. Lett., 35, 1225, doi:10.1029/2002GL015828, 2003.
Strømme, A., Belyey, V., Grydeland, T., La Hoz, C., Løvhaug, U. P., and Isham, B.: Evidence of naturally occurring wave-wave in-teractions in the polar ionosphere and its relation to naturally enhanced ion acoustic lines, Geophys. Res. Lett., 35, L05103, doi:10.1029/2004GL020239, 2005.
Vedenov, A. A., Velikhov, E. P., and Sagdeev, R. Z.: Quasi-linear theory of plasma oscillations, Nuclear Fusion Supplement, Part 2., 465–475, 1962.
Viljanen, A. and H¨akkinen, L.: Image Magnetometer Network, in: Satellite-Ground Based Coordination Sourcebook, edited by: Lockwood, M., Wild, M. N., and Opgenoorth, H. J., vol. 1198 of ESA Special Publication, pp. 111–118, 1997.
Wahlund, J.-E., Forme, F. R. E., Opgenoorth, H. J., Persson, M. A. L., Mishin, E. V., and Volokitin, A. S.: Scattering of elec-tromagnetic waves from a plasma: enhanced ion acoustic fluc-tuations due to ion-ion two-stream instabilities, Geophys. Res. Lett., 19, 1919–1922, 1992.