IJEDR1604032 International Journal of Engineering Development and Research (www.ijedr.org) 188
Optimization of shrinkage in injection-molding of
40% glass filled nylon 66 using response surface
methodology (RSM) and genetic algorithm (GA)
1
Ashwani kapoor, 2 Mr. Deepak Kumar 1
M.Tech scholar Poornima College of Engineering, Jaipur, 2
AssociateProfessor, Poornima College of Engineering, Jaipur,
______________________________________________________________________________________________
Abstract - In plastic injection molding, process parameters play a major role in the product quality. The values of process parameters depend on varies thinks like, type of plastics, the dimension of the object, dimensional tolerance, etc., so there is no set values and formula of different process parameters. Two-stage optimization technique, response surface methodology (RSM) and genetic algorithm (GA) used to analyze and optimizing a product, for improving its quality by reducing shrinkage. First with the help of literature survey, find most significant process parameters which profoundly influence the shrinkage, also their level. The l evel also affected by the type of plastics and injection machine. After that with the help of design of experiment (DOE) tool which is part of RSM, develop a sequence of experiment and perform them. RSM gives an analysis of variance (ANOVA) table, after removing insignificant terms from the quadratic model, got equation. This equation is use in GA, and GA gives best possible values of process parameters to minimize the shrinkage. So after optimization, optimized values of process parameters are Mold temperature (MT) 106.18 °c, Packing
time (Pt) 5.16 sec, Packing pressure (PP) 14.53 MPa, Cooling time (Ct) 10 sec. Which results in decreasing Shrinkage by 34.783 %.
Key Words – PIM, RSM, GA, Nylon, Shrinkage, Optimization, DOE
________________________________________________________________________________________________________
I.INTRODUCTION
In plastics injection molding (PIM) there is a requirement of developing more efficient management system which can minimize the deficits in plastic manufacturing. This literature includes information about the injection molding of plastic and their parameters used in the previous studies. As a result, optimization of the parameters in PIM is important regarding minimizing shrinkage. Minimizing the parameters is not a new concept, but the parameters are different for different machines and products, so it is required to figure out optimality of them every time. Therefore, in this manner, some of the techniques like RSM, GA and combination of them are used to minimize failures in plastics.
Injection molding is widely used to make plastic parts because this method is low cost, less time commuting, and excellent dimensional tolerance. Moreover, there are some more advantages are their like light weight of part and high finish of surface of optioned part, which make this process more superior than other. Beside this, plastic injection molding is a very complex process. One of the followings can increase defects in an object like improper mold design, inappropriate material selection and most important improper selection of process parameters. [1][2][3]
The object design and mold design both are mainly done at initial stages of product development, which cannot easily and directly change. So the proper selection of process parameters is the only method to decrease defects and increase quality. [4]
In today production system 30% of plastic parts are made by plastic injection molding. Proper selection of process parameters is called as “Black Art” because it depends on upon experience and previous knowledge of machine operator and includes a trial-and-error process. Many researchers are work on it to eliminate the costly trial-and-trial-and-error method by various techniques.[5][3]
In injection molding process there are mainly three stages: filling phase (packing phase), cooling phase and ejection phase. Cooling phase influences productivity and quality of the product. In injection molding, there are many process parameters which depend on and controlled by the machine of plastic injection molding.[6]
At time of manufacturing, quality terms of object such as shrinkages such as shrinkage, warpage, weld lines, mold lines, flow marks, flash marks, sink marks, and void depend on upon process parameters which include Melt temperature, Mold temperature, Injection pressure, Cooling time, Cooling temperature, Screw speed, Packing pressure , Packing time, Cycle time, Fill time, Injection speed [7][8]. Plastic injection molding is one of the important net-shape-forming processes for plastic material like thermoplastics. During this process some defect may occur like: Warpage, Sink marks, Shrinkage, Air traps or voids, Weld lines, Mold lines, Flow marks, Flash marks. However, all defects can avoid and removed by proper selection and optimization of process parameters [9].
Different researchers apply various methods for optimization. Reddy et al.[7] had applied mold flow simulation software and ANN for prediction of warpage in plastic injection molded part. This study proposed further extension by considering number process parameters and output characteristics. Kamaruddin et al.[8] focused only on Taguchi method and target on bending deflection of the plastic tray. The L9 OA with three levels of four process parameters used. In this study melting temperature, injection speed, cooling time, and holding pressure investigated. The result shows holding pressures was the main contribution of all parameters.
IJEDR1604032 International Journal of Engineering Development and Research (www.ijedr.org) 189 conquer this difficulty by allowing the benefits of each technique and to discard their weaknesses. However, the best result can only be attained by picking the right process parameters. In previous studies, researchers combined many optimization techniques such as Taguchi, RSM, GA, PSO, SA, and others to improve the quality of the plastic product.
II.EXPERIMENTALSET-UP
Material, Specimen and Mold Preparation
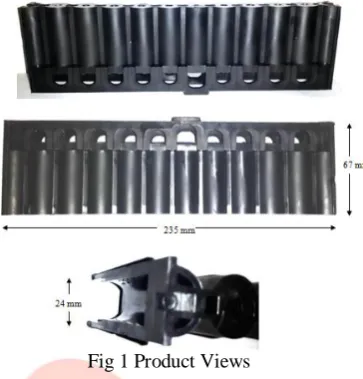
The size of this product is 235×24×67 (L×W×H×) in mm; the wall thickness is 3 mm as shown in Fig 1Error! Reference source not found..
Fig 1 Product Views
The plastics used in this product is a commonly and commercially used grade of 40% Glass Filled Nylon 66 [11][12], and its material properties listed in Table 1. The technical details of injection molding machine are in Table 1.
Table 1 Properties of Nylon with 44% Glass Filled
THERMAL PROPERTIES UNIT (METRIC)
Melting Point 263.0 °C
Deflection Temperature at 1.8 MPa (264 psi) 255 °C
PROCESSING PROPERTIES UNIT (METRIC)
Feed Temperature 260 - 270 °C
Middle Barrel Temperature 270 - 280 °C
Front Barrel Temperature 280 - 290 °C
Nozzle Temperature 271 - 279 °C
Melt Temperature 270 - 300 °C
Mold Temperature 80.0 - 120 °C
Drying Temperature 80.0 °C
Dry Time 3 - 4 hour
Moisture Content <= 0.20 %
Fill Speed 200 - 300 mm/sec
IJEDR1604032 International Journal of Engineering Development and Research (www.ijedr.org) 190 Fig 2 (A) J.I.T. Injection Molding Machine (B) Shrinkage measurement with help of vernier height gauge Machining Performances and Evaluation
The machining output in terms product indicated by the shrinkage. In this experiment, the values of shrinkages are examined by using the given formula:
S=Lcavity −Lpart
𝐿𝑐𝑎𝑣𝑖𝑡𝑦 X 100 % ……….Eq 1. Where,
Lcavity = inner total length of the cavity and Lpart = total length of the out came product.
The measurement along with the long length is taken here by using a “vernier height gauge” with least count 0.02 mm as shown in Fig 2 (B).
Selection of Machining Parameter and Plan of Experiment
The selected factors for machining parameter and the factorial levels taken from the processing guides of Nylon 66 with 40% Glass Filled material [11][12] and the linked processing parameters according to mechanical equipment used. For optimization of shrinkage and warpage, this study is focused mainly on the influences of the machining parameter in the packing stage. From the literature review, there are four machining parameters which largely influence shrinkage; these are mold temperature (MT), packing time (Pt), packing pressure (PP) and cooling time (Ct) in the packing stage. Table 2Table shows the levels of four machining parameters.
Table 2 Design scheme and levels machining parameters
SYMBOL FACTOR UNIT LEVELS
LOW (-1) HIGH (+1)
A Mold temperature (MT) °C 80 120
B Packing time (Pt) Sec 3 6
C Packing pressure (PP) MPa 10 15
D Cooling time (Ct) Sec 8 12
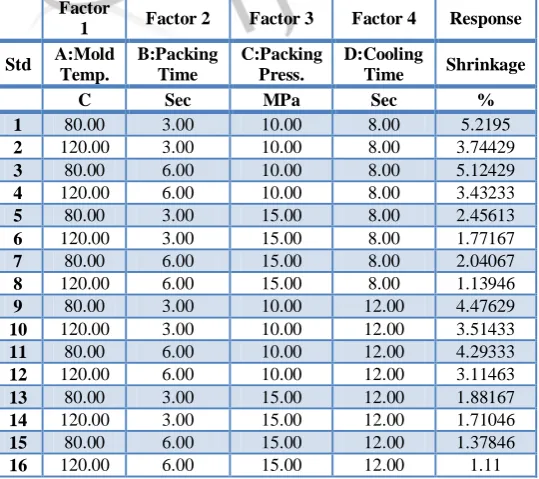
The experimental plan is generated using the predetermined order based on the face-centered CCD and which involves different 30 runs as shown in Error! Reference source not found. 3 and value of shrinkage after experiment. Each run will be repeated three times with the same conditions at the different period to get a more precise result in this method.
Table 3 Result of Machine performance evaluation of Shrinkage Factor
1 Factor 2 Factor 3 Factor 4 Response
Std A:Mold Temp.
B:Packing Time
C:Packing Press.
D:Cooling
Time Shrinkage
C Sec MPa Sec %
1 80.00 3.00 10.00 8.00 5.2195
2 120.00 3.00 10.00 8.00 3.74429
3 80.00 6.00 10.00 8.00 5.12429
4 120.00 6.00 10.00 8.00 3.43233
5 80.00 3.00 15.00 8.00 2.45613
6 120.00 3.00 15.00 8.00 1.77167
7 80.00 6.00 15.00 8.00 2.04067
8 120.00 6.00 15.00 8.00 1.13946
9 80.00 3.00 10.00 12.00 4.47629
10 120.00 3.00 10.00 12.00 3.51433
11 80.00 6.00 10.00 12.00 4.29333
12 120.00 6.00 10.00 12.00 3.11463
13 80.00 3.00 15.00 12.00 1.88167
14 120.00 3.00 15.00 12.00 1.71046
15 80.00 6.00 15.00 12.00 1.37846
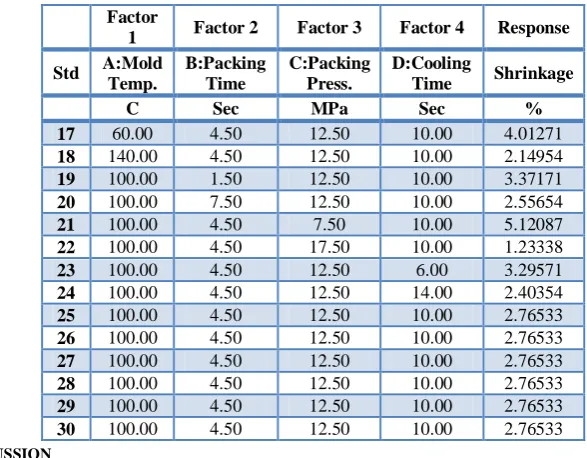
IJEDR1604032 International Journal of Engineering Development and Research (www.ijedr.org) 191 Factor
1 Factor 2 Factor 3 Factor 4 Response
Std A:Mold Temp.
B:Packing Time
C:Packing Press.
D:Cooling
Time Shrinkage
C Sec MPa Sec %
17 60.00 4.50 12.50 10.00 4.01271
18 140.00 4.50 12.50 10.00 2.14954
19 100.00 1.50 12.50 10.00 3.37171
20 100.00 7.50 12.50 10.00 2.55654
21 100.00 4.50 7.50 10.00 5.12087
22 100.00 4.50 17.50 10.00 1.23338
23 100.00 4.50 12.50 6.00 3.29571
24 100.00 4.50 12.50 14.00 2.40354
25 100.00 4.50 12.50 10.00 2.76533
26 100.00 4.50 12.50 10.00 2.76533
27 100.00 4.50 12.50 10.00 2.76533
28 100.00 4.50 12.50 10.00 2.76533
29 100.00 4.50 12.50 10.00 2.76533
30 100.00 4.50 12.50 10.00 2.76533
III.RESULTS AND DISCUSSION
ANOVA analysis of shrinkage
The results of the quadratic model for the shrinkage in the form of ANOVA presented in table 4. The value of Probability of F in table 4 for this model is less than 0.05 (i.e. α=0.05, or 95% confidence) indicates that the model is considered to be statistically significant, which is wanted as it shows that the conditions in the model have a significant result on the shrinkage. The Model F-value of 107.55 shows the model is great. There is only a 0.01% possibility that an F-F-value this large might happen due to noise. A value of Probability of F is less than 0.0500 shows that model terms are significant. In this study, A, B, C, D, AC, AD, C2 are significant model terms. The remaining terms have not considerable effect because their Probability of F is greater than 0.05. These non-considerable terms can remove, and the analysis of lack-of-fit as well displays as insignificant.
From Table 5 the Predicted R2 of 0.9432 is in sensible accord with the Adjusted R2 of 0.9808; i.e. the difference is less than 0.2. Adequate Precision measures the signal to noise ratio. A ratio must be greater than four is wanted. In this experiment ratio is 39.629 indicates a sufficient symbol.
Table 4 Quadratic model for the shrinkage in ANOVA (before elimination) Source Sum of
Squares
df Mean Square
F Value
p-value Prob > F
Model 39.42 14 2.82 107.55 < 0.0001 significant
A-Mold temp. 5.10 1 5.10 194.65 < 0.0001
B-Packing Time 0.95 1 0.95 36.23 < 0.0001
C-Packing Press.
30.84 1 30.84 1177.84 < 0.0001
D-Cooling time 1.14 1 1.14 43.59 < 0.0001
AB 0.035 1 0.035 1.33 0.2662
AC 0.67 1 0.67 25.72 0.0001
AD 0.29 1 0.29 11.27 0.0043
BC 0.084 1 0.084 3.22 0.0929
BD 3.350E-003 1 3.350E-003 0.13 0.7256
CD 0.039 1 0.039 1.51 0.2385
A2 0.097 1 0.097 3.69 0.0739
B2 0.025 1 0.025 0.95 0.3452
C2 0.19 1 0.19 7.28 0.0165
D2 6.044E-005 1 6.044E-005 2.308E-003 0.9623
Residual 0.39 15 0.026
Lack of Fit 0.39 10 0.039 0 0 Non-significant
Pure Error 0.000 5 0.000
Cor Total 39.82 29
Table 5 R2 for the response – shrinkage (before elimination) Std. Dev. 0.16 R2 0.9901
IJEDR1604032 International Journal of Engineering Development and Research (www.ijedr.org) 192 With the help of backward elimination process, it eliminates the unimportant terms to correct the quadratic model of shrinkage. The new result of ANOVA table after removing non-considerable terms for the shrinkage presented in Table 6. The compact model results expose that this model is still significant in the rank of the value of Probability of F is less than 0.05, and the check of lack-of- fit is as well insignificant because the Probability of F value greater than 0.05. The additional key coefficient R2 in the resulting ANOVA table explains the ratio of the explain variation to the total variation. It is a shows the degree of fit.
Table 6 Modified model for the shrinkage in ANOVA (after backward elimination)
Source Sum of
Squares
Df Mean Square
F Value
p-value Prob > F
Model 39.15 7 5.59 184.41 < 0.0001 Significant A-Mold temp. 5.10 1 5.10 168.04 < 0.0001
B-Packing Time 0.95 1 0.95 31.28 < 0.0001 C-Packing Press. 30.84 1 30.84 1016.87 < 0.0001 D-Cooling time 1.14 1 1.14 37.63 < 0.0001
AC 0.67 1 0.67 22.21 0.0001
AD 0.29 1 0.29 9.73 0.0050
C2 0.15 1 0.15 5.10 0.0342
Residual 0.67 22 0.030
Lack of Fit 0.67 17 0.039 0 0 Non-significant
Pure Error 0.000 5 0.000
Cor Total 39.82 29
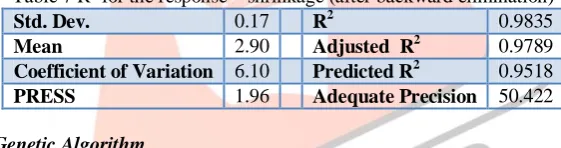
As we when R2 approaches unity; the response model fits the Actual data much batter. The value of R2 shown in Table 7, for reduced model this value is over 0.95, which is reasonably near to unity, which one acceptably good. It means that the new model explains about 95% of the unpredictability (variability) in the data. It also verifies that this model presents a brilliant justification to the relationship between the independent factors and the response (shrinkage). The Predicted R2 of 0.9518 is in reasonable concord with the Adjusted R2 of 0.9789; because the difference between them is less than 0.2. As we know that ratio must be greater than four is wanted, in our experiment ratio is 50.422, which indicates an enough signal.
Table 7 R2 for the response – shrinkage (after backward elimination)
Std. Dev. 0.17 R2 0.9835
Mean 2.90 Adjusted R2 0.9789 Coefficient of Variation 6.10 Predicted R2 0.9518 PRESS 1.96 Adequate Precision 50.422
Shrinkage Optimization by Genetic Algorithm
The optimal process for machining the 40% Glass Filled Nylon 66 with the constraints of machining parameters range is to find the optimal values of machining parameters (X) to minimize the amount of shrinkage during the plastic injection molding process. The optimization problem can be approximated by the following Eq and then solved using a GA method on MATLAB Software.
Find X =[MT; Pt; PP; Ct] to minimize f (X) =S
Subject to 80 < MT < 120 °C, 3<Pt <6 sec, 10 < PP < 15 MPa, 9 < Ct < 12 sec
The feasible ranges of MT, Pt, PP and Ct have been selected based on the recommended value in the processing guides of material used (40% Glass Filled Nylon 66).
Shrinkage = +22.85958 -0.10828 * x(1) -0.13254 * x(2) -1.15675 * x(3) - 0.44848 * x(4) + 4.10313e-003* x(1)* x(3) +3.39453e-003 * x(1) * x(4) + 0.011721 * x(3)^2….Eq 2
IJEDR1604032 International Journal of Engineering Development and Research (www.ijedr.org) 193 Table 8 The comparison between initial value and optimal value
Parameters Unit Initial value Optimal value Optimal value % redaction
Mold temperature (MT) °c 100 106.18
Packing time (Pt) Sec 4.5 5.16
Packing pressure (PP) MPa 12.5 14.53
Cooling time (Ct) Sec 10 10
Shrinkage (S) % 2.76 1.80 34.783 %
IV.CONCLUSIONS
The conclusions of the research are as follows:
1. The results of ANOVA and performance explain that the quadratic models of the shrinkage are quite well fit through the experimental values. It has analyzed that controls of all the process parameters on the performance of shrinkage by the getting mathematical models.
2. The value of shrinkage increases as the mold temperature increases. The sufficient time of cooling and packing is beneficial for minimizing the amount of shrinkage. The proper setting of packing pressure and packing time can provide enough melt volume in the packing stage and can diminish the phenomenon of shrinkage.
3. The four machining parameters with the optimum adjustment obtained by using the GA. For the manufacture of 40% Glass Filled Nylon 66 product, the optimal values of shrinkage represent a reduction of 34.783 after this process.
V.ACKNOWLEDGMENT
I acknowledge my sincere thanks to my guide, Dr. Ashok Kumar Sharma for his continuous support in my dissertation work and also Mr. Karthika, Central Institute of Plastics Engineering and Technology (CIPET), Jaipur for allowing me to do this work at the company and provide his guidance.
REFERENCES
[1] W.-C. Chen and D. Kurniawan, “Process parameters optimization for multiple quality characteristics in plastic injection molding using Taguchi method, BPNN, GA, and hybrid PSO-GA,” Int. J. Precis. Eng. Manuf., vol. 15, no. 8, pp. 1583– 1593, Aug. 2014.
[2] X.-P. Dang and H.-S. Park, “Design of U-shape milled groove conformal cooling channels for plastic injection mold,” Int. J. Precis. Eng. Manuf., vol. 12, no. 1, pp. 73–84, Feb. 2011.
[3] S. H. Tang, Y. J. Tan, S. M. Sapuan, S. Sulaiman, N. Ismail, and R. Samin, “The use of Taguchi method in the design of plastic injection mould for reducing warpage,” J. Mater. Process. Technol., vol. 182, no. 1–3, pp. 418–426, Feb. 2007. [4] H. Shi, S. Xie, and X. Wang, “A warpage optimization method for injection molding using artificial neural network with
parametric sampling evaluation strategy,” Int. J. Adv. Manuf. Technol., vol. 65, no. 1–4, pp. 343–353, May 2012. [5] D. Mathivanan and N. S. Parthasarathy, “Prediction of sink depths using nonlinear modeling of injection molding
variables,” Int. J. Adv. Manuf. Technol., vol. 43, no. 7–8, pp. 654–663, Sep. 2008.
[6] H.-S. Park and X.-P. Dang, “Optimization of conformal cooling channels with array of baffles for plastic injection mold,”
Int. J. Precis. Eng. Manuf., vol. 11, no. 6, pp. 879–890, Dec. 2010.
[7] B. Reddy and J. Kumar, “Application of soft computing for the prediction of warpage of plastic injection molded parts,”
J. Eng. Sci. Technol. Rev, vol. 2, no. 12, pp. 8071–8083, 2009.
[8] S. Kamaruddin, Z. A. Khan, K. S. Wan, and N. Tebal, “The Use Of The Taguchi Method In Determining The Optimum Plastic Injection Moulding Parameters For The Production Of A Consumer,” J. Mek., pp. 98–110, 2004.
[9] W. Guo, L. Hua, H. Mao, and Z. Meng, “Prediction of warpage in plastic injection molding based on design of experiments,” J. Mech. Sci. Technol., vol. 26, no. 4, pp. 1133–1139, Apr. 2012.
[10] B. Ozcelik and T. Erzurumlu, “Determination of effecting dimensional parameters on warpage of thin shell plastic parts using integrated response surface method and genetic algorithm,” Int. Commun. Heat Mass Transf., vol. 32, no. 8, pp. 1085–1094, Aug. 2005.
[11] “Adell AL-18 Nylon 66, 40% Glass Reinforced; Mineral Filled.” [Online]. Available:
http://www.matweb.com/search/datasheet.aspx?matguid=caf9958fd67f4d4381b9effd3bd2fd18&ckck=1. [Accessed: 08-Jun-2015].