recordings using multiple image processing
algorithms
Keith Anthony Roscoe
A dissertation submitted in partial fulfillment o f the requirements for the degree o f
Doctor o f Philosophy
o f the
University o f London.
Image Processing Group Department o f Physics and Astronomy
University College London
uest.
ProQuest U641939
Published by ProQuest LLC(2015). Copyright of the Dissertation is held by the Author.
All rights reserved.
This work is protected against unauthorized copying under Title 17, United States Code.
Microform Edition © ProQuest LLC.
ProQuest LLC
789 East Eisenhower Parkway
P.O. Box 1346
This thesis deals with the enhancement o f image quality in analogue videotape recordings from closed-circuit television cameras. The severity and frequency o f twenty image-degrading fac tors was investigated. In order o f ranking, the six most frequent problems were found to be blurring, jitter, local motion, illumination variation, low contrast and m edia faults. Both exist ing and improved algorithms for dealing with these problems are described.
M ost o f the thesis contains an analysis o f both existing and new algorithms for dealing with the worst problems. In general, it was found that only small improvements could be obtained with blurred images. However, much could be done to overcome the effect o f line-to-line jitter, and a large portion o f the thesis is devoted to existing and to new dejittering algorithms. A new method is described that is some two thousand times faster than the best previously reported dejittering algorithm. An extensive comparison o f contrast enhancement methods was also carried out; media faults were treated with noise-reducing algorithms; and speckle noise, electrical noise and signal dropout were also examined.
advice and generally helping to make this work possible: Juliet Rason, Terry Kent, Ian Sail, Paul Gugenheim, Claire Summers and Simon Walker.I am also grateful to G eoff Oxlee o f the Kalagate Imaging Bureau with whom I had a valuable discussion on this subject, and who also provided some o f the CCTV footage used throughout this work.
1 Introduction 18
1.1 M otivation ... 18
1.2 O b je c tiv e s... 19
1.3 Thesis s tr u c tu r e ... 20
2 Video image quality surveys 21 2.1 Police Scientific Development Branch s u r v e y ... 21
2.2 Degradation effects in magnetic tape re c o rd in g s ... 22
2.2.1 Tape r e - u s e ... 22
2.2.2 Other media e f fe c ts ... 23
2.2.3 Tape u s a g e ... 23
2.3 Video imagery degradation s u r v e y ... 24
2.3.1 Degradation c a te g o rie s ... 24
2.3.2 Individual category d e s c rip tio n s ... 25
2.3.3 Survey results ... 31
2.4 Choice o f degradations for further analysis ... 32
2.5 Representative images ... 33
3 Survey o f existing algorithms 37 3.1 In tro d u c tio n ... 37
3.1.1 Exclusion o f temporal methods ... 38
3.1.2 Image data s e t s ... 38
3.2 Scanline sh a rp en in g ... 38
3.3 General image d e b lu rrin g ... 39
3.3.1 Carasso d e b lu r r in g ... 41
3.3.2 C onclusions... 43
3.4 Local motion deblurring ... 44
3.4.1 C onclusions... 46
3.5 Camera motion blur and interlace tearing ... 46
3.6 Image noise re d u c tio n ... 47
3.6.1 Noise caused by scratched v id e o ta p e s ... 48
3.6.2 Median f i l t e r ... 48
3.6.7 Noise reduction summary ... 62
3.7 Contrast enhancem ent... 63
3.7.1 W eber’s l a w ... 63
3.7.2 Global contrast en h an cem en t... 63
3.7.2.1 Greylevel s tr e tc h in g ... 63
3.7.2.2 Local mean field subtraction ... 64
3.7.2.3 Histogram e q u a li s a ti o n ... 64
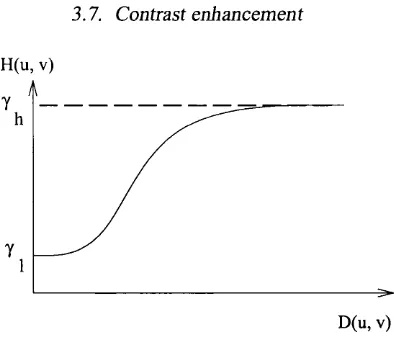
3.7.2.4 Homomorphic filtering ... 64
3.7.2.5 Statistical d iffe ren c in g ... 6 6 3.7.2.6 Blind inverse gamm a c o rre c tio n ... 6 6 3.7.2.7 Multiscale r e t i n e x ... 67
3.7.2. 8 Example globally enhanced im a g e s ... 6 8 3.7.3 Local contrast e n h a n c e m e n t... 70
3.7.3.1 Unsharp masking ... 70
3.7.3.2 Basic unsharp m a s k i n g ... 70
3.7.3.3 Quadratic F ilte r s ... 70
3.7.4 Contrast enhancement s u m m a r y ... 71
3.7.4.1 Global m e t h o d s ... 71
3.7.4.2 Local m e th o d s ... 71
3.8 Image d e j i t te r i n g ... 73
3.8.1 Methods o f dealing with j i t t e r ... 73
3.8.2 Drift c o m p e n sa tio n ... 75
3.8.3 C o r r e la tio n ... 76
3.8.3.1 Two dimensional tem plate m a t c h i n g ... 76
3.8.3.2 One-dimensional correlation ... 77
3.8.3.3 Cumulative s h i f t s ... 77
3.8.3.4 Example dejittered images ... 77
3.8.4 Kokaram dejittering a lg o r ith m ... 77
3.8.4.1 Implementation details ... 80
3.8.4.2 Complexity o f Kokaram a l g o r i t h m ... 80
3.8.5 The Houghton dejittering m e t h o d ... 82
3.8.6 Sample results ... 84
3.8.7 Time-base c o r re c tio n ... 8 6 3.8.7.1 Comparison with post-processing a lg o rith m s... 87
3.8.7.2 A n a ly s i s ... 87
3.8.7.3 Real jitter e x a m p le s ... 89
3.8.7.4 Interlace t e a r i n g ... 89
3.8.8 Dejittering s u m m a r y ... 90
3.9 Chapter s u m m a ry ... 90
New pre-processing m ethods 93 4.1 In tro d u c tio n ... 93
4.2 Illumination field compensation ... 93
4.2.1 R e s u l t s ... 96
4.3 Image d e j i t te r i n g ... 97
4.3.1 In tro d u ctio n ... 97
4.3.2 Drift co m p e n sa tio n ... 97
4.3.3 Improvements to Houghton a lg o r ith m ... 97
4.3.4 The Hodgetts-Roscoe (HR) a lg o r ith m ... 99
4.3.4.1 Relative and absolute s h i f t s ...101
4.3.4.2 Finding the maximum o f the correlation m a p ... 101
4.3.4.3 Fit m o d e l... 102
4.3.4.4 R e s u lts ... 103
4.3.5 The porch-fitting m e th o d ... 105
4.3.5.1 The image scanline ... 105
4.3.5.2 The fitting procedure ...105
4.3.5.3 Trailing edge front p o rch -fittin g... 107
4.3.5.4 Discussion o f a lg o rith m ... 107
4.3.5.5 Im p ro v e m e n ts ... 109
4.3.6 R e s u l t s ...109
4.3.6.1 Validity o f alignment m o d e l...109
4.4 Intra-line jitter problem definition ... 112
4.5 Issues and c o n s tra in ts ... 112
4.6 Review o f te c h n iq u e s ... 112
4.7 Description o f a lg o rith m s...113
4.8 Definition o f evaluation methodology ... 114
4.9 Definition and description o f e x p e r im e n ts ...114
4.9.1 Dejittering b y ‘eye’ ...114
4.9.2 Houghton r e s u l t s ...119
4.9.3 Sara method r e s u lts ...119
4.10 Intra-line: d is c u s s io n ... 119
4.11 Sara stereo matching algorithm for use in inter-line dejittering ... 121
5.3.2.1 Periodic noise e n h a n cem en t... 136
5.4 Noise reduction a lg o rith m s ...143
5.4.1 Speckle n o i s e ...143
5.4.2 Gaussian n o i s e ...143
5.4.3 Line d r o p o u t ...143
5.5 Deblurring alg o rith m s...147
5.6 C o n c lu sio n s... 147
6 Serial combination o f algorithms 150 6.1 In tro d u c tio n ... 150
6.1.1 Choice o f a lg o rith m s ...150
6.2 Im p le m e n ta tio n ...151
6.2.1 Branch p r u n i n g ...152
6.3 Results o f the serial application p r o c e s s ...153
6.3.1 Jittered c a r ... 153
6.3.2 Shop i n t e r i o r ... 159
6.3.3 Travel a g e n t... 164
6.3.4 Scrap steel ...168
6.4 Combinatorial processing g u id e lin e s ... 171
6.5 S u m m a r y ...172
7 Conclusions 173 7.1 S u m m a r y ...173
7.2 Contributions made to the f i e l d ... 173
7.3 Potential a p p lic a tio n s ...174
7.4 Possibilities for future w o rk ... 174
7.5 Concluding re m a rk s... 174
A Test set images for the combinatorial assessment 176 B Generalised SD-ROM denoising 182 B .l Basics o f filter o p e r a t i o n ... 182
B.3 Recursive filter tr a in in g ...184
C Blind inverse gamma correction 185 C .l Higher-order statistics (H O S )... 185
C.2 Higher-order c o rre la tio n s ...185
C.3 Bispectrum and B ic o h e re n c e ... 186
C.4 Effect o f noise on gamma e stim a tio n ...187
C.5 Mode o f o p eratio n... 187
D Quadratic and higher-order unsharp mask filters 188 D .l Teager based f ilte r... 188
D.2 Cubic unsharp m a s k ...188
D.3 Edge-offset cubic unsharp m a sk in g ... 189
D.4 Mean-weighted edge-offset unsharp masking ... 189
D.5 Novel product o f linear filters (PLF) unsharp m a s k in g ...189
D. 6 Normalised unsharp m a s k in g ... 190
D.7 Rational unsharp m a sk in g ...190
D. 8 Adaptive unsharp m a s k i n g ...191
£ Normalisation o f Forshaw control function 194 F Extra dejittering results 195 G The Sara Stereo matching algorithm 199 G .l In tro d u c tio n ... 199
G.2 Stable m a tc h in g ...199
G.3 Other implementation d e t a i l s ...201
H Performance o f the individual dejittering algorithms 202 I Evaluation o f image quality 205 1.1 In tro d u c tio n ...205
1.2 Algorithm performance c h a ra c te risa tio n ...205
1.3 Conventional quality m e a s u r e s ...207
1.4 S u m m a r y ... 208
J Establishing a known ground-truth 209 J.l In tro d u c tio n ...209
J.2 Establishing a known ground t r u t h ...209
J.2.1 P ro c e d u re ...209
J.2.2 Image re sam p lin g ... 210
J.3 Line-to-line dejittering performance m e a s u r e s ... 214
J.3.1 Spectral shift e s ti m a t io n ... 214
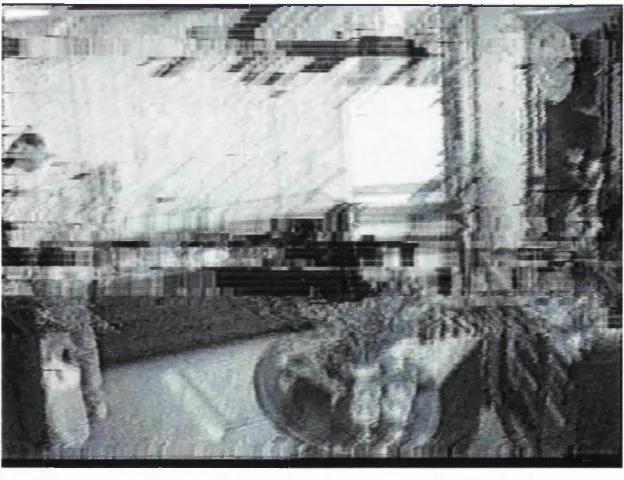
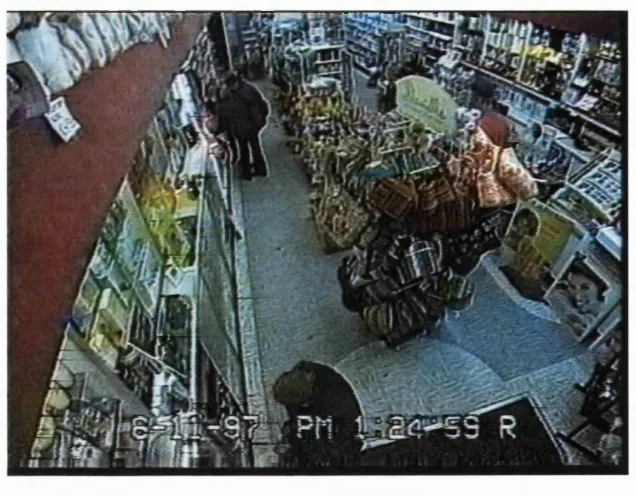
2.1 Survey summary. Degradations and their frequency o f occurence. Sorted on the present category... 32 2.2 This is a particularly bad image that shows a range o f problems that can occur in CCTV recordings. The most significant degradation source was a problem with the recording mechanism that meant that while one field o f the image was recorded well, the other field was severely corrupted. Removing the corrupted field can lead to a significant improvement in the quality o f the scene. Also present in the scene are line-to-line jitter and signal dropout. These are particu larly noticeable along the left hand edge o f the image. Other problems with the image are that it is generally noisy and there is a region o f local saturation at the entrance to the shop... 33 2.3 This shows some o f the problems that can occur with colour recordings. There
are problems with colours bleeding into their surroundings; this is most notice able around the yellow shelving at the centre o f the scene. Also the coat o f the person at the counter appears vividly as both red and green. The true colour o f the coat is red but regions o f it appear green in several o f the frames in this sequence... 34 2.4 This frame shows the problem o f massive saturation in a scene. The bright
source o f illumination in the centre o f the scene whites out the rest o f the image, preventing any other details o f the scene content from being seen... 34 2.5 This image shows global interlace tearing due to the rapid panning o f the recording camera. This can be seen most clearly in the lower portion o f the im age, where there are apparently two bins and the telegraph pole has a combed edge... 35 2.6 This image shows how ringing may affect an image. The people in the fore and
background o f the image all have a white halo around their edges due to ringing effects. The scene also suffers from some dropout, and on the right hand side o f the image there is some localised interlace tearing as the sales assistant is moving... 35 2.7 This frame shows many problems with a garage forecourt image. There is signal
3.5 Image formation process. From [19]... 46 3.6 M edian filtered image examples. The original, undistorted Lena image is shown
in figure 3.2(a)... 49 3.7 Image enhancem ent operation performed by the mode filter. ... 50 3.8 Relative positions o f the means and method o f truncating the local distribution.
From [12]... 50 3.9 Truncated median filter image examples. The original, undistorted Lena image
can be found in figure 3.2(a)... 51 3.10 Edge-preserving noise filter image examples [33]. The original, unblurred Lena
image can be found in figure 3.2(a)... 53 3.11 Comparison o f the operation o f the median filter and the thresholded SD-ROM
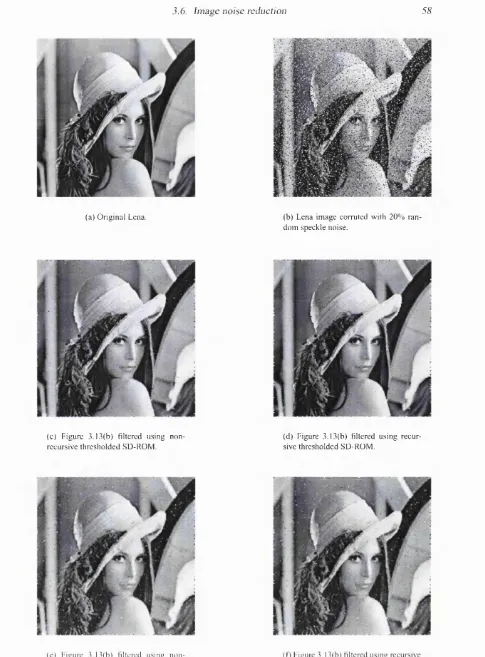
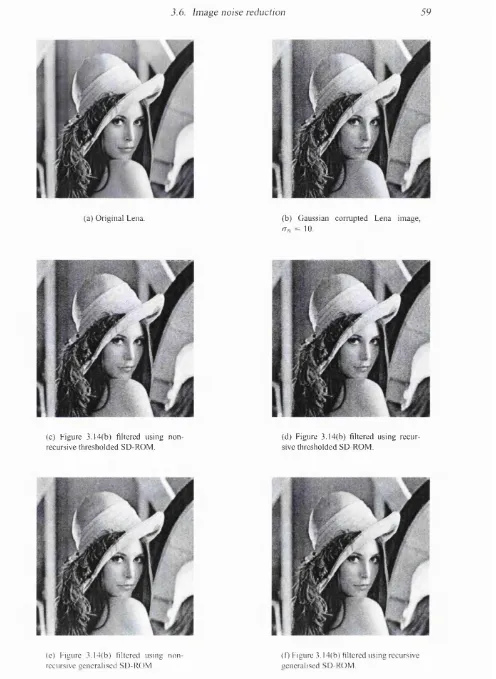
filter. Adapted from [37]... 55 3.12 Histogram decomposition using the method described by Jansen et al. [39]. . . 56 3.13 Examples o f SD-ROM filtering o f random-valued speckle noise... 58 3.14 Examples o f SD-ROM filtering o f additive Gaussian noise... 59 3.15 Illustration o f interpolation in the one dimensional case. Image from [33]. Two
possible positions are considered for the edge to be reconstructed. The original high resolution signal is shown in (a). Figure (b) shows this signal after low- pass filtering. Figure (c) shows the low-pass signal after decimation, where the sample Y obtained using linear interpolation. The sample Y in figure (d) is found using rational interpolation... 61 3.16 Example line dropout and restored images... 62 3.17 Example line dropout and restored im ages... 62 3.18 Cross-section o f circularly symmetric filter function. D { u ,v ) is the distance
from the origin. In this example 'yi = 0.2 and 7 / 1 = 1.2. Image taken from [8]. . 6 6 3.19 Blind gamma correction - synthetic results... 67 3.20 Global contrast enhancement method examples... 69 3.21 Local contrast enhanced Lena images. Details of the algorithms are discussed
in appendix D ... 72
3.24 Example o f using a 31-tap Hamming filter, on a set o f line-to-line jitter dis placement estimates, to remove the systematic drift associated with the image
structure... 76
3.25 Simple correlation based dejittering... 78
3.26 Causal and anti-causal support regions used in the Kokaram dejittering method. 79 3.27 Relationship between the sparseness o f the matrix G , to the number o f lines M , solved for in the W iener solution used in the Kokaram dejittering algorithm. . . 82
3.28 Linear intensity ramp. From Houghton et al. [54]... 83
3.29 Houghton algorithm set-up. Four pixels across two lines... 83
3.30 Sample dejittering algorithms results for the case o f synthetic jitter. The origi nal, undistorted Lena image is shown in figure 3.2(a)... 85
3.31 Sample dejittering line shift estimate accuracies... 8 6 3.32 TBC testchart samples. 85x85 pixels crops from full fram e... 8 8 3.33 TBC real jitter samples. 145 x 260 pixels cropped from a full fram e... 91
3.34 TBC real jitter samples. 100 x 100 pixels cropped from a full fram e... 92
4.1 FR illumination compensation control function... 94
4.2 Original and retinex processed scrap steel im ages... 95
4.3 The effect o f the applying the Forshaw illumination compensation algorithm to figure 4.2(a) at several space-scale resolutions... 96
4.4 Showing the effect o f changing the size o f the gradient calculation and the num ber o f iterations when using the Houghton dejittering algorithm. Iterating the algorithm more causes the line-shift estimate to further tend, on average, to wards the true value. However, the estimate never truely converges on the exact value ... 98
4.5 Example line estimates using all image content based m ethods... 103
4.6 Dejittering performance o f new algorithms, compared with old methods, on synthetic ally j ittered Lena im age... 104
4.7 Typical video scanline. Image from [62]... 105
4.8 The line-up point o f the back porch fitting m ethod...107
4.9 Sample leading edge o f image scanline (back porch) with fitted curve... 108
4.10 Sample trailing edge o f image scanline (front porch) with fitted curve... 108
the features after dejittering at one feature... 118
4.18 Houghton running-average estimate o f intra-line warping. Performed on adja cent lines o f a nony ittered, non-warped Lena im age...119
4.19 Example m apping for two adjacent lines in the synthetically jittered Lena image shown in figure 4.21. The relative shift between the two lines was estimated, by least-squares-fitting, as ~ 2.95 pixels, the exact shift value was 3.06 pixels. . . 120
4.20 Resultant mapping for two lines o f the jittered car im age... 120
4.21 Stereo-matching algorithm performing inter-line dejittering on a synthetically jittered Lena im age... 121
4.22 Performance o f the individual dejittering algorithms on the litter bin bitmap. There is no ground truth for the displacements. This graph is shown in greater detail in appendix H ... 122
4.23 Performance o f algorithms on litter bin image in figure 4.14(a)... 123
5.1 Original image o f a car that is degraded with jitter. Image from [40]. Marked areas are regions o f interest used later in this chapter...127
5.2 Figure 5.1 dejittered using the scanline-fitting method described in section 4.3.5. 128 5.3 ‘Jittered car’ image. Cropped region shows the word fog...128
5.4 ‘Jittered car’ image. Cropped region shows a p i l l a r . ... 129
5.5 ‘Jittered car’ image. Cropped region shows a m an’s face... 129
5.6 ‘Jittered car’ image. Cropped region shows a car w heel... 130
5.7 Original DV encoded image. 720 x 576 pixels...132
5.8 Fifth generation analogue copy that is significantly jittered...132
5.9 Dejittered using resampling method to establish an approximate ground-truth image with known line-shifts. Resampling method described in appendix J. . . 133
5.10 Dejittered using Kokaram algorithm... 133
5.11 Dejittered using the original Houghton m ethod... 134
5.12 Dejittered using the improved Houghton m ethod... 134
5.13 Dej ittered using the Hodgetts-Roscoe m ethod... 135
5.15 Original analogue video image o f a van in the dark...138
5.16 Image o f a van in the dark enhanced with the retinex m ethod... 138
5.17 Image o f a van in the dark enhanced with the FR method. Using a small value o f <^noise...139
5.18 Image o f a van in the dark enhanced with the FR method. Using a larger value o f (Jnoise- Note that the signal is starting to be sm oothed out as well as the noise. 139 5.19 The effect o f the adaptive unsharp mask on an analogue video recording o f the interior o f a shop... 140
5.20 The effect o f the adaptive unsharp mask on a first-generation analogue copy o f an image o f scrap steel. The original DV image is also shown for comparison. . 141
5.21 The problem o f periodic noise enhancement and the unsharp mask problem.. . . 142
5.22 Crop o f an analogue video image showing a striped testchart that contains sig nificant speckle and media noise...144
5.23 Cropped regions o f an analogue video image background showing the back ground o f an image that is affected by the presence o f random-valued noise. This result o f this image processed with a 3 x 3 mean filter is also shown. . . . 144
5.24 Original image portions with partial line dropout. Image in the leftmost column are original portions o f the image, the middle colum n shows the results o f the dropout filter, and the right column shows the results o f the plain SD-ROM noise reduction filter. More o f the dropout is removed using the SD-ROM filter, however the dropout filter only replaced dropped out pixels. The SD-ROM filter also removes other pixels throughout the image that m ay not be dropped out. . 145
5.25 A failed dropout restoration... 146
5.26 Failed dropout restoration...146
5.27 First-generation copy o f scrap-steel picture processed with the Carraso deblur ring algorithm. The original ground-truth DV format image is also shown for comparison...148
5.28 Face deblurred using Carasso deblurring m ethod... 149
6.1 Synthetic combinatorial example... 151
6.2 The combinatorial GUI interface... 152
6.3 An example audit trail associated with the com binatorial GUI shown in figure 6.2.152 6.4 Synthetically degraded Lena combinatorial tree. Total number o f algorithms n = 3, and the maximum chain length r = 3. P3 = 6... 154
6.5 M ottled appearance resulting from amplification o f random noise (by an un sharp mask algorithm), followed by the despeckling filte r... 155
6 . 6 ‘Jittered car’ combinatorial result. ‘Fog’ portion o f im age...156
6.7 ‘Jittered car’ combinatorial result. ‘Face’ portion o f im age... 157
6 . 8 The best combinatorial routes for the ‘jittered car’ im age...158
6.9 The ringing effect caused by using the unsharp mask filter (B) before the dropout-restoration filter (E)...160
A.2 CCTV footage o f a face at a shop window... 178
A.3 Surveilance footage o f a van parked outside a house at night... 178
A.4 Video image o f a car on a garage forecourt. Image from [40]... 179
A.5 CCTV footage o f the interior o f a shop...179
A. 6 CCTV footage o f the inside o f a supermarket... 180
A . l First-generation video image o f scrap steel... 180
A. 8 Fifth-generation video image o f a standard testchart... 181
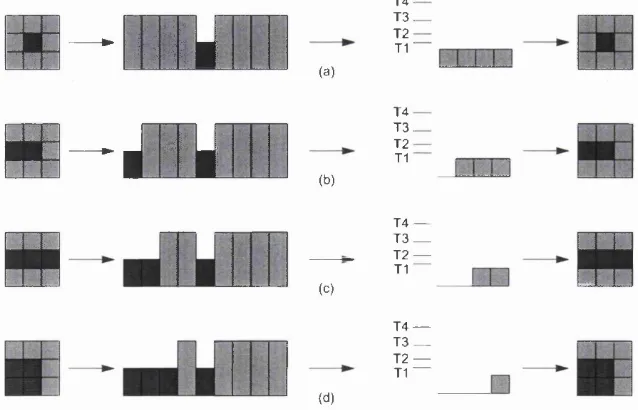
B .l Figure (a) shows the function a ( d ( n ) ) for the thresholded SD-ROM with d ( n ) 6 R ^. Figure (b) shows the function o ;(d (n )) for the generalised SD-ROM with d (n ) G R ^. Figure (c) shows the simplified function o ;(d(n)) for the generalised SD-ROM. Image from [33]... 183
D. 1 Plot o f the one-dimensional control function used in rational unsharp masking. 192 F. 1 Original j ittered image from [40]... 195
F.2 Dejittered using the Kokaram method. . ... 196
F.3 Dejittered using the original Houghton m ethod...196
F.4 Dejittered using the improved Houghton m ethod...197
F.5 Dejittered using the HR m ethod... 197
F. 6 Dejittered using the scanline-fitting m ethod... 198
G .l Example o f a conditioning pair. c o s t(P ) < cost(Q ) < c o st(5 ). P is condi tioning pair and S is the conditioned pair 200 H .l Original chart, reproduction o f figure 4.22... 203
H.2 Close-up o f lines 0-10 o f figure 4.22... 203
H.3 Close-up o f lines 10-20 o f figure 4.22... 204
H.4 Close-up o f lines 20-30 o f figure 4.22... 204
J.l N-th generation degradation scheme... 210
J.2 Original DV encoded image. 720 x 576 pixels... 211 J.3 Captured first-generation VHS copy o f image in figure J.2. 768 x 576 pixels.
J.4 This is the first-generation VHS copy, figure J.3, scaled, resampled and regis tered to correspond with figure J.2... 212 J.5 This is the fifth-generation VHS copy o f figure J.2, scaled, resampled and reg
istered. Notice that all the colour information has been lost for this image. . . . 212 J. 6 The distribution o f the resampling scale-factor. Gross outliers were removed
prior to binning... 214 J.7 The resampling offset factor in pixels. Ten generations o f copied images are
shown. The image number increases with the generation number, and as gross outliers have been removed approximately 15 images correspond to one gen eration. It would be expected that the offset would be constant across all the generations, or that the offset would be constant for each generation. This is shown experimentally to not be the case, and it is believed that the linear trend is caused by the increasing amount o f line-to-line jitter present in successive generations o f the images... 215 J. 8 Synthetically jittered and dejittered Lena image. Jitter estimation is performed
using the modified resampling procedure and the original ground-truth image. . 216 J.9 Actual line shifts and resampler estimates for images in figure J.8. The esti
mates coincide with the actual shifts exactly: any errors in the line shift esti mates were found to be in the third significant figure, o f the order o f hundreths o f a pixel... 216 J.IO Fifth-generation image dejittered using the modified resampling method. The
ground-truth image is shown in figure J.2...217 K .l Original image and associated power spectrum... 219 K.2 Processed image and associated, masked power spectrum. Ideal notch reject filter.220 K.3 Processed image and associated, masked power spectrum. Butterworth profile
and SP = strong presence. All figures are percentages. Sorted on the present
category... 31
3.1 Typical values for statistical differencing... 6 6 3.2 Quantity dimensions for the Wiener solution to the Kokaram algorithm... 81
3.3 Steps required to solve Kokaram ’s Wiener solution. The complexities o f the op erations are also shown. A quantity in {} shows the result o f a previous calcu lation. M atrix dimensions are shown as (number o f rows, number o f columns). Note that is a diagonal m atrix... 81
3.4 Dejittering algorithms execution times in seconds... 84
4.1 Parameter names and typical values for porch-fitting a lg o r ith m ...106
4.2 Execution time o f all the dejittering algorithms. Benchmarks were performed on a IGH z Pentium II P C ...124
4.3 Ratio o f execution times o f all the main dejittering algorithms with the HR algorithm... 124
5.1 Quantitative performance assessment o f the main dejittering algorithm s...131
6.1 Algorithm choices for serial combination o f algorithms work... 150
6.2 Chain permutation lengths, per image, f o r n = 8 algorithm s... 153
B .l Scalar partitions used for generalised SD-ROM (M = = 1296). Partitions shown for each scalar dimension o f d (n ) , with T\ = 8, T2 = 20, T3 = 40 and T4 = 50. From [33]... 183
Introduction
1.1
Motivation
Owing to the large installation base o f closed-circuit television (CCTV) systems in the UK, the police service receives many video recordings a year containing scenes that are potentially o f interest in criminal prosecution proceedings. As well as higher-quality systems installed by local authorities or large businesses, low-cost, lower-quality, CCTV survillance systems are available to buy from high-street retailers. This means that CCTV installations can be found in most shops and businesses. The prevalence o f CCTV camera has led to the reviewing o f CCTV footage in a criminal investigation becoming more commonplace.
As CCTV video footage comes from a multitude o f sources in a variety o f formats, it is o f widely varying quality, and may be recorded in either black-and-white or colour. Videos from CCTV cameras are most commonly stored on VHS or S-VHS magnetic tape, but Betamax is also widely used and DV (digital video) is starting to be used. All the CCTV stills used in this thesis are PAL encoded from either VHS or S-VHS sources. An accessible description o f the technical details o f the PAL standard may be found in [1].
The recording quality o f any system is substantially reduced if the equipment is ill- maintained or dirty. Where recordings are watched infrequently, a system that makes poor recordings may only be discovered when a recorded incident is subsequently reviewed. In this case image enhancement may be required to get the most from the footage.
Town and city-centre CCTV surveillance systems often produce high-quality output, but the cameras are generally m ounted high on buildings or poles. This can mean that the region o f interest in a scene may only occupy a very small area. This can happen if an incident occurs in a portion o f a scene that the camera was not primarily designed to observe. For example, a camera that has been positioned above a road junction to m onitor the traffic flow at that junction will not allow a good identification o f a person committing a crime thirty-five metres from the junction. The output quality o f outdoor installations is also dependent on environmental factors
such as cloud cover, rain and illumination.
minutes.
Many existing image processing methods, e.g. face recognition, assume that the input image is in some sense ideal, e.g. the subject o f the image occupies the majority o f the frame, or there is only a single well-specified degradation. There is a common perception that the low-level problems associated with video recordings have already been dealt with by existing methods, and that these areas are o f o f lesser importance than higher-level methods such as face recognition. However, attempting to use a face recognition system with a typical CCTV installation in the UK is likely to have limited success, as the face recognition system will require high quality close-up images and, at present, many installations cannot deliver this [2].
To use image enhancement in a judicial context the enhancement that has been carried out must be reproducible. One must be able to show that the enhancements used add nothing to an image, e.g. that one cannot alter a letter on a number plate. It must be possible for someone else to show exactly what has been done to an image and how, by providing an audit trial o f which methods were used to enhance an image, as well as details o f the various algorithm s’ operation.
1.2 Objectives
The author undertook a survey o f the degrading factors most commonly found in video im agery, and this is presented in chapter 2. The results from this survey determined the areas o f investigation for the preprocessing algorithms presented in this thesis.
This thesis aims to provide the Police Scientific Development Branch (PSDB), a branch o f the UK Home Office and part sponsors o f this thesis, with an investigation into image pro cessing algorithms that have the potential to enhance the subjective viewing quality of, possibly evidential, video recordings. This is achieved by comparing and contrasting different existing methods, from several different problem domains, and reapplying them to video enhancement. The most suitable algorithms are used as a restorative ‘black-box’ that forms a link in a linear processing chain. The author has developed new algorithms, and made modifications to existing methods, to fill perceived holes in algorithm design or performance.
The author intends that these preferred processing chains be used to form guidelines for an end-user charged with restoring or enhancing an image. It is hoped that these guidelines will remove much o f the trial-and-error currently necessary when using different methods in succession, and as a consequence increase productivity.
1.3 Thesis structure
The remainder o f this thesis is divided into a further eight chapters. The structure o f these chapters is as follows.
Chapter 2 contains the details o f two surveys designed to highlight the problems associated with CCTV video recordings. Based on the findings o f these surveys, decisions about which types o f image processing algorithms to investigate further are made at the end o f the chapter.
Chapter 3 reviews several pre-existing image processing, that perform: deblurring, de noising, local and global contrast enhancement, and line-to-line jitter removal. The aim o f this chapter is to provide a toolkit o f black-box enhancement techniques for use later in the thesis.
Chapter 4 presents and investigates new algorithms for image enhancement in the fields o f contrast enhancement, line-to-line jitter removal, intra-line warping (related to jitter). The main body o f work in this chapter deals with the subject o f dejittering.
Chapter 5 compares the relative performances o f the algorithms presented in chapters 3 and 4 when applied to real analogue video footage. Decisions on the best algorithms to be used as black boxes in chapter 6 are made.
Chapter 6 uses several image processing algorithms in series and in different permutations to determine if there are any combinations that provide greater image enhancement than any single method. Guidelines on which individual algorithm or combination o f algorithms is best at enhancing certain types o f degraded images are presented.
delivers more specific details o f common degradations affecting video recordings. Finally, the results o f both surveys are grouped into broader categories for further investigation.
2.1
Police Scientific Development Branch survey
The industrial sponsors o f this thesis are the Police Scientific Development Branch (PSDB). One o f the roles o f the PSDB is to advise the nation’s police forces on the enhancement and handling o f CCTV video recordings primarily used in evidential proceedings.
O f primary concern to an end-user in the police is a general decrease in the apparent noise in an image. This may increase the clarity, and comprehensibility, o f the scene and aid the identification o f the target objects [3].
The PSDB has in the past developed its own software video enhancement system [4]. As this software is now at the end o f its working life, the PSDB has assessed third party software that performs a similar, but more advanced role [5]. This thesis aims to provide the PSDB with a study o f novel image enhancement techniques that are o f assistance in enhancing the subjective quality o f operational or evidential video footage.
To better understand the requirements o f the end-user the PSDB carried out a survey [6] in which they asked forty-one police forces for their opinion on a wide range o f topics including: the number and nature o f videotapes received by the force; hardware and software features use; evidential material required from the tape; their use o f commercial specialists and any training issues they had.
This survey asked two questions that are relevant to this work, namely: 1. What COMMON problems do you experience with the quality o f the image? 2. In general, what are you trying to obtain from the video?
more educated installation o f CCTV systems is necessary to reduce these problems. Using the original equipment that made a recording to playback a recording may help with categories (d) and (i). The remaining categories (c), (f), (g) and (h) are common to both this PSDB survey and the new survey in section 2.3.
Problem Often Sometimes
a Poor camera location 33 7
b Region o f interest too small 31 9
c Poor lighting 26 15
d Poor tape / VCR 21 17
e Wrong time and date stamp 16 21
f Out o f focus 16 24
g Noisy image 14 24
h Blurred 14 25
i Unstable image 10 27
Table 2.1: Ranked responses, most common first, to the question ‘What COMMON problems do you experience with the quality of the image?’. From the PSDB survey [6].
The responses to question (2), ranked in descending order, may be found in table 2.2, and are shown for interest only, as this factor does not necessarily affect how image enhancement is performed.
Region of interest Often Sometimes
a Face 34 5
b Num ber Plate 26 12
c Track movement 19 17
d Object / shape 5 25
e Word / symbol 3 32
f Colour information 1 24
g Size 0 20
Table 2.2: Regions of interest in CCTV footage. Ranked responses, in descending order, to the question ‘In general, what are you trying to obtain from the video?’. From the PSDB survey [6].
2.2
Degradation effects in magnetic tape recordings
Many factors may contribute to inferior quality o f video recording. The PSDB survey high lighted lighting, focus, noise and blur. Sections 2.2.1 and 2.2.2 discuss degradations associated with the recording process, and section 2.2.3 deals with how interpretation o f recordings can be affected by the choice o f equipment used to make the recording.
2.2.1 Tape re-use
ifest themselves as scratched lines, missing patches o f picture or a loss o f tracking, to name but a few. In some cases, the only way to reduce these effects is to use the equipment that originally made the recording to playback the footage.
2.2.2 Other media effects
Frame/line dropout and synchronisation loss: A video signal carries synchronisation signals so that the playback device can accurately locate individual lines and frames, as well as their relative spacings. Any degradation o f the video signal can therefore affect the ability o f the playback device to accurately maintain a lock on the lines and frames. This can lead to random horizontal displacement o f displayed lines, known as jitter. It can also lead to a whole frame rolling vertically. In severe circumstances individual lines or fields can fail to appear at all. To a certain extent the loss o f synchronisation pulses can be corrected by the use o f a piece of equipment known as a time base corrector (TBC), see chapter 3, which processes the analogue video signal and attempts to reduce the noise in the non-picture part o f the signal, thus helping to recover the timing pulses.
2.2.3 Tape usage
Time-lapse: Time-lapse recording can be used to significantly increase the period o f time that can be recorded on a video tape. A standard UK VCR will record 25 frames-per-second (FPS) and a typical tape length is o f the order o f three hours. By recording only 5 FPS the effective length of the recording tape may be extended to 15 hours. While the recordings may still hold a significant amount o f information for the human observer, machine vision algorithms that rely on minimal changes between successive frames may have difficulty coping with the larger discontinuities present in this type o f footage. It is for this reason that the work in this thesis concentrates solely on single frame techniques.
2.3
Video imagery degradation survey
To ascertain specifically how often and severely the degrading effects from section 2.2 occur in CCTV footage, over a hundred randomly selected frames from a selection o f CCTV videotape recordings were visually assessed by the author.
In total, 133 frames were assessed, representative o f over 30 hours o f CCTV footage. The tapes were from various sources including high street shopping centres, surveillence video footage and outdoor car parks, amongst others. Approximately six hours o f this CCTV footage was in colour.
Several o f the tapes were compilations that contained portions o f scenes from several sources. This means that it is difficult to ascertain the exact length o f footage that is repre sented here, but it allowed a greater range of recording sources to be included in the survey.
The tapes used in this survey came from two sources, the PSDB, and Kalagate Imaging Bureau. It should be pointed out that many, but not all, o f the tapes were given to the PSDB because they were o f low quality. However, this did not present too significant a problem, as it is the faults with recordings that we were concerned with. This skewing o f the sample set will only serve to highlight the problems present in recordings.
The structure o f this section is as follows. In section 2.3.2 the categories assessed are described in greater detail, with brief descriptions o f how each category is split into the smaller subdivisions. The survey results are in section 2.3.3. A summary o f the results are presented in a sorted, stacked histogram. An overview o f the survey results that considers the top categories, and the choice o f degradations that are treated in greater depth in this thesis can be found in section 2.4.
In order to illustrate how some o f the degradations m anifest themselves in real footage, section 2.5 contains some representative images.
2.3.1 Degradation categories
Twenty-one problems common to video recordings were looked for in each frame. This section details the individual categories assessed and the m ethod o f assessment. The results o f the analysis are considered in section 2.3.3.
Each category in table 2.3 was assessed to determine to what extent each degradation had affected the image as a whole. These degradations were subdivided to allow the ranking o f the category in terms o f severity. The categories were named in ascending order o f severity as:
Not present (NP) Present (P) Strong presence (SP) The general guidelines for selecting one o f the three subdivisions are:
N ot presen t For an artefact or degradation to be classified as not present, the severity o f the artefact must be comparable to the level that is found in high-quality video recordings.
11 Camera motion blur
12 Blurred image (e.g. dirty lens, nth generation copy)
13 Out o f focus camera
14 M edia faults / artefacts (e.g. scratches / snow)
15 Ghosting
16 Ringing
17 Local motion in the frame
18 Print-through
19 Pixel bum in
20 Colour problems
21 Extreme lighting (e.g. saturation, total black)
Table 2.3: CCTV imaging degradation categories
S trong presence To lie in this category the degradation m ust be so severe in the regions in which it occurs that it dictates the dominant structure o f the image. It is currently believed that nothing can be done about such artefacts.
2.3.2 Individual category descriptions
Overall image deterioration
This category is a subjective measure o f the overall perceived quality o f the image. An image may contain several different defects, all o f which, in isolation, are on the borderline between the not present and present categories. However, the cumulative effect o f these lesser defects can mean that the overall quality o f the image suffers. It may also show that there is not one single overriding degradation but in fact several, resulting in a severe loss o f image quality.
• Not present - The image is comparable to, or not significantly worse in appearance, than a well-recorded video image.
• Present - The presence o f some artefacts is apparent in the image and is o f a level that noticeably degrades the quality o f the image.
Illumination variation
This is a measure o f the variation in illumination across an image.
• Not present - The image is one that is, in general, uniform ly illuminated.
• Present - The lighting in the image is considered non-uniform, i.e. there are regions o f light and dark in the scene.
• Strong presence - To be categorised as strong presence, the scene must have regions that are strongly illuminated and others that are poorly illuminated.
Poor lighting
There need not be variation in the illumination o f the image for it to fall into this category. It could be that the whole o f the image is in near-darkness or the whole image is over-illuminated. It is essentially a measure o f how well the scene is lit.
• Not present - The scene is well illuminated.
• Present - The scene is in the main adequately illuminated. There may be regions o f light or dark, or the image as a whole may be darker or lighter than is desirable.
• Strong presence - The scene is either too dark or too light, or there are regions o f strong or no lighting.
Low contrast
Lack o f contrast in the image may be caused by factors such as lighting, media noise and also by weather effects such as mist.
• Not present - The contrast in the image is o f an acceptable level, equivalent to that o f a good video image.
• Present - Either the whole image or large regions o f it are suffering from a loss o f contrast. There is an associated loss o f detail in the image as a result o f the level o f contrast. • Strong presence - The contrast in the image is so bad that it is difficult to make out details
o f objects in the scene. It is thought that enhancing the contrast in the image would merely amplify the noise, rather than increasing the chances o f a meaningful interpretation o f the image.
Media signal-to-noise ratio
demultiplex a recording and introduce a systematic fault, e.g. distortion at the top o f the frame, to an otherwise good recording.
• Not present - No distortion apparent in scene. • Present - Some distortion present in the scene.
• Strong presence - Overriding distortion present in the scene.
Jitter in playback equipment
This category refers to the line-to-line jitter that is present to some degree in all video images, as well as frame synchronisation problems.
This category also covers flywheel jitter, where the lock on several lines is lost and the time taken to recover from this error causes subsequent lines in the image to be tom by successively smaller amounts.
• Not present - The jitter in the image is consistent with that o f a normal video image (< 1 pixel).
• Present - The jitter in the image is greater than w ould be expected in a normal video image and has a detrimental effect on the quality o f the image. It is believed that the jitter at this level may in some cases be removed by use o f an appropriate de-jittering algorithm (~l-3 pixels).
• Strong presence - The jitter present in the image is so severe that there appears to be little or no local correlation between adjacent lines in the image. This has a severe effect on the ability to interpret the image. Attempts at restoration o f an image degraded to this extent are unlikely to succeed (> 4 pixels).
Signal dropout
This refers to a line, or lines, in the image being replaced with random values or being com pletely black. This can affect parts, or all, o f a whole scanline.
• Not present - There is no signal dropout in the image.
• Strong presence - The dropout is so severe that whole regions o f the image are completely unintelligible.
Other recording anomalies
This category includes tracking problems, stripes on the image, one field o f a irame recording correctly but the associated field recording badly, etc.
• Not present - There are no anomalies with the recording.
• Present - There are some anomalies present in the image, but the overall structure o f the image is apparent.
• Strong presence - There is severe degradation o f the video due to problems with the recording. Many details in the image as a result.
Field interlace tearing
Rather than recording a complete frame at once, many cameras record a frame in two fields, i.e. all the odd lines and then all the even lines. There is a small time difference between the recording o f the two fields. This means that if there is movement o f the camera relative to the scene, or there is motion in the scene itself, there will be a displacement between the position o f objects in one field and the next. This leads to tearing o f the fields, causing object boundaries to appear jagged. To enable a user to record from two cameras simultaneously some multiplexers allow the output o f the first camera to be recorded on one field o f the frame and the output from the second camera to be recorded on the other field. This reduces the resolution o f the two recorded images but means there can be no field-to-field interlace tearing.
• Not present - There is no interlace tearing in the scene.
• Present - There is some tearing in the scene, either local or global. The level o f tearing is o f the order o f a couple o f pixels.
• Strong presence - The tearing in the scene is substantially greater than a few pixels.
Camera motion blur
This category covers motion blurring caused by the motion o f the camera relative to the scene. • Not present - There is no motion blur.
• Present - There is some motion blurring o f the scene.
• Strong presence - There is severe m otion blurring o f the scene.
Blurred image
An image may be blurred for several reasons, e.g. dirt on the lens. Smoothing o f the image may occur as a result o f the recording being an n ’th generation copy.
• Not present - There is no appreciable blurring o f the image.
• Present - There is some blurring o f the image affecting the fine detail in the scene. • Strong presence - There is strong blurring o f the scene, effectively smearing out all of the
Media faults / artefacts
This includes artefacts such as snow, scratches and lines across the image.
• Not present - There are no artefacts in the scene over and above what would be expected from an ordinary recording.
• Present - The presence o f artefacts in the image has had a detrimental effect on the sub jective quality o f the image. However the general scene content is still apparent.
• Strong presence - There is severe scene degradation.
Ghosting
Using long lengths o f cable between camera and recorder can cause ghosting. • Not present - There is no ghosting in the scene.
• Present - There is slight ghosting in the scene, causing a noticable degradation in image quality.
• Strong presence - There is pronounced ghosting in the scene with multiple images seen in the image.
Ringing
Ringing occurs as a consequence o f the limited bandwidth in the electronics o f the recording mechanism, and is particularly noticeable at sharp changes in greylevel. It typically manifests itself as light halos around dark objects and dark halos around light objects. There is some ringing present in all images recorded on an analogue VCR, but the severity can vary from one recording to another.
• Not present - The ringing in the image is consistent with that o f ordinary video recordings. • Present - The ringing around objects is more noticeable than normal.
Local motion in the frame
• N ot present - There is no local motion in the frame.
• Present - There is some local motion in the scene but it is either small in magnitude or localised.
• Strong presence - There are either lots o f objects moving independently or a few objects moving quickly.
P rin t-th ro u g h
Print-through is caused by VCR erase head malfunction and also by over-recording o f video tapes. It manifests itself as the original recording being seen over the top o f the new recording and therefore confusing the scene.
• Not present - There is no print-through.
• Present - There is some light print-through, but the new recording is significantly greater in magnitude, which in turn makes the effect less pronounced.
• Strong presence - There is strong print-through in the scene and the m agnitudes o f the original and new recordings are comparable.
P ix el b u m -in
A camera that predominantly stares at the same scene all the time can suffer problems with pixel bum-in, where the elements o f the cameras sensor become either more or less sensitive depending on what they normally look at. This can be a problem if something moves across the scene in front o f the problem pixels as the object will not be faithfully reproduced.
• Not present - There is no bum -in in the scene.
• Present - There is some bum-in in the scene but it is not that severe.
• Strong presence - There is strong bum -in that is severely affecting the image quality. C o lo u r p ro b lem s
Although all o f the processing in subsequent chapters has been carried out on monochrome images, much o f the footage is from colour cameras. These colour stills have been transformed into greyscale prior to their use. Problems with the reproduction o f colour in the original scene will therefore have an effect on the subsequent ability to process these images as greyscale. Colour problems may include bleeding, where colours extend beyond their boundaries; and colour changes, where colours randomly change in-between frames for no apparent reason.
• Not present - There are no colour problems or the image is monochrome.
• Present - There are some colour problems in the image, but that are not too severe. • Strong presence - There are problems with colour that are seriously affecting the image,
• Present - There is some saturation in the image or extreme darkness, but it does not affect the majority o f the image.
• Strong presence - There is heavy saturation or extreme darkness in the image, affecting the contrast in all non-affected regions.
2.3.3 Survey results
Table 2.4 shows the cumulative score for each category for all o f the tapes used in the survey. Figure 2.1 represents the same data in the form o f a stacked histogram, where the categories are sorted into descending order on the present category.
D egradation NA P SP Degradation NA P SP
A Blurred image 49 49 2 L Other recording anomalies 79 17 4
B Jitter in playback equipment 55 44 1 M Camera motion blur 92 7 1
C Local motion in the frame 61 39 0 N Signal dropout 93 5 2
D Overall image deterioration 58 35 7 O M ultiplexer degradation 94 5 1
E Illumination variation 62 32 6 P Out-of-focus camera 95 5 0
F Low contrast 6 8 31 1
Q
Field interlace tearing 98 2 0G Extreme lighting 63 30 7 R Ringing 98 2 0
H M edia faults / artefacts 6 8 29 3 S Ghosting 1 0 0 0 0
I Media signal to noise ratio 69 28 3 T Print through 1 0 0 0 0
J Colour problems 71 23 6 U Pixel bum in 1 0 0 0 0
K Poor lighting 74 23 3
Table 2.4: Survey summary. Degradation category list. NA = not apparent, P = present, and SP = strong presence. All figures are percentages. Sorted on the present category.
Colour images
The colour images in this survey were treated in exactly the same manner as their black and white counterparts. Only a small proportion o f the videotapes surveyed were black and white, and to truly get an accurate picture o f how often problems with colour occur it would be neces sary to normalise the colour data in some way. Due to the complexities o f working with colour, all images used later in this thesis were converted to black and white prior to processing. This meant that it was unnecessary to normalise the colour data.
□ Not apparent H Present □ Strong presence 100% 90% 80% 70% 60% 50% 40% 30% 20% 10% 0%
A B C D E F G H I J K L M N O P Q R S Degradation category
T U
Figure 2.1: Survey summary. D egradations and their frequency o f occu rence. Sorted on the p r e s e n t category.
recordings arc used as a source of black and white images then these problems may still have a bearing on the ability to perform subsequent corrections for other, non-colour related, problems, as the greyscale version of the image will still be affected by the colour imperfections.
2.4 Choice of degradations for further analysis
There are areas where the two surveys presented in this chapter overlap. The PSDB survey gives the most likely sources of degradation, in descending order, to be; poor lighting; out of focus; noisy image; and blurred image. Ignoring Overall image deterioration, as it is a non-specific degradation, these categories are ranked in the second survey in first, eighth, tenth and eleventh place.
The problem areas highlighted above, and the results from section 2.3.3 may be grouped into broader categories based on the type o f algorithm that is subsequently used to reduce their apparent effect on an image.
1. Deblurring
(a) Blurred image
(b) Local motion in the frame 2. Dejittering
(a) Jittered image
the remainder of this thesis. Prior work in these fields is discussed and assessed in chapter 3. Chapter 6 looks into the inter-operability of the algorithms used to help compensate for the above problems. For example, if an image is blurred and jittery, this chapter examines whether it is best to first deblur the image and then dejitter or vice versa.
2.5 Representative images
To afford the reader a greater understanding of the image types dealt with in these surveys, a selection of typical degraded frames are shown below.
w
Figure 2.2: T his is a particularly bad im age that sh o w s a range o f problem s that can occu r in C C TV
recordings. The m ost significant degradation source w as a problem with the recording m ech anism that
meant that w h ile one field o f the im age w as recorded w ell, the other field w as severely corrupted. R e m oving the corrupted field can lead to a significan t im provem ent in the quality o f the scen e. A lso present
in the scen e are lin e-to-lin e jitter and signal dropout. T h ese are particularly noticeab le alon g the left hand
ed ge o f the im age. Other problem s with the im age are that it is generally n o isy and there is a region o f
m
Figure 2.3: This sh o w s som e o f the problem s that can occur w ith colou r recordings. There are problem s
with colours bleed in g into their surroundings: this is m ost noticeab le around the y e llo w sh elv in g at the
centre o f the scen e. A lso the coat o f the person at the counter appears vivid ly as both red and green. The
true colour o f the coat is red but regions o f it appear green in several o f the frames in this sequ en ce.
Figure 2.4: T his frame sh ow s the problem o f m assive saturation in a scen e. T he bright sou rce o f illu m ination in the centre o f the scen e w h ites out the rest o f the im age, preventing any other details o f the
Figure 2.5: This im age sh ow s global interlace tearing due to the rapid panning o f the recording camera.
T his can be seen m ost clearly in the low er portion o f the im age, w here there are apparently tw o bins and the telegraph pole has a com bed edge.
Figure 2.6: T his im age sh ow s how ringing m ay affect an im age. T he people in the fore and background
o f the im age all have a w h ite halo around their ed g es due to ringing effects. T he scen e also suffers from
so m e dropout, and on the right hand side o f the im age there is som e loca lised interlace tearing as the
J
Figure 2.7: This frame sh o w s m any problem s with a garage forecourt im age. There is signal dropout on
been taken: the algorithms chosen for discussion are those that are relevant to the corresponding problem and which appear to be in more or less widespread use. It should be emphasised that this chapter does not attempt to make inter-algorithm comparisons: its aim is solely to survey algorithms, and to choose one or two for illustrative purposes for each type o f problem.
In chapter 2 the degrading factors were grouped into the following four algorithmic groups: deblurring, noise reduction, contrast enhancement and dejittering.
This structure o f this chapter follows this grouping. Section 3.2 deals with image scanline sharpening, or peaking filters, a method that aims to replace the high-frequency information typically attenuated in the electronics o f a VCR. The general sharpening o f images is discussed in section 3.3. The blur dealt with here is similar in nature to that associated with scanline sharpening, although its origin in CCTV recordings comes from making multiple copies o f an recording. Out-of-focus deblurring is not dealt with in this thesis. Local motion deblurring is discussed in section 3.4, but for reasons discussed in that section these methods are not imple mented. Image noise reduction, encompassing methods for dealing with scratched videotapes, noise due to media faults, m edia signal-to-noise problems, and signal dropout restoration, are discussed in section 3.6. Finally, in section 3.8 discusses existing methods for image inter-line dejittering.
to at the appropriate points in this chapter.
3.1.1 Exclusion o f temporal methods
Many o f the recordings used in the survey in section 2.2 were made on time-lapsed equipment meaning that for a non-static scene there may be a significant change in image content between adjacent frames. There are algorithms for image restoration that work by combining informa tion fi-om several, typically adjacent, frames. This was frequently the case in the CCTV footage seen by the author, and methods that require temporal information are therefore not considered in this survey.
3.1.2 Image data sets
This thesis contains images o f several different types:
1. ‘Representative’ images, such as those shown in chapter 2, that were chosen to illustrate particular image defect types, e.g. interlace tearing. With one exception (the shop in terior), these images were not suitable for comparing different algorithms, because the individual defects prevented any useful processing.
2. Synthetic images, such as ‘Lena’, to which individual types o f defects could be added artificially for algorithm assessment.
3. Eight images, from CCTV or video footage, that were used for testing the effectiveness o f the combinatorial process described in chapter 6. These images are shown in appendix A. 4. An additional half a dozen CCTV images, used predominantly in chapter 5 to provide
further examples o f extreme defect conditions that are not amenable to satisfactory pre processing.
3.2 Scanline sharpening
Video recordings are stored and replayed as scanlines on magnetic tapes. The bandpass char acteristics o f the equipment typically used in replaying a recording mean that on playback the individual scanlines can be subject to low-pass filtering along their length. The aim o f peaking filters is to enhance information that is degraded due to low-pass filtering. Although the infor mation from outside the bandwidth is often no longer available, it is still possible to subjectively improve the image quality.
One possible way to accomplish this is to perform edge-enhancement on the scanlines in order to sharpen transitions in the image. This can be implemented using a one dimensional unsharp mask (section 3.7.3.1) or by using a Wiener filter [8]. To use the W iener filter one requires knowledge o f the low-pass filter that has smoothed the video signal. Used in one- dimension, the Davies truncated-median filter, described in section 3.6.3, can also be used for edge sharpening as well as noise smoothing.
It should be noted that sharpening edges can lead to jitter artefacts (a combed boundary) appearing on objects in the image if the centre o f the transition moves.
Figure 3.1: Sinusoidal gain function used in peaking filter.
Example output images for the Ohara peaking filter and the one dimensional Davies trun cated median filter [12] (see section 3.6.3) are shown in figure 3.2. The Ohara filter can be seen to add significant ringing to the resulting image, actually degrading the image appearance. The 3-tap Davies filter, figure 3.2(c), shows a slightly sharpened image at the expense o f some fine detail. However, the 5-tap Davies filter, figure 3.2(d), shows a tendency to segment the image and smooth texture rather than sharpening the image.
Neither of these filters are suitable for sharpening o f image scanlines. Further methods for increasing local contrast in images, all two-dimensional, are discussed in section 3.7.3
3.3 General image deblurring
The general blurring in a CCTV image is, in the majority o f cases looked at in the survey in chapter 2, a result o f overusing tapes when recording and can also be attributed to n-th generation copies o f recordings (in order to preserve the original, police forces generally only work with copies o f recordings).
Deblurring is an area that has been extensively examined in the literature. There are tech niques that can offer modest improvements in image sharpness. However, these often require an exact prior knowledge o f the function that has blurred the image. In the realm o f video record ings this knowledge is extremely difficult to ascertain in all but the most trivial o f examples.
Deblurring is a difficult area o f image processing as it involves the manipulation o f image information that contains both the noise and the content that one wishes to enhance.
In most inverse filtering situations the point-spread-function (PSF) is assumed to be known explicitly prior to deconvolution. Methods for this situation can be found in standard image processing texts [8, 13,14] and include: inverse filtering - Wiener filtering and Least-squares filtering; Recursive Kalman filtering; and Constrained iterative deconvolution methods.
(a) Original Lena image. (b) Ohara peaking filter.
(c) Davies truncated median filter. One dimen sional, 3-tap peaking filter.
(d) Davies truncated median filter. One dimen sional, 5-tap peaking filter.
1. Identification o f the PSF separately from the true image.
2. Incorporating identification and restoration into the same process.
Approach (1) leads to computationally light algorithms, while approach (2) leads to computa tionally more complex models. Both o f these approaches are discussed in detail in [16,17]. Close examination o f the available methods shows that while there are methods for estimating the PSF that has blurred an image prior to restoration, they are often not suitable for CCTV recordings. Many o f these algorithms were developed for astronomical purposes, where sim plifying assumptions about the image may be made, e.g. the image is wholly contained in the frame and is shown on a uniform background, or that the noise in the image can be accurately described using a particular statistical distribution.
3.3.1 Carasso deblurring
One method that appears to offer useful deblurring o f CCTV recordings is the Carasso method [18], which allows the blurring PSF to be estimated interactively from the blurred im age itself. This allows a sharpened image to be obtained quickly through trial and error, rather than having to wait for a blind iterative method to converge on a possibly poor solution. Carasso refers to this procedure as the APEX method to differentiate it from another related method that he describes.
Carasso assumes that the blur is o f a specific type, so that its effect on the Fourier transform o f the image is known. The interactive algorithm allows experimentation with the deblurring process so that a satisfactory result can be found in a relatively short amount o f time. This is obviously preferable to having to wait, possibly hours, for an iterative solution to converge to what may not be the desired output.
Image deblurring can be described by the following two-dimensional convolution process:
H f = h{x - u , y - v ) f { u , v ) d u d v = h { x , y ) f { x , y ) = g { x , y ) Jr^
![Figure 3.12; Histogram decomposition using the method described by Jansen et al. [39].](https://thumb-us.123doks.com/thumbv2/123dok_us/8318875.1379744/57.595.187.382.80.296/figure-histogram-decomposition-using-method-described-jansen-et.webp)
![Figure 3.15: Illustration of interpolation in the one dimensional case. Image from [33]](https://thumb-us.123doks.com/thumbv2/123dok_us/8318875.1379744/62.595.187.346.223.436/figure-illustration-interpolation-dimensional-case-image.webp)