Article
Optimal Rescue Ship Locations Using Image
Processing and Clustering
Cho-Young Jung 1 and Sang-Lok Yoo 2,*
1 Department of Marine Science and Production, Kunsan National University, Gunsan, Jeonbuk, 54150, Republic of Korea; [email protected]
2 Wando Vessel Traffic Services, Korea Coast Guard, Wando, Jeonnam, 59126, Republic of Korea;
* Correspondence: [email protected]; Tel.: +82-61-550-2550
Abstract: Currently, maritime traffic is increasing with economic growth in several regions worldwide. However, this growth in maritime traffic has led to increased risk of marine accidents. These accidents have a higher probability of occurring in regions where geographical features, such as islands, are present. Further, the positioning of rescue ships in a particular ocean region with a high level of maritime activity is critical for rescue operations. This paper proposes a method for determining an optimal set of locations for stationing rescue ships in an ocean region with numerous accident sites in the Wando islands of South Korea. The computational challenge in this problem is identified as the positioning of numerous islands of varying sizes located in the region. Thus, the proposed method combines a clustering-based optimization method and an image processing approach that incorporates flood filling to calculate the shortest distance between two points in the ocean that detours around the islands. Experimental results indicate that the proposed method reduces the distance from rescue ships and each accident site by 5.0 km compared to the original rescue ship locations. Thus, rescue time is reduced.
Keywords: clustering-based optimization; location optimization; flood-filling algorithm; marine accident; rescue ship; shortest distance
1. Introduction
Approximately 90% of the world’s trade is conducted by sea, and the volume of cargo and the number of ships entering and leaving ports continue to increase with economic growth [1]. Concomitant with this growth in maritime traffic is increased risk of marine accidents [2]. The occurrence of marine accidents is higher in regions closer to shore, primarily because of the increased ocean traffic and the resulting collisions. This is also affected by geographical features such as islands. Studies have shown that human error continues to be the dominant factor in maritime accidents [3]. In most accident cases, it is possible to save lives and cargo through appropriately managed rescue operations. Search and rescue operations are of vital importance to address this situation and for the safety of passengers and cargo.
The success of a rescue operation primarily depends on the time required for a rescue ship to reach an accident site. Thus, the positioning of rescue ships in a particular region of the ocean with a high level of maritime activity and reported cases of marine accidents is critical for rescue operations. The selection of a particular location for the placement of a rescue ship depends on two main factors. First, the suitability of the location for a rescue operation should be analyzed considering regional geography and the availability of resources. Secondly, there must be a scientific measure of the effectiveness of locating a rescue ship. However, until now, only a small number of scientific studies have focused on the problem of the effective positioning of rescue ships. Further, rescue ship
Nomenclature
K potential candidates for rescue ship locations, 𝐾 × 𝐾 equally spaced locations L current accident location
𝐿𝑜𝑐𝑎𝑡𝑖𝑜𝑛𝑖,𝑙𝑎𝑡 latitude for each accident location (𝑖) and the rescue ship locations
𝐿𝑜𝑐𝑎𝑡𝑖𝑜𝑛𝑖,𝑙𝑜𝑛 longitude for each accident location (𝑖) and the rescue ship locations
m, n row and column for matrix P total number of accident locations
𝑃𝑖𝑥𝑒𝑙 𝑖,𝑙𝑎𝑡 transformed latitude to matrix format
𝑃𝑖𝑥𝑒𝑙 𝑖,𝑙𝑜𝑛 transformed longitude to matrix format
Q number of effective rescue ship location candidates
QC3 combinations of three out of Q
W factor for decreasing a resolution
positioning is predominantly carried out in a subjective manner without scientific or statistical support. The analysis of present rescue ship locations shows that they are in fact situated far away from the clusters of accident sites, i.e., locations with historically recorded incidents. However, as the distance from an accident site affects the effectiveness of rescue operations, it is important to assess this factor statistically and scientifically.
Numerous studies have focused on the general subject of rescue operation optimization, but only a few studies have focused on the optimization of operations based on the location of rescue ships. Astbury [4] researched the search area determination and search unit deployment. This is a meaningful study in terms of spatial deployment of search and rescue forces after an accident. However, it is not a study of where to ordinarily deploy rescue ships at sea for emergency situations. Trim [5] developed for improv-ing the radar visibility of search and resuce transponder responses, and Díaz et al. [6] proposed very high frequency radio direction finder or infrared detectors are essential on rescue ships. These are studies of equipment for efficient search. Azofra et al. [7] discussed the problem with a view of sharing resources for rescue with regional and national governments in places of possible conflicts of interest. Afshartous et al. [8] investigated the uncertainty of the accuracy of distress call detection in addition to resource allocation. Stone et al. [9] proposed a method of optimization in rescue operations that optimally predicts accident sites based on distress calls. However, they focused on modeling and simulation based approaches and di dnot explicitly deal with the positioning of rescue ships, which is a major factor. Zarandi et al. [10] considered the problem as a large-scale maximal covering location problem and viewed locations as nodes characterized by a set of attributes in a multiconnected graph. Akbari et al. [11] conducted optimization based on mean access time from rescue ship stations to accident site locations using data from the Atlantic coastline region of Canada. In contrast to the studies cited above, our study primarily focused on the optimization of rescue ship locations based on physical location and the realistic navigable distance between these locations and accident-prone areas.
between two places in the ocean that detours around the islands. In addition, a clustering method was incorporated to assign accident sites to rescue ships.
2. Overview of the study area
2.1 Description of sea location
In this study, we analyzed the marine accidents that have occurred in the numerous islands of Wando County in South Korea during the period from 1997–2016. The study area—Wando County in South Korea—consists of a group of 264 islands. A national marine park is situated in the coastal waters of Wando, Jeollanam Province. This park is an actively cultivated seaweed farm in coastal waters in South Korea. Wando County also accounts for 80% of the abalone production in South Korea [15]. Thus, there are a large number of fishing vessels in this area, with 8,100 ships registered.
The open sea of Wando in the southern sea of Korea is one of the most important shipping areas of the world, connecting major economies such as China, Japan, Russia, and South Korea. An increase in foreign trade in the region has led to an increase in vessel traffic volume, which in turn has led to a commensurate increase in the incidents of marine accidents.
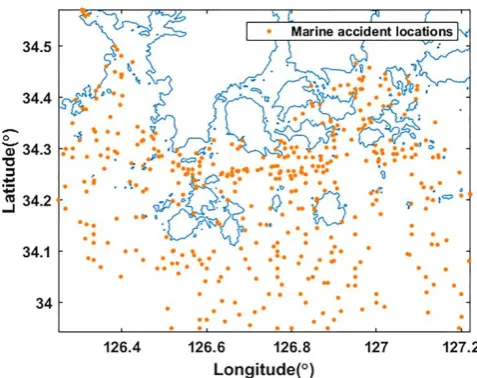
As shown in Figure 1, the study area comprises numerous islands and a complex coastline and covers an area located between latitudes 33.9 N° and 34.6 N° and longitudes 126.2 E° and 127.2 E°. At any one time, three rescue ships of the Wando Coast Guard are stationed in this sea area (shown in Figure 1) specifically for search and rescue.
Figure 1. Study area with actual rescue ship locations (Magenta).
2.2 Distribution of marine accidents
Figure 2. Marine accident locations (1997–2016) (Orange).
3. Proposed method
The proposed method comprises four stages. In the first stage, the rectangular study area is converted to an image with pixel values marked as “0” (black) for land and “1” (white) for water. In the second stage, a set of candidates for rescue ship locations are defined and the shortest distance from each accident location to each rescue ship location candidate is calculated using the flood-filling algorithm. In the third stage, the best combination of rescue ship locations is selected. The fourth stage compares and evaluates the suitability of the optimal locations found in the third stage.
3.1. Stage 1: Converting the study area to image format
The challenge of finding the true optimum location for rescue ships in the study area is that the ships must detour around several islands. As a result, an approach where a large number of islands is neglected and Euclidean distances are used for the optimization of the location of rescue ships would be inaccurate and misleading because ships cannot navigate along those intended paths in reality.
Thus, to mitigate this problem, we represent the study area as an image by vectorizing it into a matrix of dimensions m × n using Equation (1). A large grid size provides more accurate results but increases computation time. Thus, a grid size of 1000 is selected for a suitable balance between accuracy and computation time. With this choice, a pixel in the image matrix corresponds to a distance of 221 m in the original study area, which is acceptable in terms of ship navigation.
Each accident location (i) and the original rescue ship locations are also transformed into the matrix format using Equation (2). The objective is to reduce the size of the matrix to be as small as possible with a view of minimizing computation time. To ensure that this matrix includes all accident locations in the study area, the boundaries of the study area are defined by the maximum and minimum latitudes and longitudes. The transformation in Equation (2) maps the maximum latitude and minimum longitude to the first row and column of the matrix, respectively. The last row and column correspond to the minimum latitude and maximum longitude of the accident locations, respectively. The resulting matrix is the smallest matrix that includes all accident locations.
Pixel i,lat= {max(Latitude) − Locationi,lat} × 1000 + 1
(2)
Pixel i,lon= {Locationi,lon− min(Longitude)} × 1000 + 1 𝑚 = ⌊{𝑚𝑎𝑥(𝐿𝑎𝑡𝑖𝑡𝑢𝑑𝑒) − 𝑚𝑖𝑛(𝐿𝑎𝑡𝑖𝑡𝑢𝑑𝑒)} × 1000⌋
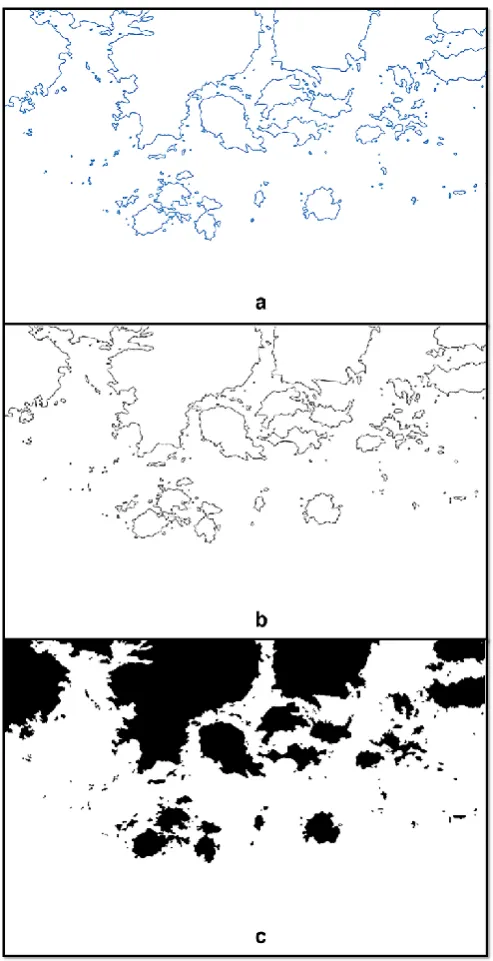
The conversion of the study area to the image format is illustrated in Figure 3. Figure 3(a) shows the obtained RGB image that is converted to grayscale using Equation (3) to enable further processing as an image [17, 18]. The resulting image is shown in Figure 3(b).
𝑔𝑟𝑎𝑦𝑠𝑐𝑎𝑙𝑒 = 0.2989 × 𝑅 + 0.5870 × 𝐺 + 0.1140 × 𝐵 (3)
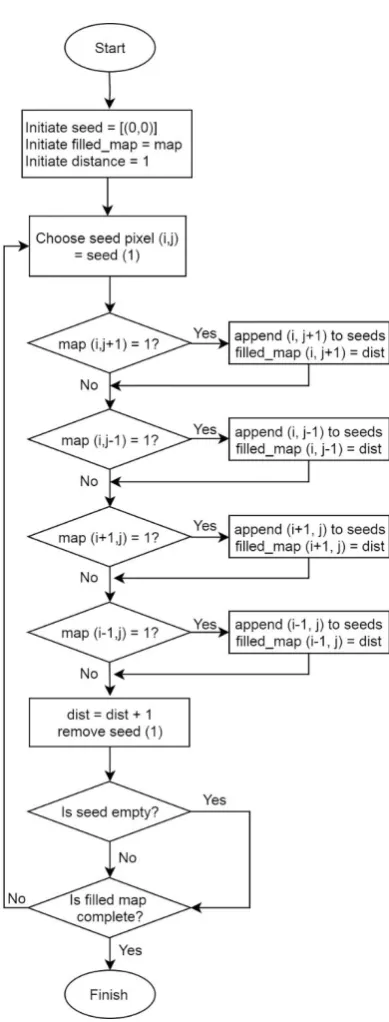
Further, the boundaries of the islands are corrected to ensure that they become closed figures. Then, the flood-filling algorithm (described in Stage 2) is used to identify the land and sea areas and denote them in the matrix as “0” (black) and “1” (white), respectively. The resulting image is a binary image comprising black and white pixels, as shown in Figure 3(c), represented by a matrix of zeros and ones. The image matrix is reduced by a factor of W = 2 to decrease the required computation time. This is done by selecting each alternating pixel so that the new dimension of the image matrix is (m/W) × (n/W). The flowchart in Figure 4 describes this image processing stage.
Figure 4. Flow chart of the image processing stage.
3.2. Stage 2: Flood-filling algorithm
In the proposed method, the flood-filling algorithm (Henrich 1994; Nosal 2008; Clifford et al., 2012) is used to find the shortest path from each candidate (explained in Stage 3) for a rescue ship location to each accident location. The same algorithm is also used to identify the land and sea areas of the map matrix.
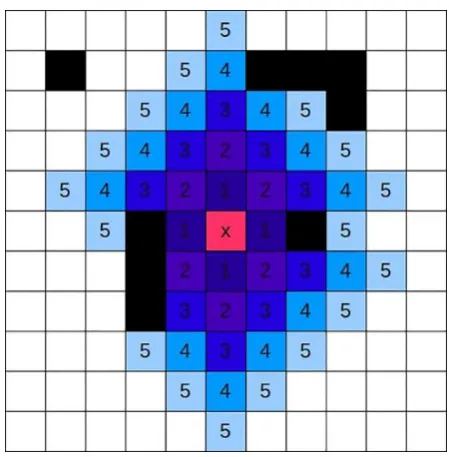
When a starting point (seed) with pixel coordinates (i, j) is selected in the matrix (which is a sea location), each of the four surrounding pixels that can immediately be accessed and that are not land pixels is assigned a value of “1.” Then, each of the pixels that were assigned a value of “1” is selected as the seed in the next iteration. The pixel coordinates are appended to the queue of seeds that must be used as the seed in the next iteration. The pixels immediately adjacent to the pixels that were assigned a value of “1” are assigned a value of “2” in the next iteration. This process is carried out until all sea pixels are assigned a number, as shown in Figure 5.
Figure 5. Example of flood-filling starting from the seed shown in red.
Figure 6. Flow chart of the flood-filling algorithm.
3.3. Stage 3: Optimal location search
Q
C
3 sets of candidate locations, and the cumulative distance for each of the QC
3 sets is calculated. The set that provides the minimum cumulative distance is selected as the best candidate. The flowchart in Figure 8 describes this algorithm.Figure 7. Prelocation of rescue ships (Magenta).
3.4. Stage 4: Evaluation of optimal location
The optimum location found in Stage 3 is validated by comparing it with currently existing rescue ship locations. This is achieved by comparing the cumulative distance between the accident locations assigned to each existing rescue ship location and the optimal locations found in Stage 3. The minimum cumulative distance for the existing rescue ship locations is found using the distances generated in Stage 2. Optimality is evaluated using the difference between these two cumulative distances according to Equation (4).
4. Experimental results and discussion
4.1 Experimental results
The proposed method was evaluated using a scenario involving the positioning of three rescue ships in the Wando islands of South Korea, with a set of 429 accident site locations clustered into three groups. The optimum rescue ship locations and the accident site clusters generated by the proposed method are shown in Figure 9. The ship locations are shown in magenta, and the clusters of accident sites are depicted in red, green, and blue. The figure clearly shows that the allocation of accident sites has been performed while considering the presence of islands in the area.
Figure 9. Study area showing optimized rescue ship locations (magenta) and accident site locations allocated to them (Red, Green and Blue).
As seen in the figure, the selection of the optimum locations of the rescue ships to be stationed using our method results in decreased cumulative distance. We also evaluated the increase in effectiveness for the new placement of rescue ships by calculating the cumulative distance of each accident location from its allocated rescue ship location. The cumulative distance from the existing rescue ship locations was 49569 pixels in the study area image, which corresponds to an actual distance of 10954.7 km. The optimized locations provided a cumulative distance of 39866 pixels, which corresponds to a distance of 8810.4 km. This represents a decrease of 9703 pixels or 2144.4 km, which is a reduction of 19.6% from the original cumulative distance. On average, each accident
location is 5.0 km closer to its allocated accident location compared to the original allocation. Assuming that the speed of a rescue vessel is 15 knots, rescue time is reduced by approximately 10 minutes per accident.
4.2 Discussion
In this paper, we proposed an image processing approach to optimally locate rescue ships and allocate ocean regions where numerous accidents occur to each of these locations. The optimization problem was solved by minimizing the cumulative distance from each allocated rescue ship location to historically reported accident sites.
The distance minimization was implemented using Manhattan distance instead of Euclidean distance. This was primarily because we required the solution to be realistic in that it prevents route calculations over land areas and only includes sea areas. Using the Euclidean distance from accident sites to rescue ship locations was deemed to be unrealistic for this reason. This issue could be solved by combining Manhattan distance and Euclidean distance such that routes include only ocean areas. Even though our approach used only Manhattan distance, this could be achieved by a simple modification of our approach by employing the flood filling-algorithm to diagonally propagate. A distance compensation factor of √2 was required in diagonal movements in comparison with lateral and longitudinal movements.
The optimization was performed using a set K × K of rescue ship locations. This discretization of the problem is an inherent limitation of the proposed computational approach. Therefore, the allocation of extremely few accident locations close to the boundary between regions could be affected by the errors caused by this discretization. This could lead them to be assigned to rescue ship locations slightly farther than the optimum location. However, the approach successfully minimized the cumulative and therefore the average rescue time. We set K = 20 in our study to decrease time complexity while achieving significant improvement. However, with higher K, we can expect that the proposed method will produce even better optimization with reduced possibility of such discretization errors.
The scaling down of the original problem using a factor of W = 2 can affect accuracy because it decreases the resolution of the paths calculated in the map. However, the effect of this is minimal because the size of a pixel in the image corresponds to a smaller distance of 221 m in the original study area.
Further optimization can be performed by successive iterations of this procedure and by selecting candidate rescue ship locations that are closer to and that surround the locations identified in this study.
This study was conducted using historical ship accident site locations. However, the practical requirements of the application of this approach could be more dynamic. Accident site locations could be affected by dynamic factors such as weather and traffic. The locations of rescue ships could also be constrained owing to several factors that were not examined in this approach. These limitations can be addressed by dynamically weighting the distance calculated between locations to include factors other than physical distance that affect the optimality of rescue ship locations. However, the lack of such data limits further analysis.
5. Conclusions
However, the method is limited because it only considers distance in determining optimal rescue ship locations. Therefore, the effects of other factors, such as the availability of resources and the nature of accidents, must be included in future studies for obtaining more accurate results. Furthermore, tidal current and wind direction were not considered. Clearly, as the maritime traffic from these sources can have a significant impact on the access and availability of the rescue ships to be deployed, their effect must be incorporated in future research. Another limitation of this work is related to the fact that we developed the optimization model assuming that rescue ship locations are stationary and ships are readily available for rescue missions when called. However, in real life scenarios, rescue ships could actually be in surrounding regions and not at desired locations. Therefore, the scheduling and timing of these operations must be studied.
The algorithm used to evaluate accident site locations and allocate them to rescue ships may be scalable in terms of in quantity and variety. For example, a larger region of study can be broken down into smaller regions and the algorithm can be successively applied on selected parts to increase accuracy. In addition, a weight factor can be applied to these accident locations to account for other factors in addition to the distance factor before further analysis. In future work, we will focus on sourcing additional data to facilitate the extension of the proposed method.
Author Contributions: All authors have contributed equally to this paper. The individual responsibilities and contribution of all authors can be described as follows: the idea of this whole thesis was put forward by C.Y.; he also completed the preparatory work of the paper; S.L. analyzed the existing work, and wrote the paper.
Funding: Please add: This research received no external funding.
Conflicts of Interest: The authors declare no conflict of interest.
References
1. UNCTAD, 2014. Review of Maritime Transport 2014. United Nations, Geneva, Switzerland.
2. EMSA, 2016. Annual Overview of Marine Casualties and Incidents 2015, European Maritime Safety Agency, Lisboa, Portugal.
3. Baker, C.C.; Seah, A.K. Maritime accidents and human performance: The statistical trail. Proceedings of MARTECH, Singapore, September 22-24, 2004.
4. Astbury, J. Search area determination and search unit deployment. The Journal of Navigation 1987, 40 (1), 63-72.
5. Trim, R.M. A technique for improving the radar visibility of search and rescue transponder responses. The Journal of Navigation 1996, 49 (2), 284-285.
6. Díaz, A.B.; Mora, A.P.; Armas, I.P. Search and rescue location and identification: Experience with SARTs. The Journal of Navigation 2002, 55 (1), 65-74.
7. Azofra, M.; Pérez-Labajos, C.A.; Blanco, B.; Achutegui, J.J.. Optimum placement of sea rescue re-sources. Saf Sci 2007, 45, 941-951.
8. Afshartous, D.; Guan, Y.; Mehrotra, A. US Coast Guard air station location with respect to distress calls: A spatial statistics and optimization based methodology. Eur J Oper Res 2009, 196, 1086-1096. 9. Stone, L.D.; Kratzke, T.M.; Frost, J.R. Search modeling and optimization in USCG’s search and rescue
optimal planning system (SAROPS). Proceedings of Safer Seas Conference, Brest, France, May 10, 2011. 10. Zarandi, M.F.; Davari, S.; Sisakht, S.H. The large scale maximal covering location problem. Sci Iran
2011, 18, 1564-1570.
11. Akbari, A.; Pelot, R.; Eiselt, H.A. A modular capacitated multi-objective model for locating maritime search and rescue vessels. Ann Oper Res 2017, 267, 1-26.
12. Henrich, D. Space-efficient region filling in raster graphics. Vis Comput 1994, 10, 205-215.
13. Nosal, E.M. Flood-fill algorithms used for passive acoustic detection and tracking. Proceedings of New Trends for Environmental Monitoring Using Passive Systems, Hyeres, French Riviera, France, October 14-17, 2008, 1-5.
14. Clifford, R.; Jalsenius, M.; Montanaro, A.; Sach, B. The complexity of flood filling games. Theory Comput Syst 2012, 50, 72-92.
16. KMST, 2016. Accident position information based on electronic chart. Korea Maritime Safety Tribunal, Retrieved from http://data.kmst.go.kr/WebVMS_KMST/WebVMS.jsp.
17. Jackson, J.T.; Gunsch, G.H.; Claypoole, R.L.; Lamont, G.B.. Blind steganography detection using a computational immune system: A work in progress. IJDE 2003, 4, 19.