© 2015 IJEDR | Volume 3, Issue 2 | ISSN: 2321-9939
IJEDR1502204
International Journal of Engineering Development and Research (www.ijedr.org)1238
A Novel Maximum Power Point Tracking Algorithm
for Photovoltaic Application
Harsh Kumar Jain, Monika Vardia PG Student, Assistant Professor Department of Electrical Engineering
Geetanjali Institute of Technical Studies, Udaipur, India
Abstract - The Photovoltaic (PV) energy is one of the best renewable energies and researchers are working in this field to improve the efficiency, speed and accuracy of PV array. Since the conversion efficiency of PV array is very low, it needs maximum power point tracking (MPPT) control techniques to extract the maximum power from PV arrays. A novel method i.e. asymmetrical step size (ASS) method of maximum power point tracking (MPPT) for photovoltaic generation is proposed in this paper in which present and past slope of power (P) with respect to voltage (V) are compared and based on this step size of the voltage is changed. The main advantage of proposed method is fast tracking of maximum power point of PV array. Also it works successfully in dynamic as well as steady state condition and track maximum power point when irradiation level changes.
Keywords – Asymmetrical Step Size, Maximum Power Point Tracking, Photovoltaic System
I. INTRODUCTION
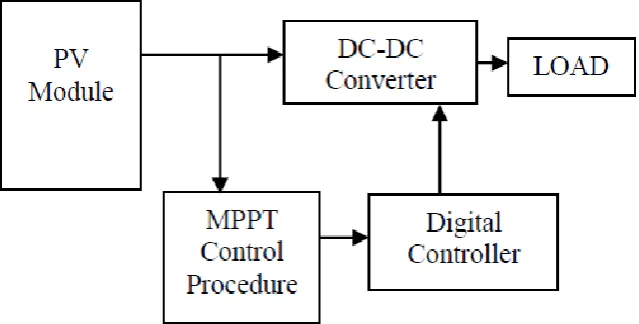
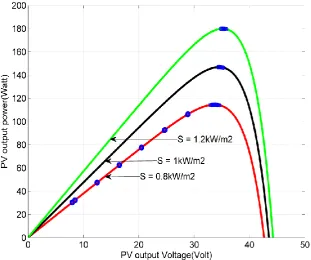
Effective renewable energy sources are those sources in which energy supplies that are refilled by natural processes as fast as we use them. All renewable energy comes, ultimately, from the sun. Solar energy comes directly from the sun and is used to produce electricity, heat, and light. However, there are two main disadvantages of photovoltaic (PV) system, the high installation cost and the low conversion efficiency of PV modules which is only in the range of 9-17% [1]. The basic block diagram of solar system is shown in Fig. 1. Besides that, PV characteristics are nonlinear and it is very much weather dependent. Fig. 2 and Fig. 3 show the I-V and P-V characteristics of a typical PV module for a series of solar irradiance levels with constant temperature [2]. It can be noticed that PV output voltage greatly governed by temperature while PV output current has approximate linear relationship with solar irradiances. It can be seen from the P-V characteristic curve that there is only one peak operating point which is named as the maximum power point (MPP). Due to the high capital cost of PV array, maximum power point tracking (MPPT) control techniques are essential in order to extract the maximum available power from PV array in order to maximize the efficiency of PV array. Therefore, a DC-DC converter is inserted between PV generator and load or battery storage. MPPT algorithms are used to control the switching of DC-DC converter by applying pulse-width modulation (PWM) technique [2].
IJEDR1502204
International Journal of Engineering Development and Research (www.ijedr.org)1239
Fig. 2. Current-Voltage characteristic curves of PV array with change in irradiation level at constant temperatureFig. 3. Power-Voltage characteristic curves of PV array with change in irradiation level at constant temperature
II. MODEL OF PV ARRAY
© 2015 IJEDR | Volume 3, Issue 2 | ISSN: 2321-9939
IJEDR1502204
International Journal of Engineering Development and Research (www.ijedr.org)1240
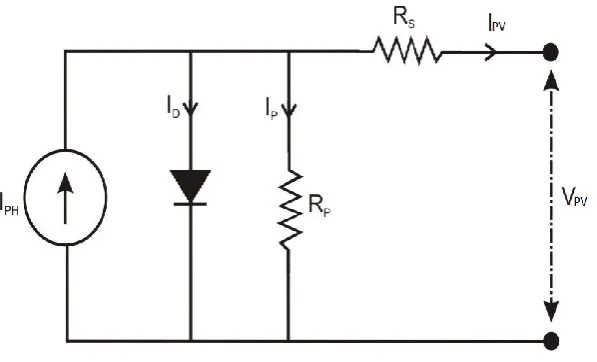
Fig. 4. Equivalent circuit of solar cellWhere IPV is the PV array output current, VPV is the PV array output voltage, IPH is the generated photo current under a given solar irradiation, ID is the P-N junction dark current of the cell unit, q is the charge of an electron (1.6×10⁻¹⁹ C), n is the P-N junction curve constant, when PV cell output high voltage, n=1, otherwise n=2, K is the Boltzmann’s constant (1.38×10⁻²³ J/K), T is the cell absolute temperature (K), RS and RP are the intrinsic resistances associated with the silicon PV array, RS is the equivalent series resistance of the PV array, and RP is the equivalent shunt resistance of the PV array. The value of RP is thousands of ohms.
According to Fig. 4, when shunt resistance is neglected in the equivalent circuit, the relation of the output current of PV array can be expressed as the following equations [3]:
(1)
(2)
(3)
(4)
(5) Where Ios is the diode reverse saturation current which depends on temperature, not solar radiation. Ior is the diode reverse saturation current at reference temperature Tr (298K), Iscr is the normal short circuit current of the cell under the temperature of 298K and the irradiation (S) of 1kW/m2, Eg is the band gap energy of the cell semiconductor.
III. ASS MPPT METHOD
The MPPT performance of a conventional MPPT method is depend on the step size of voltage. The large step size is improved the tracking speed, but the accuracy of tracking is decreased. The small step size is improved the tracking accuracy, but the tracking speed is slowed [4]. Fig. 5 shows the P-V characteristic curves (P1 & P2) and | |-V characteristic curves with change in irradiation condition.
IJEDR1502204
International Journal of Engineering Development and Research (www.ijedr.org)1241
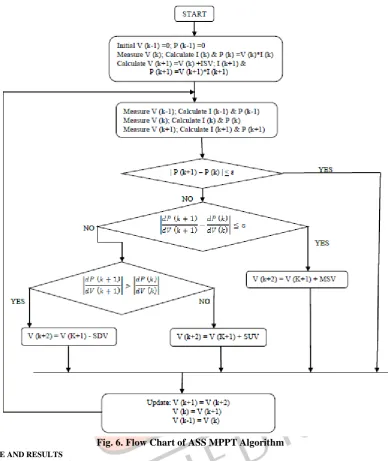
Fig. 5. Slope of power versus voltage under different irradiation conditionsThe ASS MPPT method proposed in this paper uses a maximum step size when operating point of the photovoltaic system is far from the MPP i.e. when present and past slope of power is equal whereas minimum step size is used when an operating point is near to the MPP i.e. present and past slope of power is not equal. MPP is reached when change in present power and past power is zero.
Present slope of power with respect to voltage is defined as:
Past slope of power with respect to voltage is defined as:
© 2015 IJEDR | Volume 3, Issue 2 | ISSN: 2321-9939
IJEDR1502204
International Journal of Engineering Development and Research (www.ijedr.org)1242
Fig. 6. Flow Chart of ASS MPPT AlgorithmIV. PERFORMANCE AND RESULTS
The BPSX150[5] PV module of BP Solar Power Company (Madrid, Spain) is chosen for modeling, which is made up of 72 series-connected multicrystalline silicon photovoltaic cells and the electrical characteristics at standard test condition (STC) of irradiance (1kW/m2) and module temperature (250C) are shown in Table I.
Table I Parameters of bpsx150 solar module
Parameter Value
Maximum Power (Pmax) 150W
Voltage at Pmax (Vmp) 34.5V
Current at Pmax (Imp) 4.35A
Warranted minimum (Pmax) 140W
Short circuit current (Isc) 4.75A Open circuit voltage (Voc) 43.5V
Maximum system voltage 600V
Temperature coefficient of Isc (0.065±0.015)%/0C Temperature coefficient of Voc -(160±20)mV/0C Temperature coefficient of power -(0.5±0.05)%/0C
NOCT 47±20C
IJEDR1502204
International Journal of Engineering Development and Research (www.ijedr.org)1243
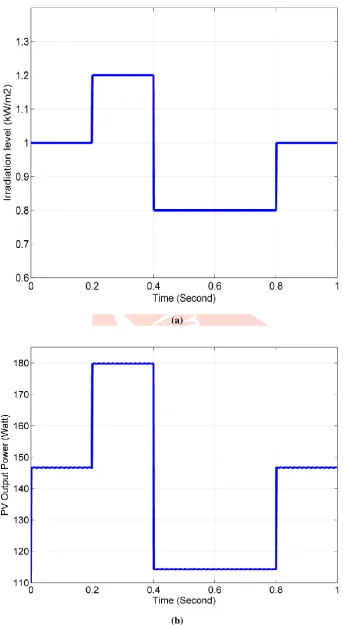
Fig. 7. P-V characerstic curves with tracking of maximum power and change in irradiation levelTable II Maximum power obtained with change in irradiation level
Irradiation level (S) Maximum Power (Pmax)
0.8 kW/m2 114W
1 kW/m2 146W
1.2 kW/m2 179W
© 2015 IJEDR | Volume 3, Issue 2 | ISSN: 2321-9939
IJEDR1502204
International Journal of Engineering Development and Research (www.ijedr.org)1244
(a)(b)
Fig. 8. Response chararecterstics of MPPT control with radiation changing V. CONCLUSION