R E S E A R C H
Open Access
High-resolution remote sensing image
segmentation based on improved RIU-LBP
and SRM
Jian Cheng
*, Lan Li, Bo Luo, Shuai Wang and Haijun Liu
Abstract
In this paper, we propose an improved rotation invariant uniform local binary pattern (RIU-LBP) operator for segmenting high-resolution sensing image which can effectively describe the texture features of a high-resolution remote sensing image. The improved RIU-LBP is based on RIU-LBP. It introduces a threshold in binarization of region pixels. The new LBP operator can better tolerate small texture variation and better distinguish the plain and rough texture than the original RIU-LBP does. Then, a merging criterion of texture regions is proposed, which is based on regional LBP value distribution and Bhattacharyya distance. Finally, the texture merging criterion and spectral merging criterion are combined in the statistical region merging (SRM)-based remote sensing image segmentation method to improve segmentation results, taking full advantage of rich spectral and texture
information in high-resolution remote sensing images. This algorithm can be adjusted to the number of segmented regions, and experiments indicate better segmentation results than ENVI 5.0 and the SRM method.
Keywords:High-resolution remote sensing image segmentation; Local binary pattern; Bhattacharyya distance
1 Introduction
Segmentation is an important problem in remote sens-ing image processsens-ing [1,2]. Early remote senssens-ing image segmentation methods utilize pixel-based strategies and ignore rich spectral and structure information. Thus, the segmentation results are unsatisfactory and have adverse influence on following image analysis. In recent years, object-oriented segmentation methods are extensively applied in remote sensing image analysis. Homogenous region features such as intensity, texture, and shape can be used to improve the segmentation accuracy. Although there have been many significant object-oriented seg-mentation algorithms in remote sensing image segmen-tation using multispectral information [3-5], only a few ones can be effectively applied in the segmentation of high-resolution remote sensing images. High-resolution remote sensing images contain rich spatial texture infor-mation in many scales which is an advantageous resource in the process of remote sensing image segmentation [6,7]. However, traditional image segmentation algorithms
do not take rich texture information into account. Nock and Nielsen proposed a statistical method for image seg-mentation by merging region following a particular order of regions [8]. The method uses the most common nu-merical pixel attribute spaces. However, it mainly exploits spectral information in images and ignores useful texture features. On the basis of Nock and Nielsen's work, some new statistical region merging (SRM)-based segmentation algorithms which are specific for high-resolution remote sensing image segmentation are proposed [9-11]. How-ever, none of them focus on taking advantages of texture information in the merging process. To take such texture features into account, we add texture information in the merging process of the SRM to enhance the seg-mentation performance. Among numerous texture de-scription methods, the local binary pattern (LBP) operator is chosen in consideration of its combination of statistic-based and structure-statistic-based methods. It has been proved to be theoretically simple and very effective in describing the characteristics of local texture regions. Some improve-ments on LBP operators have been proposed such as mul-tiscale LBP, rotation invariant LBP, rotation invariant uniform LBP (RIU-LBP), etc. [12-14].
* Correspondence:[email protected]
School of Electronic Engineering, University of Electronic Science and Technology of China, Chengdu, Sichuan 611731, People’s Republic of China
In this paper, we propose a high-resolution remote sensing image segmentation algorithm based on the im-proved LBP feature and SRM region merging method. The proposed algorithm can make full use of the spectral information and the texture information in the high-resolution remote sensing image. Moreover, the appropriate criterion can be adaptively chosen in the region merging step according to the characteris-tics of regions, which can further improve the segmentation performance. This algorithm can segment high-resolution remote sensing images with complex scene effectively. The contributions of our proposed method includes the following: First, an improved RIU-LBP is proposed to describe texture features as the traditional LBP has diffi-culties in differentiating high-resolution remote sensing image regions with different textures. The improved RIU-LBP operator is based on the RIU-LBP feature. A threshold is introduced to determine a uniform mode that handles regions with similar spectral information but different texture information. Second, the improved RIU-LBP operator is applied to extract texture infor-mation in high-resolution remote sensing images for segmentation tasks. The merging criterion based on tex-ture information is combined with the SRM method to form a double criterion to predict whether merging or not. The merging rule based on texture information adopts the Bhattacharyya distance. As shown in the experimental re-sults, the proposed method outperforms the SRM and ENVI 5.0, which is a remote sensing image processing soft-ware developed by the Exelis Visual Information Solutions. This paper is organized as follows. In Section 2, we re-view the basic LBP and RIU-LBP and then propose the improved RIU-LBP. In Section 3, we present the seg-mentation algorithm. The proposed scheme using the improved RIU-LBP and SRM is described elaborately. Experiment results and analysis are shown in Section 4. Finally, the paper is concluded in Section 5.
2 The LBP operator
2.1 Rotation invariant uniform local binary pattern
To describe the image texture features, the LBP was pro-posed by Ojala et al. [12]. The LBP combined the statistics-based method and the structure-based method effectively. Thus, compared with other methods, it has a great advantage in describing the texture feature of image regions. For simplification, we take one color chan-nel in images for discussion. The key of LBP is to encode image pixels' value into binary codes. First, the gray value of the geometric center in a local region is used as a threshold value to binarize pixels around the center. Then, the binarization values are multiplied by the correspond-ing weights accordcorrespond-ing to their positions. Addcorrespond-ing the weighted binarization values, the coding value of the cen-ter pixel can be obtained.
The basic LBP has much variations and the quantization is crude, which has high computational complexity. With extensive statistical analysis, Ojala et al. found that the local binary patterns have strong regular form. Some spe-cific patterns account for a large proportion of the total of the LBP. These local binary patterns have a similar struc-ture, where the number of the 0/1 or 1/0 transitions be-tween adjacent positions of the neighborhood pixels in the local region is very small. Therefore, Ojala et al. defined those patterns as‘uniform’patterns and proposed a RIU-LBP operator so that a statistical distribution on uniform patterns can be effectively computed. Unlike the basic LBP, the RIU-LBP chooses circular neighborhoods as the center pixel's coding unit and focuses on pixels which have uniform mode [12,13]. Equation (1) shows how to deter-mine whether a local binary pattern is uniform:
ULBPP;R¼ sign gP−1−gc
wherePis the number of pixels around the center pixel,R represents the radius of the circular neighborhood, gc is
the gray value of the center pixel, gpis the gray value of
the pth pixel around the center following the specific
order, andp∈[0,P−1]. WhenU(LBPP,R)≤2, the pattern is determined as uniform [13], i.e., the pattern whose num-ber of 0/1 or 1/0 transitions between the adjacent posi-tions of the neighborhood pixels is less than two times is uniform. Moreover, the RIU-LBP operator can be defined as
2.2 Improved rotation invariant uniform local binary pattern
The sign operator sign(gp−gc) dominates the result of
RIU-LBP. If a slight change happens in gray values, LBPriu2
P;R might change dramatically as shown in Figure 1. In other words, LBPriu2
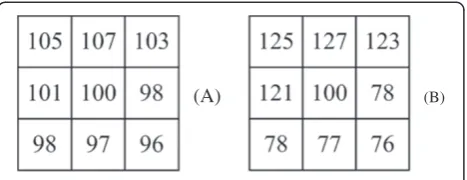
P;R is easily affected by the slight vari-ation of gray values in the neighborhood pixels. Observing the left columns in Figure 1A,B, it is obvious that the dif-ference between Figure 1A,B is very small, but their LBPriu28;1 values are quite different: Figure 1A is the uniform LBP and the LBPriu28;1 value is 3, while Figure 1B is the non-uniform LBP and the LBPriu2
8;1 value is 9.
very close to the center pixel's gray value. In other words, LBPriu2
P;R is sensitive to the light variation. Unfortu-nately, this situation is prone to occur in remote sensing images because high-resolution remote sensing images have rich texture information, and the gray values of dif-ferent image regions with the same texture information are vulnerable to this disturbance.
To solve this problem, we add a threshold T to make
LBPriu2P;R stable. Then, the improved RIU-LBP operator is defined as whenT= 0. Thus, LBPriu2P;R has the comprehensive ability to represent texture features.
To illustrate LBPriu2P;R;Ts advantages for describing texture features intuitively, two examples are shown in Figures 2 and 3. The parameters are set asP= 8,R= 1, andT= 20. Figure 2 illustrates the binarization result of LBPriu28;1;T using the same two similar regions as Figure 1. Figure 3 shows two regions with different texture characteristics, and this example can show another advantage of the LBPriu28;1;Toperator.
As shown in Figures 1 and 2, for the two similar local texture regions, their LBPriu2
8;1 values are different, but
their LBPriu28;1;20 values are the same. LBPriu28;1;20is more ro-bust to light variation and image noises. From Figure 3, we can see that Figure 3A is relatively flat while Figure 3B is relatively rough. After calculating the LBP values by LBPriu2
8;1 and LBP riu2;20
8;1 , respectively, it is easy to find out
that the LBPriu28;1 values of both Figure 3A,B are the same, but their LBPriu28;1;20 values are different. According to this example, it is obvious that LBPriu28;1;20can effectively distin-guish different texture features than LBPriu2
8;1 does.
According to the analysis and verification above, two merits of the improved RIU-LBP operator are observed. The first merit is the ability to eliminate the disturbance of the small gray value variation in the texture regions, which can improve the robustness for the description of texture regions with the same texture feature. The sec-ond one is the strong discrimination capability for differ-ent texture regions, such as the flat texture region and
(A) (B)
Figure 1Two similar regions and their binarization results.Pixels in(A)and(B)are the same except the pixel in the second row and first column. Their binarization results are similar, but the values of LBPriu2
P;R are different.
(A) (B)
the rough texture region. These two advantages are in favor of the segmentation and the classification of the texture image.
3 High-resolution remote sensing image segmentation
3.1 Statistical region merging
The SRM algorithm is an effective image segmentation algorithm, which was proposed by Nock and Nielsen [8]. The SRM algorithm is based on region growing and merging techniques with statistical tests to determine the merging of regions. The image segmentation algo-rithm based on SRM includes two crucial steps: the mer-ging predication and the computing order to test region merging.
LetIbe the observed image, and |I| be the number of pixels in the image, where |·| stands for the cardinal number. LetRlbe a set of regions withlpixels, the
mer-ging predication on the two candidate regions Rand R'
can be defined as image regionR,gis the gray level which is usually 256
in remote sensing images, and Q is the spectral scale
factor to weigh the possibility to merge two regions based on spectral information. It controls the number of the regions in the segmentation result. As three color channels exist in remote sensing images, two regions are merged together whenP(R(p),R(p')) of any color channel returns true. Obviously, spectral information is the major factor to predict region merging in the SMR algorithm.
If the 4-neighborhood rule is adopted, there areN< 2|I| adjacent pixel pairs in the observed imageI. LetSIbe the
set of all these pixel pairs inI, andf(p,p') be a real valued
function to measure the similarity of two pixels in the pixel pair (p,p'). In the SRM algorithm, a pre-ordering strategy is proposed by Nock and Nielsen. The procedure of this strategy can be described as follows: first, sort all the pairs inSIby the increasing order off(p,p'), and then
traverse this order only once. For each pair of pixels (p,p')
∈ SI, if R(p)≠R(p'), where R(p) stands for the region to
which the P pixel belongs, and the value ofP(R(p),R(p')) returns true,R(p) andR(p') can be merged [8].
3.2 High-resolution remote sensing image segmentation based on improved RIU-LBP and SRM
A good segmentation for high-resolution remote sensing images should take both of its spectral information and texture information into account. However, the SRM al-gorithm mainly exploits the spectral information in im-ages and ignores useful texture features. To make up the deficiency, we introduce the texture information in the SRM algorithm, and the texture information is repre-sented by our proposed LBP descriptor.
In order to compare the texture similarity between two regions, the Bhattacharyya distance is chosen. For a processed image by the LBP operator, the Bhattacharyya distance of two regionsRandR'can be calculated by
JBðR;R0Þ ¼−ln ∑
i∈EpRð Þi qR0ð Þi
ð7Þ
where pR(i) and qR'(i) represent the probability of the
pixels whose improved RIU-LBP values are i in the
re-gions R and R', respectively, and E is an ensemble of
possible improved RIU-LBP values. As the Bhattacharyya distance increases, the similarity becomes lower between two candidate regions. The merging criteria based on the Bhattacharyya distance can be defined as
PBðR;R0Þ ¼ true; if JB R;R
whereJB(R,R') is the Bhattacharyya distance between the
regions R and R', and M is the texture scale parameter
to control the merging scale based on the texture
infor-mation. The greater is M, the lower is the region
mer-ging probability. IfPB(R,R') is true, we merge the regions
RandR'. It is similar to the SRM algorithm that two re-gions can be merged ifPB(R(p),R(p')) of any color
chan-nel returns true.
The SRM algorithm mainly employs the spectral infor-mation for region merging. However, there are many dif-ferent regions with a similar spectral feature because these regions show quite different texture features. For these regions, the SRM algorithm is prone to over-merging. To solve this problem, we introduce the tex-ture information in the process of region merging. With this improvement, the condition of two regions merging
(A) (B)
Figure 3Two different regions.Two regions have different texture characters.(A)is relatively flat, while(B)is relatively rough. The LBPriu2
is stricter. If two regions are merged, they must satisfy both the spectral similarity condition (5) and the texture similarity condition (8). The two merging scale factors,
i.e., the spectral scale factor Q and the texture scale
factor M, are combined to decide the final number of
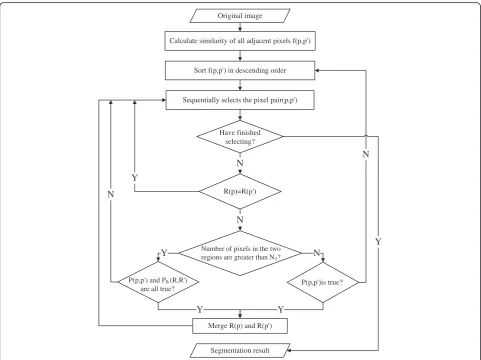
regions in the segmentation result. The algorithm flow is shown in Figure 4. First, all adjacent pixel pairs' similarity function value is calculated. Then, we sort all the pixel pairs following the increasing order of similarity function value, and choose the pairs ac-cording to this order to determine whether two pixels in each pair comes from the same region. If they are from different regions, another decision that whether the merging criterion is satisfied should be made. The merging criterion is divided in two cases by the size of two regions because the texture information could be stably and exactly extracted from a large enough region. If the numbers of pixels in two regions are
greater than the pre-set value NT, we need to
com-pare their spectral similarity and texture similarity. In other cases, only the spectral similarity needs to be
taken into account. The segmentation result is ob-tained after all pixel pairs are processed.
4 The experimental results
We choose two high-resolution remote sensing images as experimental data. The first image is shown in Figure 5 which was obtained in late October 2009. It includes three bands with a resolution of 0.5 m. The second image is shown in Figure 6 which was taken on January 2, 2010 and the resolution is 0.5 m.
4.1 Comparison of RIU-LBP and improved RIU-LBP
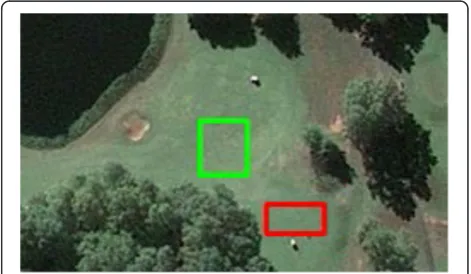
In order to verify the texture representation ability of the improved RIU-LBP, we compare its discrimination with those of the RIU-LBP. Two images tailored from Figure 5 are selected as experimental images. The first tailored image for verifying the discrimination is shown in Figure 7, and the second one for comparing the sta-bility is shown in Figure 8.
First, two different types of region specified by the red rectangle and the green rectangle are selected in Figure 7.
Calculate similarity of all adjacent pixels f(p,p')
Sort f(p,p') in descending order
Sequentially selects the pixel pair(p,p')
Have finished selecting?
R(p)=R(p')
Number of pixels in the two regions are greater than NT?
P(p,p') and PB(R,R')
are all true? P(p,p')is true?
Merge R(p) and R(p')
Segmentation result
N
N
Y N
Y Y
N
Y Y
N
Original image
The region surrounded by the red rectangle contains woods only, and the other contains lawn only. Next, we process two regions with LBPriu2P;R and LBPriu2P;R;T, respectively, and then calculate the corresponding LBP value distribution (Figure 9) and Bhattacharyya distance (Figure 10). The threshold in LBPriu2P;R;T is set to 15 in Figure 9. In these ex-periments,Pis 8 andRis 1. As shown in Figure 9, it is ob-vious that the LBPriu2
P;R value distributions of heterogeneous regions are similar while the LBPriu2P;R;T value distributions are different. LBPriu2P;R;T can better distinguish heteroge-neous regions than LBPriu2
P;R does.
Since the distribution in Figure 9 is obtained when
T= 15, the result might not be convincing in general.
To further validate the ability to distinguish two het-erogeneous regions, varying thresholds are used to
compute the distributions with LBPriu2P;R;T, and the Bhattacharyya distance is introduced to measure the dif-ference of two regions. Since LBPriu2P;R;T can be viewed as a function whose parameter is the thresholdT, the discrete Bhattacharyya distance can be considered as a function whose parameter is thresholdTas well. Since LBPriu2
P;R is a constant after specifying two regions, we can regard it as a function whose parameter is thresholdTtoo for conveni-ent comparison. Figure 10 shows the Bhattacharyya dis-tance of two regions from Figure 7 after computing their LBPriu2P;R and LBPriu2P;R;T features with different thresholds. From Figure 10, we find that the Bhattacharyya distance of LBPriu2P;R;Tis greater than that of LBPriu2P;R when 1≤T≤60. According to the analysis in Section 3.2, the LBP value distribution of two different regions is more dissimilar using the LBPriu2P;R;T operator, and thus, LBPriu2P;R;T distinguishes the lawn and woods better. Therefore, LBPriu2P;R;T is better in the discrimination of the different texture regions.
Similar to the experiment to verify the discrimination of LBPriu2P;R;T, two homogenous regions specified by a red rectangle and a green rectangle are selected in Figure 8 to compare the stability to homogenous regions. Figure 5GeoEye-1 image of Fairfax in Virginia.
Figure 6GeoEye-1 image of San Diego, California Town and Country Grand Hotel.
Figure 7The tailored remote sensing image.The two regions specified by red and green rectangles are heterogeneous regions. They are used to compare texture describing ability of RIU-LBP and improved RIU-LBP.
Apparently, two regions are both lawn. Next, we process two regions with similar procedures. The final LBP value distributions are presented in Figure 11, and the Bhatta-charyya distance is shown in Figure 12. The threshold in LBPriu2P;R;T is set to 15 as well. As we can see in Figure 11, both LBPriu2P;R value distribution and LBPriu2P;R;T value distri-bution are similar for homogenous regions. To further test the stability to describe homogenous regions, com-parison of the Bhattacharyya distance is used as well. In Figure 12, the distances with LBPriu2P;R;T are lower than the distances with LBPriu2
P;R when 18≤T≤27 andT≥32, which denotes that LBPriu2P;R;T0s representation ability to
homogenous regions is more stable than that of LBPriu2
P;R with a proper threshold.
From these experiments, we can draw a conclusion that the texture representation ability of LBPriu2P;R;Tis better than that of LBPriu2
P;R for the stability to homogenous regions and the discrimination to heterogeneous regions. Recal-ling the analysis in Section 2.2, the essential reason is that our proposed LBP operator can block small variation of the gray values of the pixels around the center pixel and can strongly discriminate the flat and rough regions.
4.2 High-resolution remote sensing image segmentation experiments
The aim of the experiments below is to compare the segmentation performance with the SRM algorithm [8] and ENVI 5.0. ENVI 5.0 is the latest version of the re-mote sensing image processing software developed by Exelis Visual Information Solutions. It includes a feature extraction module with remote sensing image segmen-tation tools. The segmensegmen-tation method in ENVI 5.0 consists of two main steps: an edge-based segmenta-tion followed by Full Lambda Schedule [15] merging technique.
To measure the segmentation quality, we choose two indexes to measure the quality of segmentation object-ively. The first index is pixel segmentation error rate E¼Nerror
Nsum 100%, where Nerror represents the number
of pixels that are misclassified, and Nsum is the total number of pixels to be classified in the image. The
second index is the region ratio RR¼ NR
Nref, where NR
is the number of regions in the final segmentation
image, and Nref is the number of regions in the
refer-ence segmentation image. When the pixel
segmenta-tion error rate E remains unchanged, the area ratio
RR being close to 1 indicates that the segmentation
(A)
(B)
Figure 9The LBPriu2
P;R value distribution (A) and LBP
riu2;T
P;R value distribution (B) of the two heterogeneous regions in Figure 7.Green bars
represent the LBP value distribution of the region specified by the green rectangle in Figure 7, and red bars represent the LBP value distribution of the region specified by the red rectangle in Figure 7.
Figure 10The Bhattacharyya distance of the two regions in
Figure 7 after processing with LBPriu2P;R;Tand LBPriu2
result is better. RR> 1 implies over-segmentation which means too many segmentation regions in the
result image. RR< 1 means under-segmentation which
indicates that some different regions are merged into the same region.
Two high-resolution remote sensing images are chosen to conduct the segmentation comparison. The first one is Figure 5. To evaluate the segmentation result, we need a reference segmentation image. As the detail in high-resolution remote sensing images is quite clear, the reference image is obtained by manual segmentation and the result is shown in Figure 13. While the segment factor is 48.2 and the merge factor is 98.0, ENVI 5.0 works best, and the result is given in Figure 14. When
the scale factor Q is 250, the SRM segmentation
algo-rithm works best, and the segmentation result is shown
in Figure 15. In our proposed segmentation algorithm,
Q is chosen as 200, the LBP operator is defined as
LBPriu28;1;15 andM is 0.12, and the result is best. The result of our proposed segmentation algorithm is shown in
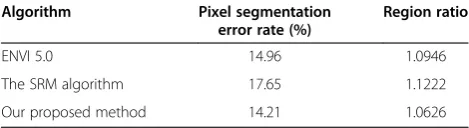
Figure 16. The indexes E and RR of three methods
are shown in Table 1. The second image is shown in Figure 6, which was taken on January 2, 2010, and the resolution is 0.5 m. The segmentation result of ENVI 5.0 is shown in Figure 17. The segmentation scale factor is set to be 36.8, and the merging scale factor is chosen as 98.0. Then, we use the SRM algorithm to segment
this image and set the segmentation scale factor Q as
1,000. The segmentation result is shown in Figure 18. In our proposed algorithm, the LBP operator is LBPriu28;1;12, Q is set to 100, and M is chosen as 0.1. The result is shown in Figure 19.
(A)
(B)
Figure 11The LBPriu2
P;R value distribution (A) and LBP
riu2;T
P;R value distribution (B) of the two heterogeneous regions in Figure 8.Green
bars represent the LBP value distribution of the region specified by the green rectangle in Figure 8, and red bars represent the LBP value distribution of the region specified by the red rectangle in Figure 8.
0 10 20 30 40 50 60
0 0.005 0.01 0.015 0.02 0.025
Threshold
Bhattacharyya distance
Improved rotation invariant uniform LBP Rotation invariant uniform LBP
Figure 12The Bhattacharyya distance between the two regions
in Figure 8 after processing with LBPriu2P;R;Tand LBPriu2
4.2.1 Comparison analysis with ENVI 5.0
As shown in Figures 14 and 16, it is clear that our pro-posed algorithm outperforms ENVI 5.0 subjectively. As shown in Figure 14, two regions that have different spec-tral information with surrounding lawn are segmented into one region. This is because ENVI 5.0 does not make full use of the spectral information and the texture
(A) (B)
Figure 14The segmentation result of Figure 5 using ENVI 5.0. (A)The boundaries of segmented regions are illustrated by green curves. (B)The segmented regions are labeled in different colors.
(A) (B)
Figure 15The segmentation result of Figure 5 using the SRM algorithm. (A)The boundaries of segmented regions are illustrated by red curves.(B)The segmented regions are labeled in different colors.
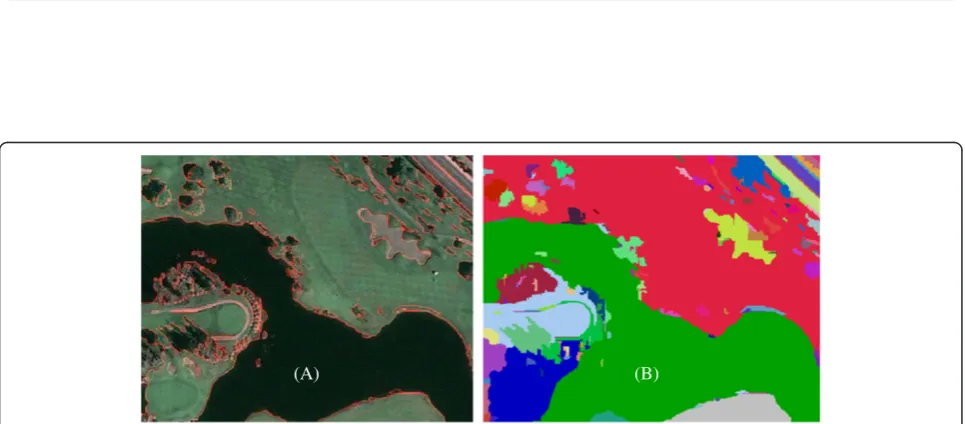
(A) (B)
Figure 16The segmentation result of Figure 5 using our proposed algorithm. (A)The boundaries of segmented regions are illustrated by red curves.(B)The segmented regions are labeled in different colors.
Table 1 The detail results (EandRR) of the three segmentation methods
Algorithm Pixel segmentation error rate (%)
Region ratio
ENVI 5.0 14.96 1.0946
The SRM algorithm 17.65 1.1222
(A) (B)
Figure 17The segmentation result of Figure 6 using ENVI 5.0. (A)The boundaries of segmented regions are illustrated by green curves.(B) The segmented regions are labeled in different colors.
(A) (B)
Figure 18The segmentation result of Figure 6 using the SRM algorithm. (A)The boundaries of segmented regions are illustrated by red curves.(B)The segmented regions are labeled in different colors.
(B) (A)
information, and the edge and the geometrical relation-ships between adjacent regions are the main cues used in ENVI 5.0 segmentation algorithm. Our method's re-sult in Figure 16 shows that our method performs better in separating regions with different spectral information. This is because our proposed algorithm inherits the merits of the original SRM algorithm. The objective in-dexes also indicate that our proposed algorithm is better.
The indexE is the smallest. Meanwhile, the index RRis
the region ratio which is closest to 1. From Figures 17 and 19, we can draw the same conclusion that our pro-posed algorithm is better. A large number of homogenous regions are merged into different areas in Figure 17. Moreover, ENVI 5.0 cannot segment lawn and trees in the top left corner accurately, and even with a bigger segmentation scale factor, the regions of lawn and trees still are mis-merged. In Figure 19, our method segments regions of lawn and trees into different re-gions and merges most homogenous rere-gions into one region.
4.2.2 Comparison analysis with the SRM algorithm
As shown in Figures 15 and 16, the SRM algorithm over-segments many regions such as the regions of the bottom left corner and the top right corner. Parts of woods and lawn are merged into one region in the bot-tom left corner, and parts of woods and road are merged together in the top right corner as they have similar spectral information. The segmentation result in Figure 16 obviously has superior performance in separating regions with similar spectral information but different texture information. This is because our proposed algorithm applies the improved RIU-LBP to describe the texture information and adds the adaptive merging criterion in the original SRM algorithm. So the spectral and texture information could be involved in judgment of region merging. Thus, Figure 16 by our method has the best subjective segmentation results. The objective indexes also show that our proposed algorithm is better. From Figures 17 and 18, we observe that the SRM algo-rithm has the same problem with ENVI 5.0 that it cannot segment the lawn and trees in the top left corner because the spectral information of the lawn and trees in Figure 6 are very close. A greater segmentation scale factor does not help, but our proposed algorithm works well. From Figure 19, the lawn and trees have been separated well by our method. It owes to the utilization of the texture infor-mation which has distinct difference between the lawn and trees, and the satisfactory result is obtained without over-segmentation.
5 Conclusions
In this paper, we improve the RIU-LBP descriptor by introducing a threshold in the binarization step. The
new LBP operator can better describe the texture in-formation of high-resolution remote sensing images. Then, the segmentation algorithm is proposed based on the idea that the appropriate criterion is adap-tively selected for merging according to the nature of the region, which can make full use of the spectral information and the texture information in high-resolution remote sensing images. Our proposed al-gorithm improves the accuracy of segmentation of the texture regions and successfully segments differ-ent regions that have similar spectral information with different texture information. The experimental results demonstrate the effectiveness of our proposed algorithm.
Competing interests
The authors declare that they have no competing interests.
Acknowledgements
This research was supported by the National Natural Science Foundation of China (61201271), Specialized Research Fund for the Doctoral Program of Higher Education (20100185120021), and Sichuan Science and Technology Support Program (cooperated with the Chinese Academy of Sciences) (2012JZ0001).
Received: 29 July 2013 Accepted: 25 October 2013 Published: 11 November 2013
References
1. Z Cao, Y Tan, J Feng, Segmentation of PolSAR image by using an automatic initialized variational model and a dual optimization approach. EURASIP J. Wireless Commun. Netw.1, 1–10 (2013)
2. D Tuia, J Muñoz-Marí, G Camps-Valls, Remote sensing image segmentation by active queries. Pattern Recogn.45(6), 2180–2192 (2012)
3. A Sarkar, MK Biswas, B Kartikeyan, V Kumar, KL Majumder, DK Pal, A MRF model-based segmentation approach to classification for multispectral imagery. IEEE Trans. Geosci. Remote Sens.40(5), 1102–1113 (2002) 4. P Mitra, B Uma Shankar, SK Pal, Segmentation of multispectral remote
sensing images using active support vector machines. Pattern Recogn. Lett.25(9), 1067–1074 (2004)
5. P Paclik, RPW Duin, GMP van Kempen, R Kohlus, Segmentation of multi-spectral images using the combined classifier approach. Image Vis. Comput.21(6), 473–482 (2003)
6. M Unser, Texture classification and segmentation using wavelet frames. IEEE Trans. Image Process.4(11), 1549–1560 (1995)
7. A Clausi, H Deng, Design-based texture features fusion using gabor filters and co-occurrence probabilities. IEEE Trans. Image Process.14(7), 925–936 (2005) 8. R Nock, F Nielsen, Statistical region merging. IEEE Trans. Pattern Anal.
Mach. Intell.26(11), 1452–1458 (2004)
9. HT Li, HY Gu, YS Han, JH Yang, An efficient multiscale SRMMHR (Statistical Region Merging and Minimum Heterogeneity Rule) segmentation method for high-resolution remote sensing imagery. IEEE J. Selected Topics in Appl. Earth Observations and Remote Sensing2(2), 67–73 (2009)
10. XT Wang, JT Wu, Remote sensing image segmentation based on statistical region merging and nonlinear diffusion, inProceedings of the 2nd International Asia Conference on Informatics in Control, Automation and Robotic(IEEE, Piscataway, 2010), pp. 32–35
11. AH Souri, A Mohammadi, MA Sharifi, A new prompt for building extraction in high resolution remotely sensed imagery, inProceedings of the International Archives of the Photogrammetry, Remote Sensing and Spatial Information Sciences, vol. XL-1/W3 (International Society of Photogrammetry and Remote Sensing, Vienna, 2013)
12. T Ojala, M Pietikäinen, D Harwood, A comparative study of texture measures with classification based on feature distribution. Pattern Recogn.
13. T Ojala, M Pietikäinen, T Mäenpää, Multiresolution gray-scale and rotation invariant texture classification with local binary patterns. IEEE Trans. Pattern Anal. Mach. Intell.24(7), 971–987 (2002)
14. CH Lin, CW Liu, HY Chen, Image retrieval and classification using adaptive local binary patterns based on texture features. IET Image Process. 6(7), 822–830 (2012)
15. Exelis Visual Information Solutions Company,ENVI 5.0 Help(Exelis, Boulder, 2012)
doi:10.1186/1687-1499-2013-263
Cite this article as:Chenget al.:High-resolution remote sensing image segmentation based on improved RIU-LBP and SRM.EURASIP Journal on Wireless Communications and Networking20132013:263.
Submit your manuscript to a
journal and benefi t from:
7 Convenient online submission
7 Rigorous peer review
7 Immediate publication on acceptance
7 Open access: articles freely available online
7 High visibility within the fi eld
7 Retaining the copyright to your article