R E S E A R C H
Open Access
Statistical method for performance analysis of
WBAN in time-saturation
Pham Thanh Hiep
1,2Abstract
Performance analysis of carrier sense multiple access with collision avoidance (CSMA/CA) scheme based on IEEE 802.15.6 standard has been discussed in many literatures. In previous works on IEEE 802.15.6 and another standards, the performance was analyzed by using access probability in one slot duration and the Markov chain model was proposed to calculate the access probability in both saturation and non-saturation models. However, for both saturation and non-saturation models, the access probability or the packet arrival rate was assumed to be fixed and the effect of remained packets that was transmitted unsuccessfully due to busy channel or collision was not considered. In this paper, in order to evaluate the system performance more accurately, the effect of the remained packet is taken into account and a statistical method is proposed to calculate the successful probability of wireless body area networks (WBANs). Moreover, a time-saturation model is defined as a system model in which the system performance is changed following the operating time, and then, the change between three models, i.e., saturation, non-saturation, and time-saturation models, is analyzed. The calculation result indicates that the proposal method can achieve the same performance as the Markov chain method in both saturation and non-saturation models. However, in the time-saturation model, the proposal statistical method is more accurate.
Keywords: CSMA/CA based on IEEE 802.15.6 standard; Saturation model; Non-saturation model; Time-saturation model; Performance analysis of WBAN
1 Introduction
The aging society, the limited health care resources, the miniaturization of biomedical sensors, and a wide appli-cation market have triggered the concept of wireless body area networks (WBANs) and received consider-able attentions in the academy and industry. The WBAN applications contain medical applications, entertainment applications, and disability-assistance applications. The IEEE 802.15 has established Task Group 6 (TG6) for an appropriate communication standard for WBANs, called IEEE 802.15.6. The first version of the standard had been issued in February 2012 [1].
An efficient media access control (MAC) protocol is very important to guarantee the timely delivery of emer-gency traffic. Therefore, the analysis of IEEE 802.15.6 is necessary, and there have been some works on MAC
Correspondence: [email protected]
1Yokohama National University, 79-5 Tokiwadai, Hodogaya, 240-8501 Yokohama, Japan
2Le Quy Don Technical University, 236 Hoang Quoc Viet, Bac Tu Liem, Cau Giay, 100000 Ha Noi, Vietnam
protocol. The efficient MAC protocols to improve the energy consumption were proposed in [2,3]. Comprehen-sive investigations of WBAN were represented in [4,5]. For in-body communications, RF technologies and MAC protocols were introduced in [6,7].
In the IEEE 802.15.6 standard, user priorities (UPs) are divided into eight levers for different applications. A sen-sor may initiate frame transaction in different contention-based access phases using carrier sense multiple access with collision avoidance (CSMA/CA) and Slotted Aloha. A coordinator of WBANs has the ability of arranging com-mitted scheduled allocation intervals, unscheduled bi-link allocation intervals on the best-effort basis, and impro-vised polled and posted allocation intervals in contention-free access phases. The detailed overview of MAC and physical (PHY) functionalities in IEEE 802.15.6 was repre-sented in [8-10].
The performance analysis of the CSMA/CA scheme based on IEEE 802.15.6 has been discussed in many literatures. The theoretical maximum throughput and minimum delay limit of IEEE 802.15.6 was descripted
for different frequency bands and data rates in [11-13]. Rashwand et al. are focusing on the impact of different access phase lengths to evaluate the network performance [14-17]. The analytical model based on the Markov chain and the throughput performance of IEEE 802.11 were pro-posed [18]. In [19,20], authors represented the network performance of different access categories in IEEE 802.11e and IEEE 802.15.4, respectively.
In the previous works on IEEE 802.15.6 and another standard, the performance was analyzed by using the access probability in one slot duration. The Markov chain model was proposed to calculate the access probability in both saturation and non-saturation models. The satura-tion model is defined as the system model in which there is at least one sensor that has a packet to send, whereas the non-saturation model is the system model that does not always have a sensor that has a packet to send. However, for both saturation and non-saturation models, the access probability and/or the packet arrival rate meaning the number of generated packets per second were assumed to be fixed. The effect of remained packets that were not transmitted successfully due to busy channel or collision was not considered. It means that the system performance was analyzed in 1 s from the start.
In this paper, the effect of the remained packet is taken into account and the statistical method to calculate a con-vergence of throughput based on CSMA/CA scheme of IEEE 802.15.6 is proposed. The term of time-saturation model is defined as a system model whose performance is changed following the operating time. In the previ-ous works, the system model was assumed to be the saturation or the non-saturation model and then the per-formance was analyzed. However, based on the proposal calculation method, we indicate that the successful proba-bility as well as the system throughput converge on values and the time-saturation model can be the saturation or non-saturation model according to the system param-eters. Therefore, the proposal method is more flexible
and expected to be more accurate. The relation between three models, i.e, saturation, non-saturation, and time-saturation models, is analyzed and the change between these three models based on the system parameters is represented.
The rest of the paper is organized as follows. We introduce the main concept of IEEE 802.15.6 standard in Section 2. Section 3 shows the performance analy-sis of WBAN by the discrete-time Markov chain method and the proposal method. The numerical evaluation is described in Section 4. Finally, Section 5 concludes the paper.
2 Related description of the IEEE 802.15.6 standard
In this section, we describe some parts of the IEEE 802.15.6 standard that relate to our research. The detail of this standard is represented in [1].
2.1 Physical layer
The current IEEE 802.15.6 standard defines three PHY layers, i.e., narrowband (NB), ultra wideband (UWB), and human body communications (HBC) layers. The selec-tion of each PHY depends on requirements of applicaselec-tion. In this work, since we focus on performance analysis of WBAN based on CSMA/CA scheme, NB is considered as an example.
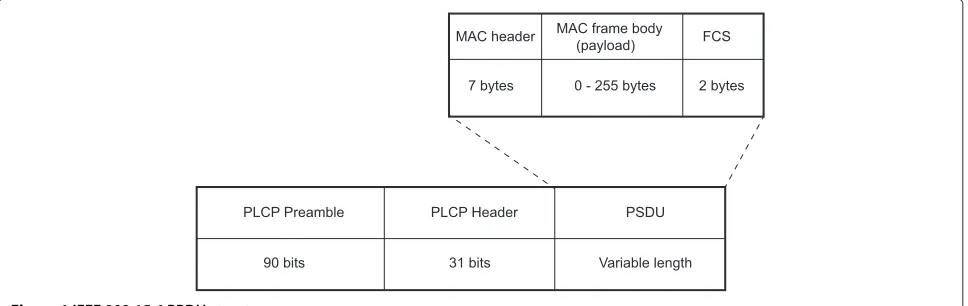
The NB PHY is responsible for activation/deactivation of the radio transceiver, clear channel assessment (CCA) within the current channel, and data transmis-sion/reception. The physical protocol data unit (PPDU) frame of NB PHY contains a physical layer convergence procedure (PLCP) preamble, a PLCP header, and a PHY service data unit (PSDU) as given in Figure 1. The PLCP preamble helps the receiver in the timing synchronization and carrier-offset recovery. It is the first component being transmitted at the given symbol rate. The PLCP header conveys information necessary for a successful decoding
PLCP Preamble
90 bits
PLCP Header PSDU
31 bits Variable length
MAC header MAC frame body
(payload) FCS
7 bytes 0 - 255 bytes 2 bytes
of a packet to the receiver. The PLCP header is transmit-ted after the PLCP preamble using the given header data rate in the operating frequency band. The last compo-nent of PPDU is PSDU which consists of a MAC header, MAC frame body (also called as payload), and frame check sequence (FCS) and is transmitted after the PLCP header using any of the available data rates in the operating fre-quency band. A WBAN device should be able to support transmission and reception in one of the frequency bands summarized in Table 1. (Further detail for modulation and channel coding can be found in [1,10]).
2.2 Introduction of CSMA/CA based on IEEE 802.15.6 In IEEE 802.15.6, there are three access mechanisms that are comprehensively discussed in the standard. 1) Ran-dom access mechanism, which uses either CSMA/CA or a slotted aloha procedure for resource allocation; 2) Impro-vised and unscheduled access (connectionless contention-free access), which uses unscheduled polling/posting for resource allocation; and 3) Scheduled access and vari-ants (connection-oriented contention-free access), which schedule the allocation of slots in one or multiple upcom-ing superframes, also called 1-periodic or m-periodic allocations. Since the CSMA/CA is considered in our analysis, the basic procedures of this protocol is explained as defined in the standard.
Table 1 Main parameter for NB
Frequency Packet Symbol rate Data rate band component (Ksps) (Kbps)
420 to 450 MHz PLCP header 187.5 57.5
PSDU 187.5 75.9
PSDU 187.5 151.8
PSDU 187.5 187.5
863 to 870 MHz PLCP header 250 76.6
950 to 956 MHz PSDU 250 101.2
PSDU 250 202.4
PSDU 250 404.8
PSDU 250 607.1
902 to 928 MHz PLCP header 300 91.9
PSDU 300 121.4
PSDU 300 242.9
PSDU 300 485.7
PSDU 300 728.6
2360 to 2400 MHz PLCP header 600 91.9
2400 to 2483.5 MHz PSDU 600 121.4
PSDU 600 242.9
PSDU 600 485.7
PSDU 600 971.4
In CSMA/CA, a sensor sets its backoff counter to a random integer number uniformly distributed over the interval [1,W] whereW ∈(Wmin,Wmax)denotes the con-tention window. The values of Wmin and Wmax change depending on the UPs as given in Table 2. The sensor decreases the backoff counter by one for each idle CSMA slot of duration. Particularly, the sensor treats a CSMA slot to be idle if it determines that the channel has been idle between the start of the CSMA slot andpCCATime. If the backoff counter reaches zero, the sensor trans-mits a packet of data. If the channel is busy because of transmission of another sensor, the sensor locks its back-off counter until the channel is idle. TheW is doubled for even number of failures until it reachesWmax. The failure means that the sensor fails to receive an acknowl-edgement from the coordinator. Further details about the CSMA/CA procedure can be found in the standard [1].
2.3 Calculation of service time
The service time (T) is defined as the total time to trans-mit a packet including the backoff time (TW), the time
to transmit a data packet (Tdata), short interframe spacing (TpSIFS), the time of acknowledgement packet (TACK), and delay time (α) that is defined as the sum of propagation delay and signal processing delay.
T =TW+TDATA+TACK+2TpSIFS+2α. (1)
As mentioned above, according to the IEEE 802.15.6 standard, theW is doubled for even number of failures until it reaches Wmax, hence the value of the average backoff time can be obtained as
TW=
W
minTs
2 +P2failWminTs+P4failWmax2Ts for even UPs,
WminTs 2 +P2fail
WmaxTs
2 for odd UPs,
(2)
here, Pfail represents the transmission failed probability andTsdenotes a CSMA slot length.
As shown in Figure 1, since a data packet consists of a preamble, physical header, MAC header, MAC frame
Table 2 Contention window bound for CSMA/CA
User priority Wmin Wmax
0 16 64
1 16 32
2 8 32
3 8 16
4 4 16
5 4 8
6 2 8
Table 3 Other parameters
Clear channel assessment [bits] 63
MAC header [bits] 56
MAC footer [bits] 16
Short interframe spacing timeTsifs[μs] 75
Preamble [bits] 90
Delay timeτ[μs] 1
body, and frame check sequence, the time to transmit a data packet is represented as follows.
TDATA=TP+TPHY+TMAC+TBODY+TFCS, (3)
hereTP,TPHY,TMAC,TBODY, andTFCSrepresent the time to transmit a preamble, physical header, MAC header, MAC frame body , and frame check sequence, respec-tively.
Since an immediate acknowledgement carries no pay-load, its transmission time is given by
TACK=TP+TPHY+TMAC+TFCS. (4)
The other parameters to calculate the service time are summarized in Table 3.
3 Performance analysis for CSMA/CA based on IEEE 802.15.6
3.1 Previous researches
The discrete-time Markov chain (DTMC) method has been applied to calculate the throughput of WBAN based on IEEE 802.15.6 for both the saturation and the non-saturation models in many literatures [14-17]. Figure 2 shows an example of the discrete-time Markov chain method for the non-saturation model; hereρ,Pi,fail, Pi,idle,
andmrepresent a probability of having a packet to send in a slot time, transmission failed probability, channel idle probability, and retry limit number, respectively.
By using the state transition probabilities, the station-ary distributionbi,0,0and the access probability in one slot durationτiare calculated.
τi=
1−Pmi,fail+1 1−Pi,fail
bi,0,0. (5)
Let Ptr andPi,suc denote the transmission probability and the successful probability, respectively. The transmis-sion probability is defined as the probability that there is at least one sensor that accesses the medium in the given slot. The successful probability is defined as the proba-bility that the data packet is successfully received at the coordinator. Therefore, the throughput of sensors in the ithUP can be represented by
Si=
Pi,sucPtrE[x]
(1−Ptr)Ts+Pi,sucPtrT+(1−Pi,suc)PtrTc
, (6)
here,TcandE[x] denote the average time the channel is
sensed as busy by each station due to a collision and the average packet payload size, respectively.
However, the probability of having a packet to trans-mit (the changing of stationary distribution from bi,j,0 (jdenotes a backoff stage and is bound by a retry limitm,
j=0,· · ·,m) tobi,0,W(W =1,· · ·,W0)) is considered as
ρ. Practically, it should be considered in a duration time in which the sensor has been trying to transmit the gen-erated packet. The probability of having a packet to send is much more thanρand changes depending on the value ofj. In case the probability of having a packet to send is not fixed, the calculation of access probability becomes
i,0,W0
Empty
i,0,1
i,m-1,1
i,m,1 i,0,W0-1
i,m-1,Wm-1 i,m-1,Wm-1-1
i,m,Wm i,m,Wm-1
i,0,0
i,m-1,0
i,m,0 1/W0
1/W0 1/W0
1/Wm-1 1/Wm-1
1/Wm-1
1/Wm 1/Wm
1/Wm
Pi,idle Pi,idle Pi,idle
Pi,idle Pi,idle Pi,idle
Pi,idle Pi,idle Pi,idle
1-Pi,idle 1-Pi,idle 1-Pi,idle
1-Pi,idle 1-Pi,idle 1-Pi,idle
1-Pi,idle 1-Pi,idle 1-Pi,idle
Pi,fail
Pi,fail ρ(1-Pi,fail)
ρ(1-Pi,fail)
ρ
(1-ρ)(1-P
i,fail)
(1-ρ)(1-P
i,fail)
(1-ρ)
ρ 1-ρ
considerably complicated. Therefore, we propose the sta-tistical method to analyze the performance.
3.2 Proposal method
In our method, the average backoff time is used. There-fore, the average service time T is considered and, the performance in each service time is analyzed. All sen-sors are assumed to be in the same UP. The probability that there is a packet to transmit afterTduration time is described by
ρ=1−e−λT, (7)
here,λ denotes the packet arrival rate. A packet is suc-cessfully transmitted if 1) only one sensor has a packet to send (scheme 1) and 2) more than one sensor has packet to send; however, only one sensor accesses the channel (scheme 2). The probability of scheme 1 is represented as follows.
here,ijdenotes the binomial coefficient indexed byjand i;Ndenotes the number of sensors. In scheme 2, the num-ber of sensors that have a packet to send is denoted as i; only one sensor successfully transmits when its backoff counter is the smallest and there is not another sensor that has the same backoff counter. As mentioned above, the average backoff counter is used,
W=
The smallest backoff counter is assumed to be set as W ∈ [1,W − 1]. The backoff counter of other sensors therefore should be higher thanW meaning it should be within [W+1,W]. The probability that the backoff count of a sensor is set asW is represented as 1i1
W, and the
probability that the backoff count of the other sensors is
within [W+1,W] is represented as the probability of scheme 2 is described as
Psuc2= probability of both schemes 1 and 2 can be unified as
Psuc=Psuc1 +Psuc2
The throughput in eachTduration time is calculated as
ST =PsucE[x] , (12)
and the throughput of the system in 1 s is described as
S=nTST, (13)
here,nT denotes the number ofT duration times in each
second,nT =floor(T1).
However, this method is just used to analyze the perfor-mance of the system in 1 s after starting. The throughput in (13) is the same as the average throughput of pre-vious researches. However, as explained in Section 1, the convergence of throughput should be estimated. In order to discuss the effect of the remained packet, the successful probability aftert times of T should be con-sidered. The successful probability in (11) is rewritten as
here, Ppac(t) denotes the probability that a sensor has a packet to send afterttimes ofT. Notice that
Ppac(t)=ρ, fort=1. (15)
Ppac(t)=ρ+Ppac(t−1)−
Psuc(t−1)
N , fort>1.
In the CSMA/CA scheme based on IEEE 802.15.6, the packet is discarded after the retry limit. However, accord-ing to the application, the time-out data is deleted; even the number of retransmission does not reach the retry limit. The time-out of data is set asktimes ofT. It means that at the timet=k+1 the packets that were generated at timet=1 are discarded. Hence, the probabilityPpac(t)
2 : Calculation: ρ, T, CW and set Ppac(1)=ρ.
6 : For each number of sensors that has a packet to send 7 : For each contention window
8 : Calculate the successful probability by eq. (14).
9 : End for
10 : End for
5 : Calculate Ppac(t) by eq. (16) and Ppac(t)=min(Ppac(t),1). 1 : Initialization: N, λ, CWmin, CWmax and other parameters
4 : For each number of T
11: Calculate the transmission failed probability by eq. (17).
12: Calculate throughput in each T by eq. (19).
13: End for
14: Calculate throughput in each tn second by eq. (19). 3 : While (the throughput of system isn’t convergent).
15: End while
Figure 3The calculation method of system throughput with one user priority.
a packet to send and the backoff counter of at least two sensors is set as the smallest value.
Pfail(t)=
N
i=2
N
i Ppac(t)
i
1−Ppac(t) N−i
× ⎛ ⎝1−
W
W=1
i 1
1 W
W−W W
i−1⎞ ⎠.
(17)
Furthermore, in some scenarios, a sensor may have more than one packet to send and then the probability Ppac(t) is over one. In these scenarios, the data in the
newest packet is updated and the data in the other packets is outdated. Therefore, only the newest packet is remained to send; the other packets are deleted as the time-out packet, and then, the probabilityPpac(t)is redefined as
Ppac(t)=min(Ppac(t), 1), for all t. (18)
The system throughput aftertnseconds is changed as
ST(t) = Psuc(t)E[x] , (19)
S(tn) = tn
t=tn−nT ST(t).
4 Numerical evaluation
The system model is the same as mentioned above. The parameters summarized in Tables 1, 2, and 3 are used, and the calculation method of throughput is given in Figure 3. The algorithm stops when the throughput is convergent meaning the throughput attnthsecond is the same as the throughput attnth−1second.
The bandwidth frequency, the payload, the number of sensors, and Wmin are fixed as 2,360 to 2,483.5 MHz, 250 bytes, 20, and 16, respectively. The time-out is set as k = nT; it means the packet is discarded after 1 s. The
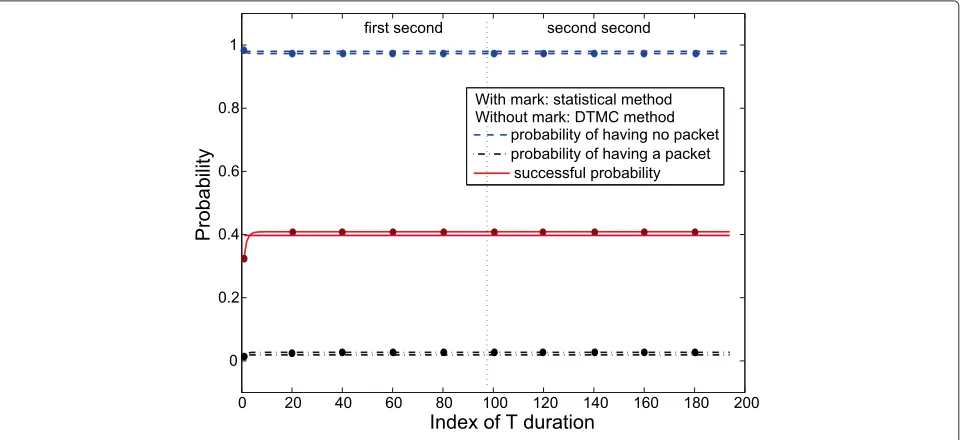
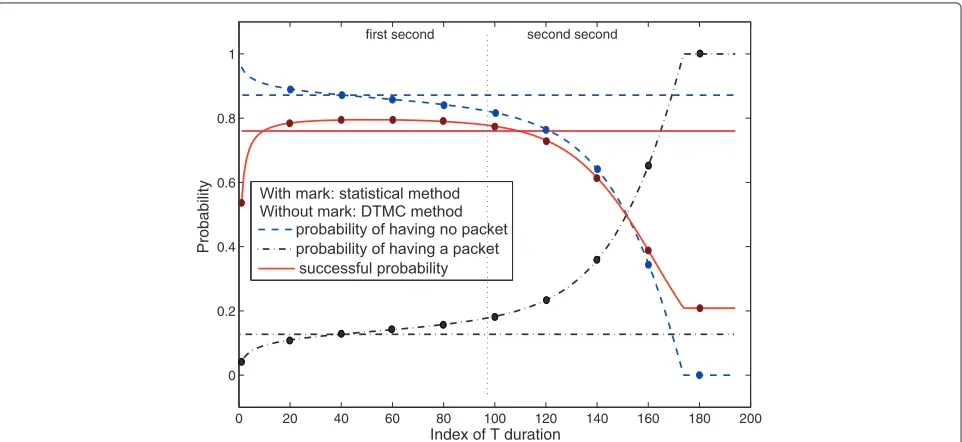
probability of having a packet to send and the probabil-ity of having no packet to send as well as the successful probability of eachTduration in cases the lambda is fixed as 2 and 10 packets/second are shown in Figures 4 and 5, respectively. The result of the DTMC method and the proposal method is compared in both figures.
As shown in Figure 4, when the lambda is small, the probability of having a packet to send is low, and then, the probabilities of having a packet to send and having
0 20 40 60 80 100 120 140 160 180 200
0 0.2 0.4 0.6 0.8 1
Index of T duration
Probability
probability of having no packet probability of having a packet
successful probability second second first second
With mark: statistical method Without mark: DTMC method
0 20 40 60 80 100 120 140 160 180 200 0
0.2 0.4 0.6 0.8 1
Index of T duration
Probability
first second second second
probability of having no packet probability of having a packet
successful probability With mark: statistical method Without mark: DTMC method
Figure 5The probability in eachTduration when the lambda = 10 packets/second.
no packet to send are constant after some T durations. Hence, the successful probability is fixed as the total prob-abilities of having a packet to send. This system model can be considered as the non-saturation model.
On the contrary, when the lambda is large (Figure 5), the probability of having a packet to send reaches 1 after some Tdurations. It means that all sensors always have a packet to send, and the successful probability is fixed as a low value due to the high transmission failed probability. This system model can be considered as the saturation model.
Compared to the DTMC method, the result of the pro-posal method in both the non-saturation (Figure 4) and saturation (Figure 5) models is almost the same.
Compare the successful probability of DTMC method in both cases, the lambda is 4 and 10 packets/second. The successful probability when the lambda is 4 packets/ second (Figure 6) is higher than that when the lambda is 10 packets/second (Figure 5). The reason is that the DTMC method does not consider the remained packet; therefore the probability of having a packet when the
0 20 40 60 80 100 120 140 160 180 200
0 0.2 0.4 0.6 0.8 1
Index of T duration
Probability
first second second second
probability of having no packet probability of having a packet
successful probability With mark: statistical method Without mark: DTMC method
0 100 200 300 400 500 600 0
0.1 0.2 0.3 0.4 0.5 0.6 0.7 0.8 0.9 1
Index of T duration
Successful probability
E[x]=50
E[x]=150 E[x]=100
Figure 7The change between three models when the lambda = 10 packets/section and the payload is changed.
lambda is 10 packets/second is higher, and then, the collision probability is higher. As a result, the success-ful probability is lower than that when the lambda is 4 packets/second.
However, for the proposed method, as shown in Figure 6, when the lambda is 4 packets/second, the prob-abilities are changed gradually. The probability of having a packet increases slowly and achieves one due to the effect of remained packet. Therefore, the successful prob-ability decreases after increasing and reaches the conver-gent probability when the probability of having a packet achieves one. It means the system model changes from the non-saturation model to the saturation model; this model is called as the time-saturation model. It is differ-ent to the saturation and the non-saturation models; in the time-saturation model, the result of the DTMC method and the proposal method is different. The reason can be explained that since the remained packet is not consid-ered in the DTMC method, the collision probability of DTMC method is low meaning the successful probability is high. However, in fact, the remained packet lets the col-lision probability increase and the successful probability decrease. Therefore, the proposal method that takes the remained packet into account is considered to be more accurate.
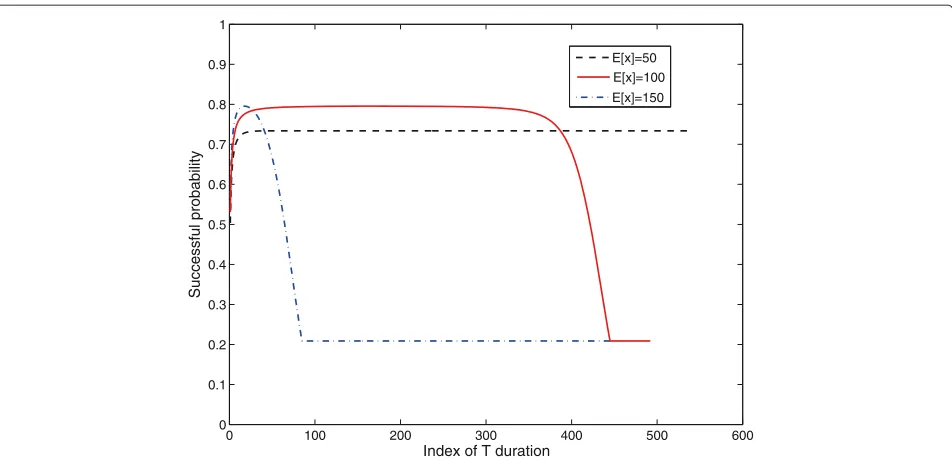
Furthermore, a system model can change between the saturation, the non-saturation, and the time-saturation models depending on the system parameters, such as the packet arrival rate, the payload, the retry limit, the num-ber of sensors, the UPs, and so on. Figure 7 shows the change between three models of system in which the lambda is fixed as 10 packets/second and the payload is
changed, i.e., 50, 100, and 150 bytes. When the payload is 50 bytes, the system model is the non-saturation model; however, when the payload increases to 150 bytes, the system model changes as the saturation model. Addition-ally, when the payload is 100 bytes, the system model acts as the time-saturation model. It means that a system can change between three models depending on the payload. Moreover, the time-saturation model can be considered as a connection model between the non-saturation and the saturation models.
Figure 8 shows the successful probability when the lambda is fixed as 4 and thekis changed, i.e.,nT, 16 and
0 50 100 150 200 0
0.1 0.2 0.3 0.4 0.5 0.6 0.7 0.8 0.9 1
Index of T duration
Successful probability
k=nT k=16 k= 8
8. When thekreduces, it means that the time-out of pack-ets is short; a system can change from the time-saturation model to the non-saturation model and has the higher successful probability.
5 Conclusions
In this paper, the term of time saturation has been defined and the new method has been proposed to ana-lyze system performance in saturation, non-saturation, and time-saturation models. Compared to the DTMC method, the result of the proposal statistical method is more accurate because of taking the remained packet into account. Moreover, the proposal method is more simple because the mathematical calculation is not nec-essary. The relation between non-saturation, saturation, and time-saturation models was analyzed, and the change between all models depending on the system parameters was described.
However, since the performance of non-saturation and saturation system has been analyzed in several literatures, in this paper, another object, such as delay, energy, and so on, was not considered. Furthermore, we proposed a new method for one user priority; the performance analysis of multiple user priorities is left to the future works.
Competing interests
The author declares that he has no competing interests.
Received: 2 December 2013 Accepted: 1 December 2014 Published: 11 December 2014
References
1. WG802.15 - Wireless Personal Area Network (WPAN) Working Group, IEEE standard 802.15.6, wireless body area networks. IEEE Standards.2, 1–271 (2012)
2. S Rezvani, A Ghorashi, A novel WBAN MAC protocol with improved energy consumption and data rate. KSII Trans. Internet Inf. Syst.
6, 2302–2322 (2012)
3. Y Kang, S Lim, C Kim, Design, analysis and implementation of energy-efficient broadcast MAC protocols for wireless sensor networks. KSII Trans. Internet Inf. Syst.5, 1113–1132 (2011)
4. S Ullah, H Higgins, B Braem, B Latre, C Blondia, I Moerman, S Saleem, Z Rahman, KS Kwak, A comprehensive survey of wireless body area networks: on PHY, MAC, and network layers solutions. J. Med. Syst.
36, 1065–1094 (2012)
5. M Chen, S Gonzalez, A Vasilakos, H Cao, VCM Leung, Body area networks: a survey. J. Mobile Netw. Appl.16, 171–193 (2011)
6. S Ullah, H Higgins, B Shen, KS Kwak, Body area networks: a survey. J. Commun. Syst.23, 982–999 (2010)
7. S Ullah, X An, K Kwak, Towards power efficient MAC protocol for in-body and on-body sensor networks. Agent Multi-Agent Syst. Technol. Appl.
5559, 335–345 (2009)
8. N Bradai, S Belhaj, L Chaari, L Kamoun, inProceedings of 4th Joint IFIP Wireless and Mobile Networking Conference (WMNC). Study of medium access mechanisms under IEEE 802.15.6 standard (University Toulouse III - Paul Sabatier Toulouse, France, 26–28 Oct 2011), pp. 1–6 9. F Martelli, C Buratti, R Verdone, inProceedings of European Wireless 2011,
Vienna, Austria. On the performance of an IEEE 802.15.6 wireless body area network (Vienna University of Technology, 27–29 April 2011) 10. KS Kwak, S Ullah, N Ullah, inProceedings of 3rd International Symposium on
Applied Sciences in Biomedical and Communication Technologies. An overview of IEEE 802.15.6 standard (University of Roma Rome, Italy, 7–10 Nov. 2010)
11. C Li, X Geng, J Yuan, T Sun, Performance analysis of IEEE 802.15.6 MAC protocol in beacon mode with superframes. KSII Trans. Internet Inf. Syst.
7, 1108–1130 (2013)
12. S Ullah, M Chen, KS Kwak, Throughput and delay analysis of IEEE 802.15.6-based CSMA/CA protocol. J. Med. Syst.36, 3875–3891 (2012) 13. S Ullah, KS Kwak, inProceedings of IEEE Wireless Communications and
Networking Conference, IEEE Communication Society. Throughput and delay limits of IEEE 802.15.6 (Cancun, Quintana Roo, Mexico, 28–31 Mar 2011), pp. 174–178
14. S Rashwand, J Misic, H Khazaei, inProceedings of IEEE Wireless
Communications and Networking Conference, IEEE Communication Society. Performance analysis of IEEE 802.15.6 under saturation condition and error-prone channel (Cancun, Quintana Roo, Mexico, 28–31 Mar 2011), pp. 1167–1172
15. S Rashwand, J Misic, H Khazaei, IEEE 802.15.6 under saturation: some problems to be expected. J. Commun. Netw.13, 142–148 (2011) 16. S Rashwand, J Misic, inProceedings of IEEE Global Telecommunications
Conference (GLOBECOM), IEEE Communication Society. Performance evaluation of IEEE 802.15.6 under non-saturation condition (Texas, USA, 5–9 Dec 2011)
17. S Rashwand, J Misic, Effects of access phases lengths on performance of IEEE 802.15.6 CSMA/CA. J. Comput. Netw.56, 2832–2846 (2012) 18. G Bianchi, Performance analysis of the IEEE 802.11 distributed
coordination function. J. Selected Areas Commun.18, 535–547 (2000) 19. Z Kong, DHK Tsang, B Bensaou, D Gao, Performance analysis of IEEE
802.11e contention-based channel access. J. Selected Areas Commun.
22, 2095–2106 (2004)
20. C Li, H Li, R Kohno, inProceedings of IEEE International Conference on Communications Workshops, IEEE Communication Society. Performance evaluation of IEEE 802.15.4 for wireless body area network (WBAN) (Dresden, Germany, 14–18 June 2009)
doi:10.1186/1687-1499-2014-221
Cite this article as:Thanh Hiep:Statistical method for performance
analysis of WBAN in time-saturation.EURASIP Journal on Wireless
Communications and Networking20142014:221.
Submit your manuscript to a
journal and benefi t from:
7Convenient online submission
7Rigorous peer review
7Immediate publication on acceptance
7Open access: articles freely available online
7High visibility within the fi eld
7Retaining the copyright to your article