R E S E A R C H
Open Access
Evaluation of chemosensitivity prediction using
quantitative dose
–
response curve classification
for highly advanced/relapsed gastric cancer
Teppei Matsuo
1,2, Satoshi S Nishizuka
1,2,3,4*, Kazushige Ishida
1,2, Fumitaka Endo
1,2, Hirokatsu Katagiri
1,2,
Kohei Kume
1,2,3,4, Miyuki Ikeda
1,2, Keisuke Koeda
2,3and Go Wakabayashi
2,3Abstract
Background:The use of standard chemotherapy regimens has changed the application of chemosensitivity tests from all chemotherapy-eligible patients to those who have failed standard chemotherapy, which includes patients with highly advanced, relapsed, or chemoresistant tumors.
Methods:We evaluated a total of 43 advanced primary and relapsed gastric cancers for chemosensitivity based on drug dose response curves to improve the objectivity and quality of quantitative measurements. The dose response curves were classified based on seven expected patterns. Instead of a binary chemosensitivity evaluation, we ranked drug sensitivity according to curve shapes and comparison with the peak plasma concentration (ppc) of each drug. Results:A total of 193 dose response curves were obtained. The overall informative rate was 67.4%, and 85.3% for cases that had a sufficient number of cells. Paclitaxel (PXL)and docetaxel tended to show a higher rank, while cisplatin (CIS) and 5-fluorouracil (5-FU) tended to show resistance, particularly among the 20 cases (46.5%) that had recurrent disease after receiving chemotherapy with CIS and S-1 (5-FU). As such, we speculate that the resistant pattern of the chemosensitivity test suggests that cells with acquired drug resistance were selected by
chemotherapy. Indeed, we observed a change in the chemosensitivity pattern of a sample before and after chemotherapy in terms of PXL sensitivity, which was used after primary chemotherapy.
Conclusions:These results suggest that: (i) the dose–response pattern provides objective information for predicting chemosensitivity; and (ii) chemotherapy may select resistant cancer cell populations as a result of the therapy.
Keywords:Gastric cancer, Chemosensitivity, Dose–response curves, Ascites
Background
Standard chemotherapy for gastric cancer is considered to have a significant treatment effect as evaluated by dis-ease free survival (DFS) and overall survival (OS) [1-3]. Postoperative chemoradiotherapy for gastric cancer was conducted in the United States with DFS and three-year OS rates of 48% and 50%, respectively [4]. In Europe and the United Kingdom, the result of the MAGIC trial for perioperative chemotherapy was also significant [5]. In Japan, verification of adjuvant chemotherapy with
S-1, an oral fluoropyrimidine, found an 80.1% three-year OS and 72.2% DFS, which is now the standard of care for postoperative Stage II/III patients [2]. However, des-pite the implementation of standard adjuvant chemo-therapy, the recurrence rate remains 30% to 40% within five years of therapy [2,5-7]. Hence, highly advanced chemo-naive primary cancers as well as relapsed tumors after adjuvant chemotherapy are major subjects for che-mosensitivity tests.
Most previous reports of chemosensitivity assays from the 1990s demonstrated the utility of cell-based assays to aid in the selection of drugs for treating advanced cancers [8-10]. This was useful information for clinicians because there was neither a consensus standard therapy nor large-scale clinical trials established for advanced * Correspondence:[email protected]
1
Laboratory of Molecular Therapeutics Iwate Medical University School of Medicine, 19-1 Uchimaru, Morioka, Iwate 020-8505, Japan
2
Department of Surgery Iwate Medical University School of Medicine, 19-1 Uchimaru, Morioka, Iwate 020-8505, Japan
Full list of author information is available at the end of the article
cancers. With the recent advances in well-controlled large-scale clinical trials, some standard therapies for advanced gastric cancer have been established [1-3]. Accordingly, the indications for chemosensitivity tests have changed in recent times because they are no longer urgently needed for selecting first line therapies. Therefore, the chemosen-sitivity test has become an approach that can determine appropriate drugs for patients whose treatments fail or who experience recurrence after standard therapies.
Rigid quantitation by conventional chemosensitivity as-says has been quite challenging because the number of available tumor cells from solid tumors is extremely lim-ited, which precludes the construction of drug dose– response curves from tumor cells [11,12]. The results from a limited number of data points may not be of suffi-cient quality for measuring the non-linear associations be-tween drug dose and cell viability. In the present study, chemosensitivity assays for gastric cancers are performed on samples obtained from highly advanced lesions, from which greater numbers of cells can be obtained compared
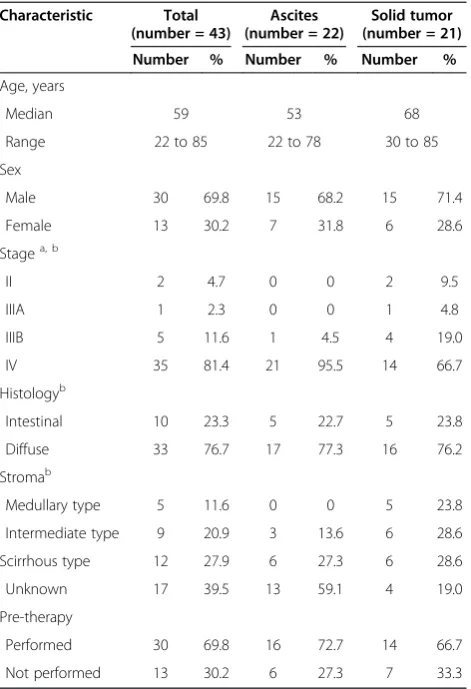
Table 1 Patient characteristics Characteristic Total
(number = 43)
Ascites (number = 22)
Solid tumor (number = 21)
Number % Number % Number %
Age, years
Median 59 53 68
Range 22 to 85 22 to 78 30 to 85
Sex
Male 30 69.8 15 68.2 15 71.4
Female 13 30.2 7 31.8 6 28.6
Stagea, b
II 2 4.7 0 0 2 9.5
IIIA 1 2.3 0 0 1 4.8
IIIB 5 11.6 1 4.5 4 19.0
IV 35 81.4 21 95.5 14 66.7
Histologyb
Intestinal 10 23.3 5 22.7 5 23.8
Diffuse 33 76.7 17 77.3 16 76.2
Stromab
Medullary type 5 11.6 0 0 5 23.8
Intermediate type 9 20.9 3 13.6 6 28.6
Scirrhous type 12 27.9 6 27.3 6 28.6
Unknown 17 39.5 13 59.1 4 19.0
Pre-therapy
Performed 30 69.8 16 72.7 14 66.7
Not performed 13 30.2 6 27.3 7 33.3
a
AJCC (American Joint Commettee on Cancer)/UICC (Union for International Cancer Control) classification.
b
Stages, Histology, and Stroma for Ascites are of the primary lesions.
A
B
Exponential
Hyperbola
Linear
Straight
Noise-dominant GI50
Logistic
PPC
C
to pre-operative or biopsy specimens, because these larger samples will not affect the definitive pathological diagno-sis. We consider the availability of a large number of cells to be a substantial advantage in terms of quantitative mea-surement of chemosensitivity.
Tumor cells from ascites are generally plentiful and seem to have greater viability in primary culture compared to cells from solid tumors. The availability of large numbers of tumor cells provides the opportunity to quantify tumor cell activity based on dose–response models. Hence, we conducted a chemosensitivity assay that employs tumor classification based on the patterns of dose response curves obtained from multiple drug concentration points derived from a sufficient number of tumor cells. Here we report the results of a chemosensitivity assay with a dose–response curve classification using specimens from highly advanced tumors, with special focus on tumor cells obtained from the ascites of patients with peritonitis carcinomatosa.
Methods
Patients
Forty-three gastric cancer patients who had either higher than stage II disease or a recurrence were reviewed (Table 1). Tumor samples were collected from patients after written informed consent was obtained according to Insti-tutional Review Board guidelines (H21-96, Iwate Medical University). The test was approved by the Advanced Me-dical Care categories of the Japanese Ministry of Labor and Welfare.
Samples
Specimens from 21 primary solid gastric tumors and 22 ascites samples from peritonitis carcinomatosa patients were obtained. Cells were immediately processed for the
chemosensitivity assay or stored at 4°C in serum-free RPMI 1640 medium with heparin for up to six hours.
For primary tumors, specimens were minced and incu-bated in an enzyme cocktail that included Hank’s balanced salt solution (Sigma-Aldrich Co. LLC, Tokyo, Japan), 7% sodium hydrogen carbonate (Otsuka Phar-maceutical Co. Ltd, Tokyo, Japan), collagenase (Yakult, Tokyo, Japan), deoxyribonuclease I, type IV (Sigma-Aldrich Co.), and protease type XXV (Sigma-(Sigma-Aldrich Co.), with rotation in a 37°C water bath for one hour until the cells were separated [10]. Cells obtained from ascites were centrifuged at 500 xgand the resulting cell pellet was then treated with a Ficoll gradient solution to separate the pellet into epithelial and non-epithelial cells (Figure 1). After these steps, both primary and ascites cells were counted and plated into a square flat-bottom 384 microtiter plate at a density of 5,000 to 10,000 cells/ well (450 to 900 cells/mm2) in serum-free RPMI 1640 in a total volume of 70μl. Cells were incubated for at least 24 hours before drug administration.
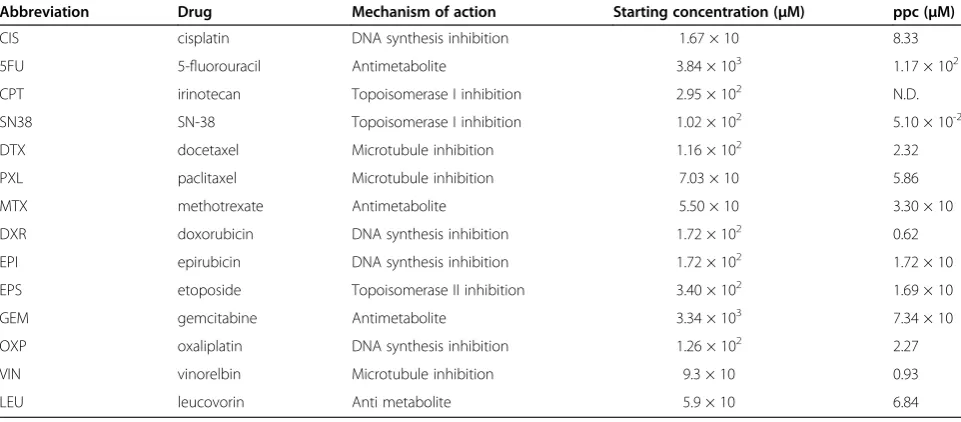
Anticancer agents
Fourteen anticancer agents were used in the assay (Table 2). The starting concentration of all drugs was 1% of the original vial (actual molar concentrations were different). Each drug was added in a 10-fold dilution series to confirm cell viability as a function of drug dose. The peak plasma concentration (ppc) was used as a reference in comparison with the 50% growth inhibitory concentration (GI50: concentration of a drug for which
growth is reduced by 50% compared to the untreated control) value, defined as the absorbance of water-soluble tetrazolium (WST) salt, (Dojindo, Mashiki, Japan) at which the growth was reduced by 50%
Table 2 Drugs used in chemosensitivity tests
Abbreviation Drug Mechanism of action Starting concentration (μM) ppc (μM)
CIS cisplatin DNA synthesis inhibition 1.67 × 10 8.33
5FU 5-fluorouracil Antimetabolite 3.84 × 10³ 1.17 × 10²
CPT irinotecan Topoisomerase I inhibition 2.95 × 10² N.D.
SN38 SN-38 Topoisomerase I inhibition 1.02 × 10² 5.10 × 10⁻²
DTX docetaxel Microtubule inhibition 1.16 × 10² 2.32
PXL paclitaxel Microtubule inhibition 7.03 × 10 5.86
MTX methotrexate Antimetabolite 5.50 × 10 3.30 × 10
DXR doxorubicin DNA synthesis inhibition 1.72 × 10² 0.62
EPI epirubicin DNA synthesis inhibition 1.72 × 10² 1.72 × 10
EPS etoposide Topoisomerase II inhibition 3.40 × 10² 1.69 × 10
GEM gemcitabine Antimetabolite 3.34 × 10³ 7.34 × 10
OXP oxaliplatin DNA synthesis inhibition 1.26 × 10² 2.27
VIN vinorelbin Microtubule inhibition 9.3 × 10 0.93
LEU leucovorin Anti metabolite 5.9 × 10 6.84
compared to the untreated control [13-15]. Each drug has a unique ppc value, which is the indicator for evalu-ating whether the effective drug concentration is achiev-able in the human body. If the ppc is greater than the GI50, then the drug is likely to affect cancer cell growth in vivo.
Growth suppression assay
After 24 hours of drug exposure, 10% medium volume (7 μl) of WST was added to each well of the primary culture and incubated for 3 to 6 hours at 37°C supplemen-ted with 5% CO2. Absorbance was measured at 450 nm
using a microplate reader (Tristar LB941, Berthold Tech-nologies GmbH & Co. KG, Bad Wildbad, Germany).
Interpretation of dose–response curves
To facilitate the objective interpretation of dose–response curves, we defined seven patterns that can be considered to reflect the respective biological properties of primary cultured cancer cells (Figure 2). When the curve is drug concentration-dependent in a logistic fashion, the GI50
can be readily calculated as a logistic pattern. When cell viability does not change across all concentrations except for a steep drop at the highest dose, it is considered ‘hyperbolic’, which is a good indicator of drug resistance. Other dose–response curves were eliminated from the chemosensitivity evaluation, but categorization facilitates diagnoses based on the curve-fitting concept. For logistic curves, the GI50 can be compared with the ppc of each
drug to determine the chemosensitivity rank. The rank is a relative ordering of the assay results in a given sample and provides an idea of which drug is likely to have effi-cacy towards the tumor. The curve fitting was performed using a non-linear multiple regression analysis with Prism software (Version 5.01, GraphPad Software, Inc., La Jolla, CA, USA).
Evaluation of chemotherapeutic effect
For those samples where related information was avai-lable, the chemotherapeutic effect on tumors in ascites was evaluated by tumor markers, ascites volume, and dietary intake. Although these evaluations are semi-quantitative and often subjective, they may still be in-formative in terms of the chemotherapeutic effect. The qualitative evaluation criteria for pre- and post-treatment tumor markers are as follows: Up, the marker value is beyond the upper limit of the normal range from within or below the normal range; Stable, the
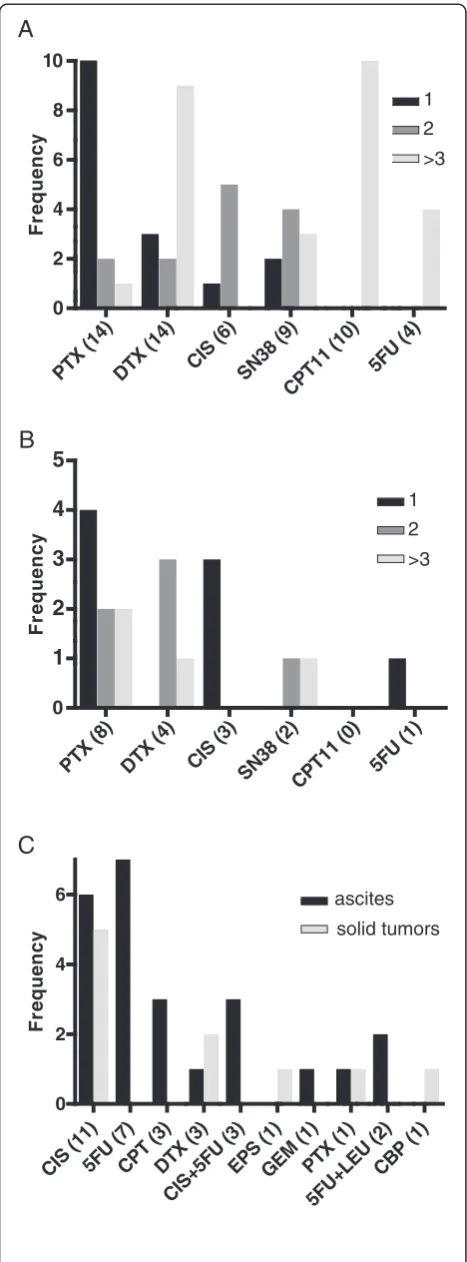
PTX
Figure 2Chemosensitivity rank. Frequency of drug expectation rank based on GI50.(A) Ascites and (B) Solid tumors. (C) Frequency
of drug resistance defined by a hyperbolic pattern of dose–response curves. GI50,concentration of a drug for which growth is reduced by
tumor marker value remains below the upper limit of the normal range; and Down, the marker value goes below the upper limit of the normal range from above the normal range. Ascites volume was classified into the following three groups: Up, Stable, and Down, which were evaluated based on comprehensive clinical findings including physical examination, ultrasonography, and computed tomography. Dietary intake was classified into Up, Stable, and Down categories by medical interview, impression of health professionals, and chart review.
Results
Chemosensitivity test
A total of 43 gastric cancer specimens, including 22 from ascites and 21 from solid tumors, were examined. A suffi-cient number of cells for the WST assay was obtained in 34/43 (79%) cases, of which 16/22 (72%) cases were from solid tumors and 18/21 (86%) were from ascites. Only one out of 16 (6%) ascites cases was not analyzed due to low viability, while four out of 18 (22%) solid tumors were not analyzed due to fungal contamination (two cases), bacter-ial contamination (one case), and low viability (one case). Cells from each tumor sample were plated into wells of a 384-well microtiter plate and subsequently assayed with 3 to 16 drugs individually, each of which provided a dose–
response curve. Overall, 29 samples produced 193 dose– response curves with one curve per drug per specimen (Table 3). In ascites cases, we obtained 110 curves from 15 cases (7.3 drugs per specimen) and for solid tumor cases, 83 curves from 14 cases (5.9 drugs per specimen).
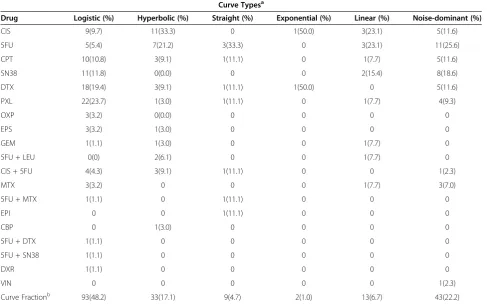
Interpretation of dose–response curve data
Each dose–response curve was categorized into one of the six previously determined patterns. Two major patterns (logistic and hyperbolic) represented 65% (126/193) of all patterns. Logistic and hyperbolic patterns are considered to be indicative of ‘drug-dependent cellular viability’and ‘drug resistance’, respectively. In fact, 24.2% of hyperbolic curves were from tumors that had been previously treated with the corresponding drug. While we did not use curves from other categories (67/193, 35%) for further analysis, they were useful for interpreting curves and in particu-lar helped minimize variations in interpretations by the examiner.
The curves were further evaluated to rank the drugs based on GI50 and ppc. From logistic curves, we
calcu-lated GI50values to represent how effective the drug was
on the cells. GI50 values from 93 logistic curves were
compared with the corresponding drug’s ppc. Eighty-one out of 93 (87%) curves showed that the ppc was greater
Table 3 Frequency of curve types
Curve Typesa
Drug Logistic (%) Hyperbolic (%) Straight (%) Exponential (%) Linear (%) Noise-dominant (%)
CIS 9(9.7) 11(33.3) 0 1(50.0) 3(23.1) 5(11.6)
5FU 5(5.4) 7(21.2) 3(33.3) 0 3(23.1) 11(25.6)
CPT 10(10.8) 3(9.1) 1(11.1) 0 1(7.7) 5(11.6)
SN38 11(11.8) 0(0.0) 0 0 2(15.4) 8(18.6)
DTX 18(19.4) 3(9.1) 1(11.1) 1(50.0) 0 5(11.6)
PXL 22(23.7) 1(3.0) 1(11.1) 0 1(7.7) 4(9.3)
OXP 3(3.2) 0(0.0) 0 0 0 0
EPS 3(3.2) 1(3.0) 0 0 0 0
GEM 1(1.1) 1(3.0) 0 0 1(7.7) 0
5FU + LEU 0(0) 2(6.1) 0 0 1(7.7) 0
CIS + 5FU 4(4.3) 3(9.1) 1(11.1) 0 0 1(2.3)
MTX 3(3.2) 0 0 0 1(7.7) 3(7.0)
5FU + MTX 1(1.1) 0 1(11.1) 0 0 0
EPI 0 0 1(11.1) 0 0 0
CBP 0 1(3.0) 0 0 0 0
5FU + DTX 1(1.1) 0 0 0 0 0
5FU + SN38 1(1.1) 0 0 0 0 0
DXR 1(1.1) 0 0 0 0 0
VIN 0 0 0 0 0 1(2.3)
Curve Fractionb 93(48.2) 33(17.1) 9(4.7) 2(1.0) 13(6.7) 43(22.2)
a
% indicates fraction per curve type;b
than the GI50. Based on the fact that the greater the
dif-ference between the ppc and GI50, the better the chance
that the drug is effective, we ranked the set of drugs used for each assay.
Although the number of drugs tested for one sample was inconsistent because the number of available cells varied, paclitaxel (PXL) seemed to be most effective (rank, 1), followed by docetaxel (DTX) (rank, 2) and cis-platin (CIS) (rank, 3; Figure 3A and B). PXL showed the highest average rank (rank, 1.29) for ascites (Figure 3A) while CIS (rank, 1; Figure 3B) was the highest for solid tumors.
Patient outcomes and chemosensitivity test
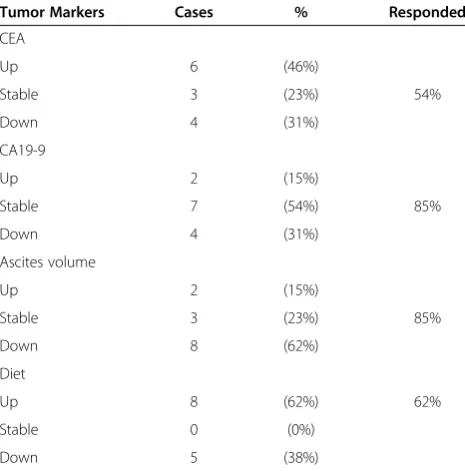
The number of evaluable cases was 15 for ascites. Two out of the 15 cases were eliminated because of a marked de-cline in general condition. The remaining 13 cases pro-ceeded to systemic chemotherapy based on the results of the chemosensitivity test. Thus, all chemosensitivity eva-luations for 13 cases were based on drugs with a rank of 1 or 2 (Table 4). Tumor markers were decreased or stable in 7/13 (54%) and 11/13 (86%) patients for carcinoembryonic antigen (CEA) and cancer antigen 19–9 (CA19-9), respect-ively. Ascites volume showed a substantial decrease or remained stable in 11/13 (85%) cases, indicating that asci-tes volume may be one of the most immediately
responsive markers in highly advanced cases. Although dietary intake is less objective than other parameters, increased intake for 8/13 (62%) cases suggests a direct as-sociation with the reduction of gastrointestinal burden and minimum adverse effects by the selected chemotherapy.
Replacement of cellular population after chemotherapy Although the number is limited, we had a pair of sam-ples for which the patient received two chemosensitivity tests, pre- and post-chemotherapy. Case GC-022 showed CIS resistance (hyperbolic), while PXL ranked first in the first chemosensitivity assay at pre-chemotherapy. As-cites volume was increased nine weeks after completion of six cycles of 80 mg/m2 PXL weekly. A subsequent chemosensitivity assay (GC-025) on ascites demon-strated a more than five-fold increase in GI50 PXL, but
they remained resistant to CIS (Figure 3).
Discussion
The utility of cell-based assays for evaluating chemosen-sitivity depends on the quality of the quantitative pro-cesses, because the number of cells, replicates, and dilution series are critical for obtaining good measure-ment quality [8-10]. The 384-well microtiter plate used in the present study requires 5,000 to 10,000 cells per well, which allowed us to assess the differences and
75
similarities in drug responses using multiple drug dose points. The drug concentration-cell growth (that is, dose–response) curve is generally not linear, and ideally should be logistic. To evaluate drug sensitivity, the curve must show a logistic curve that is considered to be a pharmacological drug response [12,15]. We confirmed that hyperbolic dose–response curves are a sufficient in-dicator of drug resistance. Other curve types do not dir-ectly indicate any clinical applications, but did help with assay evaluation by multiple examiners in daily practice.
We determined the chemosensitivity rank based on re-sponse expectancy instead of binary nominal sensitivity (that is, sensitive or non-sensitive) [8-10]. Although the rank depends on how many drugs are tested in a given assay, PXL seems to be the most frequently highly-ranked drug. CIS and 5-FU (that is, S-1, an oral fluoro-pyrimidine), which had been the first choice for highly advanced gastric cancer chemotherapy, seemed to have lower ranks in post-treatment tumors, implying that the tumors may have acquired drug resistance during pri-mary chemotherapy. In pripri-mary chemo-naive tumors, however, CIS showed good sensitivity, suggesting that CIS is a reasonable choice as a first line drug for primary tumors, as most regimens include this drug.
Although the number of cases is still limited, one of the major benefits of the present approach is the ability to see population changes in cancer cells at different time points for a given patient. For instance, GC-022 and GC-025 are samples from a patient who was treated with six cycles of 80 mg/m2PXL weekly and showed a five-fold increase in GI50 values for PXL, while
remaining resistant to CIS. It is reasonable to speculate that the acquisition of drug resistance would be due to changes in the tumor cell population [14]. Recent reports demonstrated that genome-wide genetic and epi-genetic events accumulate during cancer progression [16]. Therefore, the phenotypic change we observed in the present case suggests that drug-induced phenotypic or genetic/epigenetic changes occurred during our rou-tine cancer therapies [14].
The response rate of standard cancer therapies is still generally around 30% to 40% [1-3]. To determine stand-ard therapies based on tumors of origin through epigen-etic studies, large-scale clinical trials are important. However, continued efforts are necessary to minimize the fraction of patients who would not benefit from the standard therapy as well as to provide justification for each type of therapy. The biological properties of cancer cells are often drastically different depending on each patient, so treatments should be flexible based on tumor characteristics. Patients with ascites have very poor life expectancy from the date of diagnosis and many fail ei-ther standard or oei-ther subsequent ei-therapies [17]. Our chemotherapeutic response expectation rankings suggest that it would be possible to make better drug choices that may prolong survival and significantly decrease the cancer burden for these patients [11].
Conclusions
Our chemosensitivity assay is still a conventional cell-based technique. However, the assay can more accurately determine appropriate drug regimens based on the tumor response to drugs using a currently available and reliable technique with a sufficient number of tumor cells. The chemosensitivity assay is more applicable to many types of chemotherapeutic drugs. Our present data provide clues for profiling individual tumors based on functional drug response information. As such, data ac-cumulation and acquisition of supporting molecular evi-dence is warranted.
Abbreviations
CA19-9: cancer antigen 19–9; CEA: carcinoembryonic antigen; CIS: cisplatin; CPT: irinotecan; DFS: disease free survival; DXR: doxorubicin; DTX: docetaxel; EPI: epirubicin; EPS: etoposide; GEM: gemcitabine; GI50: 50% growth inhibitory concentration; LEU: leucovorin; MTX: methotrexate; N.D.: not determined; OS: overall survival; OXP: oxaliplatin; ppc: peak plasma concentration; PXL: paclitaxel; SN38: SN-38; VIN: vinorelbin; WST: water-soluble tetrazolium; 5FU: 5-fluorouracil.
Competing interests
The authors declare that they have no competing interests.
Authors’contributions
TM carried out the chemosensitivity assay and drafted the manuscript; SSN carried out the experimental design and drafted the manuscript; KI carried out the chemosensitivity assay and experimental design; FE carried out the chemosensitivity assay; HK carried out the chemosensitivity assay; KKu carried out the chemosensitivity assay; MI carried out the chemosensitivity assay and experimental design; KKo carried out the experimental design; GW carried
Table 4 Evaluation of chemotherapy by tumor marker, ascites volume, diet
Tumor Markers Cases % Responded
out the experimental design. All authors read and approved the final manuscript.
Acknowledgements
Funding: Keiryokai Collaborative Research Support (SSN); Grant-in-Aid for Scientific Research(C) (11863286) (SSN), and (12877914) (KKo)
Author details
1
Laboratory of Molecular Therapeutics Iwate Medical University School of Medicine, 19-1 Uchimaru, Morioka, Iwate 020-8505, Japan.2Department of Surgery Iwate Medical University School of Medicine, 19-1 Uchimaru, Morioka, Iwate 020-8505, Japan.3MIAST (Medical Innovation by Advanced Science and Technology) Program, Iwate Medical University School of Medicine, 19-1 Uchimaru, Morioka, Iwate 020-8505, Japan.4Institute for Biomedical Sciences, Iwate Medical University, 2-1-1 Nishitokuta, Yahaba, Iwate 028-3694, Japan.
Received: 1 September 2012 Accepted: 6 January 2013 Published: 22 January 2013
References
1. Narahara H, Iishi H, Imamura H, Tsuburaya A, Chin K, Imamoto H, Esaki T, Furukawa H, Hamada C, Sakata Y:Randomized phase III study comparing the efficacy and safety of irinotecan plus S-1 with S-1 alone as first-line treatment for advanced gastric cancer (study GC0301/TOP-002).
Gastric Cancer2011,14:72–80.
2. Sakuramoto S, Sasako M, Yamaguchi T, Kinoshita T, Fujii M, Nashimoto A, Furukawa H, Nakajima T, Ohashi Y, Imamura H, Higashino M, Yamamura Y, Kurita A, Arai K:Adjuvant chemotherapy for gastric cancer with S-1, an oral fluoropyrimidine.N Engl J Med2007,357:1810–1820.
3. Thuss-Patience PC, Kretzschmar A, Dogan Y, Rothmann F, Blau I, Schwaner I, Breithaupt K, Bichev D, Grothoff M, Grieser C, Reichardt P:Docetaxel and capecitabine for advanced gastric cancer: investigating dose-dependent efficacy in two patient cohorts.Br J Cancer2011,105:505–512.
4. Macdonald JS, Smalley SR, Benedetti J, Hundahl SA, Estes NC, Stemmermann GN, Haller DG, Ajani JA, Gunderson LL, Jessup JM, Martenson JA:Chemoradiotherapy after surgery compared with surgery alone for adenocarcinoma of the stomach or gastroesophageal junction.
N Engl J Med2001,345:725–730.
5. Cunningham D, Allum WH, Stenning SP, Thompson JN, Van de Velde CJ, Nicolson M, Scarffe JH, Lofts FJ, Falk SJ, Iveson TJ, Smith DB, Langley RE, Verma M, Weeden S, Chua YJ, MAGIC Trial Participants:Perioperative chemotherapy versus surgery alone for resectable gastroesophageal cancer.N Engl J Med2006,355:11–20.
6. Sasako M, Sakuramoto S, Katai H, Kinoshita T, Furukawa H, Yamaguchi T, Nashimoto A, Fujii M, Nakajima T, Ohashi Y:Five-year outcomes of a randomized phase III trial comparing adjuvant chemotherapy with S-1 versus surgery alone in stage II or III gastric cancer.J Clin Oncol2011, 29:4387–4393.
7. Nashimoto A, Nakajima T, Furukawa H, Kitamura M, Kinoshita T, Yamamura Y, Sasako M, Kunii Y, Motohashi H, Yamamoto S:Randomized trial of adjuvant chemotherapy with mitomycin, Fluorouracil, and Cytosine arabinoside followed by oral Fluorouracil in serosa-negative gastric cancer: Japan Clinical Oncology Group 9206–1.J Clin Oncol2003, 21:2282–2287.
8. Furukawa T, Kubota T, Watanabe M, Takahara T, Yamaguchi H, Takeuchi T, Kase S, Kodaira S, Ishibiki K, Kitajima M,et al:High in vitro-in vivo correlation of drug response using sponge-gel-supported three-dimensional histoculture and the MTT end point.Int J Cancer1992, 51:489–498.
9. Hoffman RM:In vitro sensitivity assays in cancer: a review, analysis, and prognosis.J Clin Lab Anal1991,5:133–143.
10. Kawamura H, Ikeda K, Takiyama I, Terashima M:The usefulness of the ATP assay with serum-free culture for chemosensitivity testing of gastrointestinal cancer.Eur J Cancer1997,33:960–966.
11. Kubota T, Sasano N, Abe O, Nakao I, Kawamura E, Saito T, Endo M, Kimura K, Demura H, Sasano H,et al:Potential of the histoculture drug-response assay to contribute to cancer patient survival.Clin Cancer Res1995, 1:1537–1543.
12. Yoshimasu T, Oura S, Hirai I, Tamaki T, Kokawa Y, Ota F, Nakamura R, Shimizu Y, Kawago M, Hirai Y, Naito K, Kiyoi M, Tanino H, Okamura Y,
Furukawa T:In vitro evaluation of dose–response curve for paclitaxel in breast cancer.Breast Cancer2007,14:401–405.
13. Arteaga CL, Forseth BJ, Clark GM, Von Hoff DD:A radiometric method for evaluation of chemotherapy sensitivity: results of screening a panel of human breast cancer cell lines.Cancer Res1987,47:6248–6253. 14. Agarwal R, Kaye SB:Ovarian cancer: strategies for overcoming resistance
to chemotherapy.Nat Rev Cancer2003,3:502–516.
15. Richter L, Ruckert U, Kramer S:Learning a predictive model for growth inhibition from the NCI DTP human tumor cell line screening data: does gene expression make a difference?Pac Symp Biocomput2006, :596–607. 16. Kim K, Chun KH, Suh PG, Kim IH:Alterations in cell proliferation related
gene expressions in gastric cancer.Crit Rev Eukaryot Gene Expr2011, 21:237–254.
17. Koizumi W, Narahara H, Hara T, Takagane A, Akiya T, Takagi M, Miyashita K, Nishizaki T, Kobayashi O, Takiyama W, Toh Y, Nagaie T, Takagi S, Yamamura Y, Yanaoka K, Orita H, Takeuchi M:S-1 plus cisplatin versus S-1 alone for first-line treatment of advanced gastric cancer (SPIRITS trial): a phase III trial.Lancet Oncol2008,9:215–221.
doi:10.1186/1477-7819-11-11
Cite this article as:Matsuoet al.:Evaluation of chemosensitivity prediction using quantitative dose–response curve classification for highly advanced/relapsed gastric cancer.World Journal of Surgical Oncology201311:11.
Submit your next manuscript to BioMed Central and take full advantage of:
• Convenient online submission
• Thorough peer review
• No space constraints or color figure charges
• Immediate publication on acceptance
• Inclusion in PubMed, CAS, Scopus and Google Scholar
• Research which is freely available for redistribution