ABSTRACT
BOBAY, BENJAMIN GRANT. Molecular and Structural Characterization of
Global Transition State Regulators AbrB and Abh from
Bacillus subtilis.
(Under the direction of John Cavanagh.)
Molecular and Structural Characterization of Global Transition State
Regulators AbrB and Abh from Bacillus subtilis
by
Benjamin Grant Bobay
A dissertation submitted to the Graduate Faculty of North Carolina State University
in partial fulfillment of the requirement for the Degree of Doctor of Philosophy
Molecular and Structural Biochemistry
Raleigh, North Carolina 2004
Approved by:
_________________________ __________________________ Chair of Advisory Committee Dr. A. Clay Clark
Dr. John Cavanagh
Dedication
Biography
Acknowledgements
For all that have supported me on this long and arduous journey, Thank You! The following is and by no means an all inclusive acknowledgement of those who have contributed in some manner to my successful graduate career, in no particular order. I sincerely apologize for any negligent omissions.
Dr. John Cavanagh: To the man that took a chance on a “B” average student, I thank you. You pushed me to the edge of the cliff of success but without ever letting me fall. I have accomplished so much more than I ever thought possible.
Richele Thompson: To the one person that has taught me so much more in life than science. Your guidance and support throughout all of my life endeavors has shown me that life is bigger than science.
Douglas Kojetin: Mr. “I have a script to do that”, while it may have taken more time to write the script than it would have to analyze the data directly, you have taught me a significant amount!
Dr. A. Clay Clark: Thank you for all your support, guidance and a chance to work with your outstanding group!
Dr. Michael B. Goshe: Thank you for all the opportunities yet to come. I hope that I can make you as proud of me as John is. Post doc here I come!
My committee: Particularly Dr. William Miller and Dr. Charles Opperman: There is a forest through the trees, thank you for showing me that.
Dr. Ron Venters: Without your guidance and knowledge of NMR I would still be sitting down and trying to figure out what a peptide bond is.
Dr. Geoffrey Mueller: Thank you for all your help and support through all of my structure calculations, none of this would have been possible without you!
Dr. Stephen Naylor: I remember you taught me one valuable lesson at Newts; “there is always time to discuss science, let’s get this guy to buy us a beer …” Remember?
Erin Regel: I can not say enough. No words would justify the level of support you have given me. Thank you, for always being there and supporting and disagreeing (sometimes) with all the decisions that I have made.
Mom: All that I ever wanted from you is to be proud of me! You raised me, nurtured me and gave me the tools to prove to me that anything is possible. Thank you, you truly are an inspiration!
Dad: I told you that I had a chance to move to North Carolina, before I gave you the reason why you told me “MOVE”. I think that the reason and the outcome were worth it!
My Family: Thank you for supporting me and giving me the time to myself to complete my dream.
Table of Contents
Page
List of tables ……….………... xiii
List of figures ……….…... xvi
List of symbols or abbreviations ……….…….... xxii
Chapter 1: Introduction ………...……….…… 1-14 Bacillus subtilis, sporulation and transition state regulators ….. 1
Chapter 2: DNA-Binding Propensity of the Global Transition State Regulator AbrB ………...……….…….. 15-44 Abstract …………..……….…... 15
Introduction ………..……….…. 16
Results ……….…... 17
Microelectrospray mass spectrometry ……….…... 17
Circular Dichroism ……….……….…... 21
Tyrosine Fluorescence Emission Spectrophotometry .... 24
UV Spectroscopy ……….………...………... 26
DNA Modeling ……….……...………... 28
Page
Materials and methods ….………….………..……... 43
Chapter 3: Refinement of the solution state structure of AbrBN from Bacillus subtilis ……….………. 45-62 Abstract …………..……….…... 45
Introduction ………..……….………. 46
Results ……….……... 48
Heteronuclear multidimensional NMR ..……… 48
Structure calculations ……….…… 50
Discussion ..……….…... 53
Basic residues involved in DNA binding ..……….…… 54
Residues involved in multimerization ...………….…… 57
Electrostatic Surface of AbrBN ……...……...….…… 57
Materials and methods ….………….………..……... 60
Structure calculations ……….…… 61
Chapter 4: Site-specific Mutations and the Consequences: A Closer Look into AbrB’s Regulation ……….. 63-84 Abstract …………..……….…... 63
Introduction ………..……….………. 64
Results ……….……... 67
Page
Mutational Data ……….. 68
Computational bioinformatics ……… 74
AbrB Bacillus anthracis ………. 78
Discussion ..……….... 80
Materials and methods ….………….………..……... 83
Chapter 5: Solution Structure of the DNA-binding Domain of the Transition State Regulator Abh from Bacillus subtilis ……… 85-93 Abstract …………..……….…... 85
Introduction ………..……….………. 86
Results ……….……... 86
Heteronuclear multidimensional NMR ……….. 87
Structure calculations ………. 88
Discussion ..……….... 89
Basic residues involved in DNA binding ..……….…… 91
Residues involved in multimerization ...………….…… 91
Materials and methods ….………….………..……... 92
Structure calculations ………. 93
Chapter 6: Conclusion ……...………...……… 94-98 Overall conclusions and future work ………. 94
Page
AbrB N-terminal ………..……….………. 96
Abh N-terminal ………..….……... 97
Appendix A: Nuclear Magnetic Resonance ..……….………... 99-122 Theory ………...………. 99
Three’s company ……….……...……….……... 104
Application …….………..……….………. 108
Assigning Resonances to Protein Nuclei …………..…………. 112
Secondary Structure Assignment ……...……….……... 114
Determining distances between nuclei ……….……….………. 115
Determining dihedral angles …….………..…………..………. 116
Determining hydrogen bonds ...….………..…………..………. 117
Simulated Annealing ………..……..………..….……... 118
Dimers ……...………..……... 119
Assessment of Quality of NMR structures ……….…...………. 120
Appendix B: Mass Spectrometry ………....………... 123-134 Theory ………...………. 123
Ion sources ……..……….……...………….……... 124
Mass analyzers …...……..……….………. 127
Page Appendix C: Spectrophotometric Techniques ..……….………... 135-152
Circular Dichroism …….…………...………. 135
Theory ………...………. 135
Fluorescence …….………..………...………. 139
Theory ………...………. 140
UV ………...…….………..………...………. 145
Theory ………...………. 145
Appendix D: Molecular Modeling of DNA ……….………... 153-156 Theory …………...…….…………...………. 153
Structural parameters of DNA …...………. 154
Appendix E: Materials and Methods ..………..…….………... 157-172 Protein Expression and Purification ………..………. 157
Construction of AbrBFL Bacillus subtilis construct ….. 157
Expression and Purification of AbrBFL Bacillus subtilis ……...…...………….………. 158
Expression and Purification of AbrBFL Bacillus anthracis …....…...………….………. 159
Expression and Purification of AbrBN Bacillus subtilis 160 Construction of pET21b-AbhN construct ………….. 161
Page
DNA ………... 163
Technique based protocols ………....………. 164
Nuclear Magnetic Resonance spectroscopy …………... 164
Ambiguous Restraints for Iterative Assignment (ARIA) …………..…...…….………. 165
Mass Spectrometry …...…….………. 169
Circular Dichroism ………. 169
Tyrosine Fluorescence Emission ……….……... 170
UV Spectroscopy …...…….………...……. 171
Molecular Modeling of DNA ………. 171
Appendix F: AbrBN Chemical Shift..……….………... 173-186
Appendix G: AbhN Chemical Shift……….………... 187-198
List of tables
Page Chapter 1: Introduction ………...……….…… 1-14 Table 1.1 Mutational Data for AbrB …………...…….….……. 9
Chapter 2: DNA-Binding Propensity of the Global Transition State
Regulator AbrB ………...……….…….. 15-44
Table 2.1 DNA Sequences ………...……...…….….……. 19-20 Table 2.2 Affinity constants ………...…...…….….……. 28 Table 2.3 Promoter sequences used in modeling studies ……... 29-32
Table 2.4 Patterns of Intrinsic DNA Parameters for the
oligonucleotides used in AbrB and AbrBN binding studies …. 33
Chapter 3: Refinement of the solution state structure of AbrBN from
Bacillus subtilis ……….………. 45-62
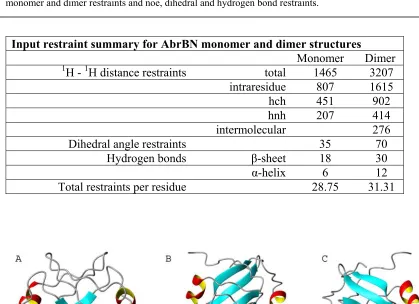
Table 3.1 Aria statistics for the structure ensembles ….…...…. 50-51 Table 3.2 Input restraint summary of AbrBN monomer and
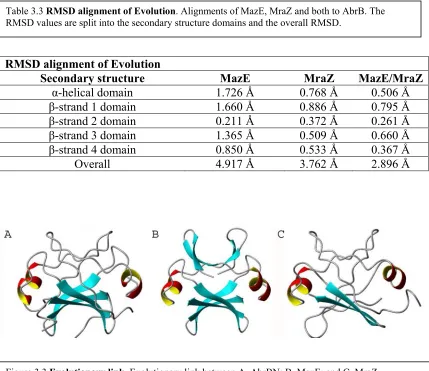
dimer structures ………...………...…...…….….……. 52 Table 3.3 RMSD alignment of Evolution ….…….………...…. 53
Chapter 4: Site-specific Mutations and the Consequences: A Closer Look
Page Table 4.1 Known AbrB structural distances …………..…...…. 68 Table 4.2 AbrBN Mutants ….………...…...…….….……. 70-72
Chapter 5: Solution Structure of the DNA-binding Domain of the Transition
State Regulator Abh from Bacillus subtilis ……… 85-93
None ……….…………..…...…. - - -
Chapter 6: Conclusion ……...………...……… 94-98 None ……….…………..…...…. - - -
Appendix A: Nuclear Magnetic Resonance ..……….………... 99-122 None ……….…………..…...…. - - -
Appendix B: Mass Spectrometry ………....………... 123-134 None ……….…………..…...….
-Appendix C: Spectrophotometric Techniques ..……….………... 135-152 None ……….…………..…...….
Page Appendix E: Materials and Methods ..………..…….………... 157-172
Table E.1 Synthesized oligonucleotides …...…………..…...…. 164 Table E.2 Aria statistics for the structure ensembles .………… 167-168
Appendix F: AbrBN Chemical Shift..……….………... 173-186 Table F.1 AbrBN Chemical Shift ...……….…………..…...…. 173
Appendix G: AbhN Chemical Shift……….………... 187-198 Table G.1 AbhN Chemical Shift ….……….…………..…...…. 187
References ………...…...………...……… 199-213
-List of figures
Page Chapter 1: Introduction ………...……….…… 1-14
Figure 1.1 Seven stages of sporulation ……….….……. 3
Figure 1.2 Phosphorelay of regulation ……….….……. 4
Figure 1.3 Known transition state regulators ……….….... 5
Figure 1.4 Alignment of AbrB and Abh …….……….…... 7
Figure 1.5. Schematic representation AbrB homotetramer ………..……….…... 8
Chapter 2: DNA-Binding Propensity of the Global Transition State Regulator AbrB ………...……….…….. 15-44 Figure 2.1 µESI mass spectrum of AbrB and AbrBN …...……. 18
Figure 2.2 µESI mass spectrum of AbrB incubated with the natural target DNA promoter sequences .……….….……. 20
Figure 2.3 µESI mass spectrum of AbrBN incubated with the natural target DNA promoter sequences ……….…... 21
Figure 2.4 Near and far UV circular dichroism spectra of DNA and protein-DNA complexes ……….….……….…... 23
Figure 2.5 Difference plot of AbrB/DNA CD data ………….... 24
Page Figure 2.7 UV spectroscopy titration of sinIR ……….….……. 27
Figure 2.8 Molecular modeling of all known DNA binding
promoters of AbrB ………...…... 34
Chapter 3: Refinement of the solution state structure of AbrBN from
Bacillus subtilis ……….………. 45-62
Figure 3.1 Hydrogen exchange data ………... 49 Figure 3.2 AbrBN structure ……….………... 52 Figure 3.3 Evolutionary link ……….………. 53 Figure 3.4 Basic residues involved in DNA binding ………….. 56 Figure 3.5 Surface electrostatic of the AbrBN structure …….... 58 Figure 3.6 Dynamic data plotted on AbrBN ..………..….……. 58 Figure 3.7 Electrostatics of evolution ………..……….….……. 59
Chapter 4: Site-specific Mutations and the Consequences: A Closer Look
into AbrB’s Regulation ……….. 63-84
Page Figure 4.7 Types of protein/DNA interactions …….…….……. 75 Figure 4.8 Interactions of amino acids and base step ……....…. 76 Figure 4.9 Detailed look at arginine and threonine ……...……. 77 Figure 4.10 Overlaid spectra ………....……...….….……. 79
Chapter 5: Solution Structure of the DNA-binding Domain of the Transition
State Regulator Abh from Bacillus subtilis ……… 85-93
Figure 5.1 Secondary and tertiary structures …….……..……... 87 Figure 5.2 Sequence alignment AbrB and Abh .…..…………... 89
Chapter 6: Conclusion ……...………...……… 94-98 None ………..…..…………...
-Appendix A: Nuclear Magnetic Resonance ..……….………... 99-122 Figure A.1 Energy transition between α and β states …..……... 99 Figure A.2 Equilibrium state inside NMR ………... 100 Figure A.3 Boltzman distribution .……..…….………... 101 Figure A.4 Applying a rf pulse .………...…. 102 Figure A.5 From the vector model to a Fourier transformed
FID ……….. 104
Page Figure A.8 Schematic drawing of the use of distance
constraints for the determination of the 3-D structure of
biological macromolecules ……….………….………... 108
Figure A.9 1D, 2D and 3D NMR ……….……...……..…. 109
Figure A.10 Resolution of a 2D to 3D ………….……….. 110
Figure A.11 HNCA pulse sequence ……….………..….... 112
Figure A.12 Triple resonance experiments .………….……….. 113
Figure A.13 Strategy of structure determination by NMR …... 122
Appendix B: Mass Spectrometry ………....………... 123-134 Figure B.1 Mass spectrometry ion formation ..……....……..…. 123
Figure B.2 Electrospray setup .…...……….……... 125
Figure B.3 Development of Taylor cone .…...……….... 127
Figure B.4 Example of protein mass spectrum .………..……... 128
Appendix C: Spectrophotometric Techniques ..……….………... 135-152 Figure C.1E and B polarized light ………….………….……... 136
Figure C.2 Linear vs. circular ……….……….……... 137
Figure C.3 Example CD spectra ....…….……….……... 139
Figure C.4 Fluorescence emission spectra of native and unfolded procaspase-3(C163S) and pro-less variant ..….……... 140
Page Figure C.6 Schematic representation of a fluorescence
spectrophotometer …………...…...……….……... 142 Figure C.7 Aromatic amino acids ..……….……….……... 145 Figure C.8 Full electromagnetic spectrum linear scale ...……... 146 Figure C.9 Rotational and vibrational aspects ...….…….……... 147 Figure C.10 Electronic transitions .………….………….……... 147 Figure C.11 Double-beam UV-Vis Spectrophotometer ……... 149 Figure C.12 Monochromator schematic ....…….……….……... 151
Appendix D: Molecular Modeling of DNA ……….………... 153-156 Figure D.1 Pictorial definitions of rigid body parameters used
to describe the geometry of complementary (or non-
complementary) base pairs and sequential base pair steps ..…... 155 Figure D.2 Top and side views illustrating the characteristic
features of regular helical structures of A, B, C and Z DNA
deduced from representative X-ray fiber diffraction models …. 156
Appendix E: Materials and Methods ..………..…….………... 157-172 None ………..…..…………...
Page Appendix G: AbhN Chemical Shift……….………... 187-198 None ………..…..…………...
-References ………...…...………...……… 199-213
-List of symbols or abbreviations
Chapter 1: Introduction
Antibiotic Resistance Protein B (AbrB)
Antibiotic Resistance Protein B N-terminal Domain (AbrBN) Antibiotic Resistance Protein H (Abh)
Antibiotic Resistance Protein H N-terminal Domain (AbhN) Circular Dichroism (CD)
Dinucleotide acid (DNA)
Microelectrospray Ionization Mass Spectrometry (µESI-MS) Nuclear Magnetic Resonance (NMR)
Sporulation Stage V Protein T (SpoVT) Ultraviolet spectroscopy (UV)
Chapter 2: DNA-Binding Propensity of the Global Transition State Regulator AbrB Antibiotic Resistance Protein B (AbrB)
Antibiotic Resistance Protein B N-terminal Domain (AbrBN) Circular Dichroism (CD)
Dinucleotide acid (DNA)
Microelectrospray Ionization Mass Spectrometry (µESI-MS) Nuclear Magnetic Resonance (NMR)
Ultraviolet spectroscopy (UV)
Chapter 3: Refinement of the solution state structure of AbrBN from
Bacillus subtilis
Ambiguous Restraints for Iterative Assignment (ARIA) Antibiotic Resistance Protein B (AbrB)
Antibiotic Resistance Protein B N-terminal Domain (AbrBN) Carbon Nitrogen Nuclear Overhauser Effect Spectroscopy Hetero-nuclear single quantum coherence (CN-NOESY- HSQC)
Cell Division And Cell Wall Biosynthesis Protein Upf0040 (MraZ)
Chemical Shift Indices (CSI)
Crystallography & NMR System (CNS) Dinucleotide acid (DNA)
Nuclear Magnetic Resonance (NMR) Nuclear Overhauser Enhancement (NOE) PemI-like protein 1 (MazE)
PemI-like protein 1 (MraZ)
Torsion Angle Likelihood Obtained from Shift and sequence similarity (TALOS)
Chapter 4: Site-specific Mutations and the Consequences: A Closer Look into AbrB’s Regulation
Antibiotic Resistance Protein B N-terminal Domain (AbrBN) Dinucleotide acid (DNA)
Chapter 5: Solution Structure of the DNA-binding Domain of the Transition State Regulator Abh from Bacillus subtilis
Ambiguous Restraints for Iterative Assignment (ARIA) Antibiotic Resistance Protein H (Abh)
Antibiotic Resistance Protein H N-terminal Domain (AbhN) Carbon Nitrogen Nuclear Overhauser Effect Spectroscopy Hetero-nuclear single quantum coherence (CN-NOESY- HSQC)
Chemical Shift Indices (CSI)
Crystallography & NMR System (CNS) Dinucleotide acid (DNA)
Nuclear Magnetic Resonance (NMR) Nuclear Overhauser Enhancement (NOE)
Torsion Angle Likelihood Obtained from Shift and sequence similarity (TALOS)
Chapter 6: Conclusion
Antibiotic Resistance Protein B (AbrB)
Antibiotic Resistance Protein H N-terminal Domain (AbhN) Dinucleotide acid (DNA)
Appendix A: Nuclear Magnetic Resonance Free Induction Decay (FID)
Nuclear Magnetic Resonance (NMR) Nuclear Overhauser Enhancement (NOE)
Appendix B: Mass Spectrometry Daltons (Da) Thompson (Th)
Micro-Electrospray ionization (µESI) Nano-Electrospray ionization (nESI)
Appendix C: Spectrophotometric Techniques Circular Dichroism (CD) Photomultiplier tube (PMT)
Appendix D: Molecular Modeling of DNA None
Appendix E: Materials and Methods
(AEBSF)
Ambiguous Restraints for Iterative Assignment (ARIA) Antibiotic Resistance Protein B (AbrB)
Antibiotic Resistance Protein B N-terminal Domain (AbrBN) Antibiotic Resistance Protein H (Abh)
Antibiotic Resistance Protein H N-terminal Domain (AbhN) Carbon Nitrogen Nuclear Overhauser Effect Spectroscopy Hetero-nuclear single quantum coherence (CN-NOESY- HSQC)
Chemical Shift Indices (CSI)
Crystallography & NMR System (CNS) Dinucleotide acid (DNA)
Issopropyl- -D-thiogalactopyranoside (IPTG) Nuclear Magnetic Resonance (NMR)
Nuclear Overhauser Enhancement (NOE)
Position-And-Time Resolved Ion Counter array detector (PATRIC)
Torsion Angle Likelihood Obtained from Shift and sequence similarity (TALOS)
Appendix G: AbhN Chemical Shift None
References
Chapter 1: Introduction
Bacillus subtilis, a soil bacterium thriving in decaying vegetation, is one of the most thoroughly characterized organisms in terms of its physiology, genetics and biochemistry. Consequently it serves as an excellent model system for protein structure-function studies. Here nuclear magnetic resonance (NMR), microelectrospray ionization mass spectrometry (µESI-MS) and mutagenesis methods are employed in a complementary fashion to begin elucidating the structure-function relationships for a class of proteins from B. subtilis referred to as transition state regulators, with particular attention paid to the properties of the protein AbrB.
Initially a general background and introduction to B. subtilis and the relation of the transition state regulator proteins to the life cycle of the bacterium is presented. This is then followed by results and discussion sections, detailing the specific studies undertaken and the conclusions reached. Finally, a comprehensive Appendix is provided covering the basic theory and applications of the main bioanalytical platform technologies employed throughout: NMR (primary technique used for probing structure and function relationships), µESI-MS, circular dichroism spectroscopy (CD), fluorescence spectroscopy, ultra-violet spectroscopy (UV) and mutagenesis studies were used to complement those studies performed.
defined DNA segments, primarily located around promoter sequences, have profound effects on this gene expression and viability. Transcription factors lie at the center of gene regulation,and their identification is crucial to the understanding oftranscription and gene expression. In response to a multitude of environmental stimuli, proteins orchestrate expression of the genes for appropriate adaptation response(s) [1-32]. The key to bacterial adaptability and survival lies in their capacity to initiate the appropriate response at the appropriate time for a specific situation. Such situations include: changes in chemical concentrations, temperature, osmolarity, viscosity, light, pH, density and exposure to anti-infectives. Transcriptional regulation synthesis peaks upon sensing environments that become hostile. A shift from exponential growth phase to a stationary phase prepares a cell for survival by expression of bacterial protection genes. Accordingly, bacterial responses also have numerous forms, e.g. the secretion of toxins, polymer degrading enzymes, antibiotics or complete physiological transformations [1, 25, 33]. In this final illustration, bacteria can undergo cellular differentiation leading to the development of highly resistant endospores. Spores are perhaps the ultimate line of bacterial defense, being extremely resistant to heat, sunlight, chemicals and drugs.
accurately represented between stages 0 and 1 (Figure 1.1). In response to a distinct signal, a signal transduction pathway, referred to as a phosphorelay, is formed (Figure 1.2) [34-40]. Initially, a specific sensor kinase, KinA, becomes phosphorylated on a conserved histidine residue [41-46]. The phosphoryl group is then transferred into a conserved aspartyl (Asp) pocket in the regulatory domain of a response regulator (Spo0F). The combination of a sensor kinase and a response regulator is known as a two-component system. The phosphoryl group is then passed to a histidine on a phosphotransferase (Spo0B) and finally to the Asp pocket in another response regulator (Spo0A) which becomes activated. This product represses the production of transition state regulator proteins and the system then enters the sporulation cycle [10, 47-54] .
Transition state regulators have a unique role in cellular development and protection. Transition state regulators are present anywhere there is a decision to be made, i.e., synthesis of motility, competence, sporulation etc. genes. There are two ways a bacterium can accomplish this: (i) express thousands of proteins to regulate thousands of pathways – or – (ii) expression of a distinct subset of proteins (transition state regulators) to regulate a multitude of genes. The former would require excess energy and resources to produce the large amount of proteins to carry out this function; this is obviously detrimental to energy conservation of the bacterium. The latter approach allows for control of a variety of genes and processes with the least amount of energy and resources used. Further defining unique characteristic of the transition regulatory family is the fact they do not bind to each other promoters. There are certainly different stages within the sporulation process (Figure 1.1) and in each of these stages transition state regulators seem to exist.
At this time, about 30 transition state regulators have been definitely or potentially
halodurans, B. halodurans C-215, B. lichemformis, B. cersus, B. thuringiensis serovar
israelensis, Clostridium beijerinckii, C. acetobutylicum, C. difficile, C. perfringens,
Escherichia coli, Geobacillus stearothermophilus, Listeria innocua, Listeria
monocytogenes EGD e, Sulfolobus solfataricum P2, Staphylococcus xylosus,
Streptococcus mutans, Streptococcus thermophilus, Streptococcus bovis, Streptococcus
pyogenes, Pyrococcus hirokoshi, Thermoanaerobacter tengcongens, and Pasteuria penetrans.
B. subtilis regulatory proteins active during the transition state have only recently been given recognition as a definable family. The transition state regulator family is divided
into two general classes. Transition-state repressor proteins prevent the expression of genes unnecessary or even detrimental to the cell when trying to cope with sub-optimal conditions. Transition state activator proteins target genes with products vital to survival during post-exponential growth, including metabolic alternatives and sporulation genes [55-57].
One such transition state protein, in the latter group, has been characterized, antibiotic resistance protein (AbrB) from the gram-positive model organism B. subtilis [23, 54, 56-92]. The N-terminus and the full length AbrB protein was analyzed for sequence homology to any other known and hypothetical proteins. The results were multifold. Several protein sequences displayed similarity and identity in the higher percentages, 50% or higher (Figure 1.3). AbrB has been found to have homologous sequences in a plethora of organisms including, B. subtilis, B. anthracis, B. stearothermophilus, B. halodurans, B. halodurans C-215, B. lichemformis, B. cersus, B. thuringiensis serovar
israelensis, C. acetobutylicum, C. difficile, C. perfringens, G. stearothermophilus, L.
innocua, L. monocytogenes EGD e, S. solfataricum P2, P. hirokoshi, T. tengcongens, and
P. penetrans.
AbrB and Abh from B. subtilis. The proteins show identity of 56.38 %, strong similarity of 22.34 %, weak similarity of 8.51 % and dissimilarity of 12.77 %. Alignment of just the N-terminal residues 1-53, result in identity of 69.81%, strong similarity of 18.87%, weak similarity of 5.66% and dissimilarity of 5.66%. Furthermore, Abh has been identified in a few of organisms; B. subtilis, B. halodurans, B. halodurans C-215. With more genome sequences being established, the prevalence of Abh as a transition state regulator will become apparent.
Although much effort has resulted in broad genetic characterization of global transition state regulators in B. subtilis, little is known about their molecular mechanisms of action. Early biochemical analysis of AbrB was thought to be a hexamer in solution of identical 94 residue, 10.5 kDa monomeric subunits [58, 75, 93, 94]. Models were constructed based on the fact that the multimerization state was a hexamer and that the C-terminal domains were solely responsible for the multimerization. However, recent published
observations confirm that AbrB is actually tetrameric in solution [95-97]. Furthermore, such publications have shown that the N-terminal domain is responsible for DNA binding and multimerization. AbrB monomeric subunits are divided into two functional domains. The N-terminal domain contains the DNA binding domains. While the C-terminal domain contains a potential helix-turn-helix sequence originally proposed to be important for protein multimerization but not DNA binding. Organization of the subunits is shown in Figure 1.5.
Protein mutational analysis has expanded the understanding of the molecular controls driving the interaction between AbrB and known binding promoter regions. Deletion-mutant analyses of the C-terminus showed that the overall solution size of AbrB was severely affected, yet DNA-binding was still substantial. Other site-specific mutations in the C-terminal domain also resulted in smaller solution sizes that still retained significant DNA-binding capacity. Mutational analysis of the N-terminal domain showed two mutations at positions R23 and R24 resulted in a wild-type solution size that displayed no affinity for target DNA sites [98, 99]. A mutation at position C54 was
anomalous in that both the solution size and DNA-binding affinity were severely altered. AbrB mutants consisting of residues 1-53 showed a decrease of ~1000 fold in affinity for natural DNA promoters. However, constructs with residues 1-55 and a disulfide bond between cysteines at the 54 position (the only cysteine in wild-type AbrB) restored wild-type affinity for natural promoter sequences [100]. Thus, residues 1-53 are designated as the DNA-binding domain and 54-94 as the multimerization domain (Table 1.1).
Table 1.1 Mutational Data for AbrB
Mutation Expected Size Expected DNA affinity Reason for reduction
R8A/L Wild type large decrease Reduced recognition
R15A/L Wild type large decrease Reduced recognition
R23A/S Wild type none/large decrease Reduced recognition
R24A/S Wild type none/large decrease Reduced recognition
C54L Non-wild type none Loss of multimerization ability
The transition state regulator AbrB is known to control the expression of over 60 different genes nominally expressed or repressed in suboptimal environments [23, 54, 56-91]. This broad regulatory control is regarded as the defining quality of transition-state regulators. However, with this broad regulatory control comes a unique paradox to the historic protein:DNA paradigm. AbrB’s know DNA binding targets share no consensus base-pairing sequence. Furthermore, AbrB is known to bind promiscuously, with high but differing affinities, to a multitude of these very promoters.
DNase 1 footprint analysis on target sites recognized by AbrB display no obvious consensus [101-107]. Furthermore, the extent of the protected footprint regions is largely variable, ranging from 30 to 125 base pairs. However, these protected regions are specifically targeted according to several lines of evidence. First, the promoter regions of genes, generally in the +1 region, are bound. Second, AbrB exhibits high affinity (low nM Kd’s), even in the presence of excess competitor DNA. Third, methylation protection and hydroxy-radical footprint experiments show that binding is occurring on one side of the DNA sequence [108]. Lastly, although no consensus sequence is apparent among natural target promoters, regions high in A+T content are preferred. This last point is of interest in that at first it suggested some level of conformational flexibility in DNA may be important for recognition and binding. Indeed, some promoters do display varying degrees of bending and thus potentially different 3D structures [105].
residues involved in multimerization and DNA binding. However, to this point this model is still incomplete, since it only accounts for AbrB being completely promiscuous in its DNA-binding. The topology of the DNA-binding domain in conjunction with the aforementioned flexibility allows for the reorientation of the DNA-binding α-helices such that any three-dimensional DNA structure represents a potential binding target. However, we know this not be the case. Although AbrB manifests broad DNA-binding properties it does display degrees of specificity. It binds to its cognate promoters with a range of affinities and there are, of course, promoters that it does not bind to at all, see Chapter 2.
One significant part of this dissertation deals with the refinement of the AbrB N-terminal domain, in light of recent advancements in the definition of the multimerization domains. This refined structure, along with a combination of mutational data has helped better define not only residues involved in binding and multimerization but also a clearer understanding of the specific interactions with the DNA. Another part of this dissertation focuses on the nature of the DNA targets themselves and assists in defining how AbrB selects DNA targets with promiscuity but yet in a specific manner.
dependent manner (personal communication – Dr. Mark A. Strauch). Abh has binding affinity towards some of the in vitro selected aptamers that were previously selected for high affinity binding by AbrB [102]. DNase1 footprints of Abh binding are very similar to that of AbrB footprints, but different slightly in the appearance of regions protected. The pH optimum for Abh is very sharp, and is centered on pH 7-7.2. The AbrB optimum is quite broad and the broad peak extends from around pH 8 to above pH 10. Both proteins have about the same low activity below pH7. AbrB begins to rise at pH 7 to reach the beginning of its plateau at pH8. As mentioned above, Abh also rises in activity going from pH 6.8 to 7.0 but then drops off rather than continuing to rise. While these data are promising, plenty of subsequent experiments are needed before a precise mode of regulation can be mapped out for Abh. Obtaining DNA binding sequences for Abh and noting their commonality or disagreement with those of AbrB will go a long way to help discern what structural components of the protein and DNA make that particular system unique.
sequence similarity equate to structure similarity? And how do these proteins bind a multitude of genes while not binding to each others?
The existence of transition state regulators that share little conserved DNA-binding sequences creates a specificity paradox in transcriptional regulation. This paradox includes: How does each transcription factor select the correct subset of binding sites to achieve its proper function? Conversely, how is the correct protein selected to regulate different sets of target genes that carry out distinctive biological effects? The members of the global transition state regulator family recognize a multitude of binding sequences, which allows for many potential binding sites in a genome with considerable degeneracy. Moreover, many members of a family may be co-expressed in the same cell at the same time. Nevertheless, to this point there has been a site specific sequence found that AbrB,
Abh and SpoVT (a putative σG-dependent promoter) genes share in common. These
observations suggest that there may exist subtle differences in DNA binding potential to avoid a redundant role in regulation. NMR, µESI-MS and several other spectrophotmetric techniques were used to investigate this promiscuity.
Although genetic, biochemical, and structural analyses yielded insights into the general function of global transition state regulators, these studies were unable to provide a satisfactory mechanistic scheme for how transition state regulators are able to interact specifically with a disparate array of promoter regions. To explore the apparent binding promiscuity of the global transition state regulator family, NMR, molecular modeling and
several other spectrophotometric techniques. AbrB’s binding promiscuity was explored through µESI-MS by examining the multimerization states of AbrB and AbrBN as well as the properties of protein:DNA complexes. Through µESI-MS, a hierarchy of binding affinity was established. To obtain a more accurate description of affinity, solution phase UV spectroscopy was utilized to examine the affinity between the protein/DNA complexes. The DNA promoter sequences were characterized through CD, fluorescence and molecular modeling examined oligonucleotide properties that may contribute to the specificity. These results, when combined with known biochemical and genetic data, highlight several important features that may contribute to global transition state regulator/DNA discrimination and recognition.
Chapter 2: DNA-Binding Propensity of the Global
Transition State Regulator AbrB
The work in this chapter was performed in collaboration with Brett Feneey, Dr. A. Clay Clark, Dr. Michael B Goshe of North Carolina State University and Dr. Mark A Strauch of the University of Maryland.
ABSTRACT
Global transition state regulator proteins represent one of the most diverse classes of prokaryotic transcription factors. One such transition state regulator, AbrB from Bacillus subtilis, is known to bind over 60 gene targets yet displays specificity within this target set by binding each promoter with a different affinity. Microelectrospray ionization-mass spectrometry (µESI-MS), circular dichroism, fluorescence, UV spectroscopy and molecular modeling were used to elucidate differences between AbrB, DNA and AbrB-DNA complexes. µESI-MS analysis of AbrB confirmed its stable macromolecular state as tetrameric and verified the same stoichiometric state in complex with DNA targets.
understanding of transition state regulator-DNA binding properties and structural tendencies of target promoters, this comprehensive and corroborative spectroscopic study endorses the use of µESI-MS for rapidly ascertaining qualitative binding trends in non-covalent systems in a high throughput manner.
[116] . Therefore, solution phase affinity constant determination was accomplished through UV spectroscopy.
RESULTS
Micro-electrospray mass-spectrometry
The multimeric state of AbrB was also examined using µESI-MS and reveals a population of monomeric, dimeric and tetrameric species, as shown in Figure 2.1C and 2.1D. Monomeric and dimeric AbrB species determined through µESI-MS are expected artifacts of the transition from the liquid to gas phases during the µESI-MS process [96, 117, 118]. The charge state envelope range from m/z 2000 to 3500 composed of charge states of +6 to +10 for the dimeric species (“D”) and +12 to +15 for the tetramer (“T”) (Figure 2.1C). Deconvultion of peaks corresponding to tetramers provide a molecular mass of 41,972 Da, respectively (expected 41,976 Da). The same multimeric states were observed for AbrB in the negative-ion mode (Figure 2.1D). The tetramer is the highest
Figure 2.2 shows the negative-ion mode µESI-MS spectra resulting from the incubation and subsequent complexation of AbrB with a series of natural known promoter sequences in a 2:1 ratio (Table 2.1). Figure 2.3 shows the negative-ion mode µESI-MS spectra resulting from the incubation and subsequent complexation of AbrBN with the same series of natural known promoter sequences in a 2:1 ratio. Complex formed between AbrB-sinIR and AbrBN-sinIR provided a molecular weight consistent with tetrameric AbrB and dimeric AbrBN binding to one DNA molecule [96, 117, 119]. These same stoichiometries of binding are observed for all observed protein-DNA complexes examined with the exception of the negative control DNA, for which no binding was observed in any case. Examining the relative intensities of complex peaks to unbound protein and DNA, relative binding affinities can be ascertained: sinIR >> spo0E > BS18 >
TGGNA3 > TGGNA1 >> negative control (no binding). Data not shown for TGGNA3 and TGGNA1.
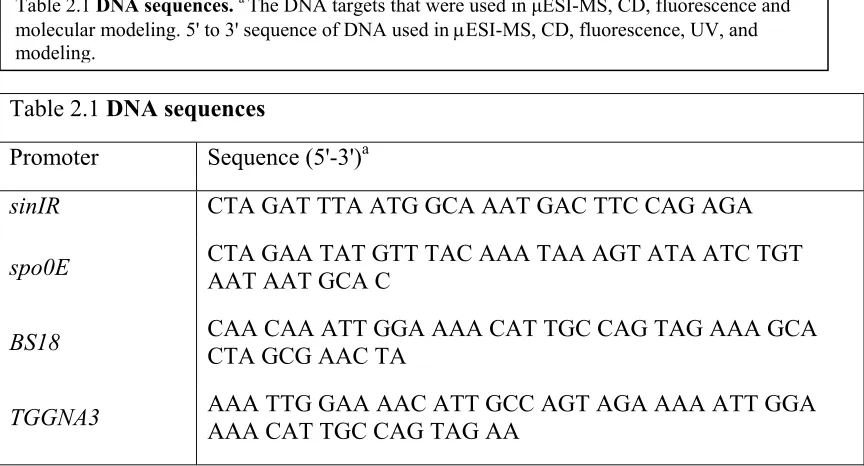
Table 2.1 DNA sequences
Promoter Sequence (5'-3')a
sinIR CTA GAT TTA ATG GCA AAT GAC TTC CAG AGA
spo0E CTA GAA TAT GTT TAC AAA TAA AGT ATA ATC TGT AAT AAT GCA C
BS18 CAA CAA ATT GGA AAA CAT TGC CAG TAG AAA GCA CTA GCG AAC TA
TGGNA3 AAA TTG GAA AAC ATT GCC AGT AGA AAA ATT GGA
AAA CAT TGC CAG TAG AA
Table 2.1 DNA sequences.a The DNA targets that were used in µESI-MS, CD, fluorescence and
TGGNA1 TAT GGG AGT TAT ACC ATG TTT TAT GGG AGT TAT ACC ATC TTT
Negative Control TAC TAC TGC TGA GCC CGG TAC TTA CTG CTG AGC CCG G
Figure 2.2. µESI mass spectrum of AbrB incubated with the natural target DNA promoter sequences. Negative-ion spectrum of 40 µM AbrB incubated with 20 µM of each DNA promoter sequence. A, sinIR; B, spoE; C, BS18; D, negative control oligonucleotides. “C” correspond to fully complexed tetrameric AbrB + DNA, broad peaks in the baseline correspond to unbound DNA, while peaks marked with a “P” correspond to unbound protein, charge states as indicated.
Circular Dichroism. CD of AbrB and AbrBN was monitored in the far UV spectrum. Far UV analysis for AbrB and AbrBN furnish spectra that are consistent with a protein containing characteristics of both α-helix and β-sheet, with two unequal minima at approximately 208 nm and 219 nm (data not shown). Figure 2.4 shows the results from CD studies of DNA alone and of AbrB/AbrBN-DNA complexes. All wavelength scans were performed from 190 nm to 320 nm. Figure 2.4A shows data for DNA only, with Figure 2.4B as an expansion of the region 200 nm to 230 nm. Maxima and minima at 275 nm and 245 nm, respectively, indicate a structure of B-DNA [120]. The structure of the DNA was greatly influenced upon binding AbrBN (Figure 2.4C and 2.4D) and AbrB
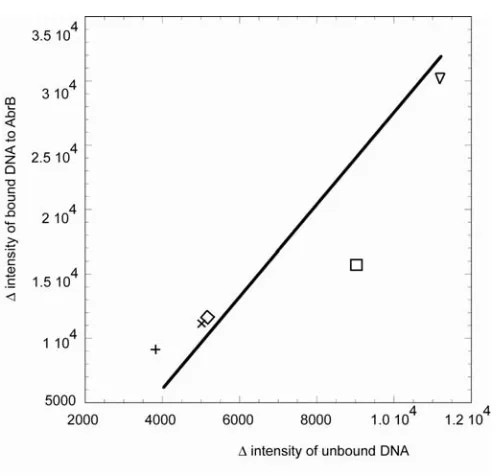
(Figure 2.4E and 2.4F). Intensities changed across the entire spectrum, but monitoring at ~215 nm (maximum for sinIR) a recognizable trend for the protein-DNA binding is discernible. A difference plot, the difference in intensity at ~215 nm for each oligonucleotide from the intensity of the negative control in its unbound and bound state, shows the same hierarchy of binding as seen in the µESI-MS studies (Figure 2.5). The relative changes in intensity at ~215 nm upon AbrB and AbrBN binding ranks the DNA:
sinIR >> spo0E > BS18 > TGGNA3 > TGGNA1 >> negative control (no binding), the same order as seen in µESI-MS. CD experiments were performed in the same buffer as the µESI-MS studies, as well as TRIS buffer, to make certain no contributions to binding or conformational changes were induced by the buffer. Furthermore all CD experiments were performed with or without MgCl2 to ensure no ionic cofactor is needed for binding;
Figure 2.4. Near and far UV circular dichroism spectra of DNA and protein-DNA complexes.
Tyrosine Fluorescence Emission Spectrophotometry. AbrB has two tyrosine residues, at positions 37 and 48, both in the N-terminal DNA-binding domain. The protein has no phenylalanine or tryptophan residues. Tyrosine fluorescence emission spectra following excitation at 275 nm are superimposable for each protein for the pH range from 6.0 to 8.5 (Figure 2.6A). Also investigated were MgCl2 (0.100 µM – 0.200 mM) titrations and in
ammonium bicarbonate and TRIS buffer, to confirm no factor is need for or induces changes in conformation or binding. The titrations showed no difference in spectra, congruent with CD titrations (data not shown). Relative fluorescence levels decrease, approximately two fold (2.5x10⁻⁶ to 1.25x10⁻⁶), for AbrB compared to AbrBN.
Fluorescence emission spectra for the DNA titrations are similar for both AbrB and AbrBN protein samples. A relative strength of interaction identical to the order observed in the µESI-MS and CD studies appeared at 345 nm. As µESI-MS and CD suggested that
sinIR is the strongest binder, normalization of the intensity of the spectra at 345 nm with respect to sinIR revealed the same relative order of binding for AbrB and AbrBN. spo0E,
UV spectroscopy. UV spectroscopy was used to determine solution phase dissociation constants for AbrB-DNA complexes. These Kd’s are listed in Table 2.2 along with
Figure 2.6. Fluorescence emission spectrum of AbrB and AbrBN.Experiments were performed in 10 mM TRIS-HCl, 10 mM KCl, 1 mM EDTA, and 1 mM DTT at pH 7.5 or 10 mM NH4HCO3 at
allowed for the deduction of binding trends in the titration of DNA with protein. Dissociation constants were determined by varying the protein concentration while holding the DNA concentration constant. Protein contributions to the spectra were subtracted out to reveal structural information regarding changes upon binding only from the DNA. Kd determination waslimited by the ability to observe structural changes solely
attributed to the DNA, as more protein was titrated to the samples, due to spectral dominance by the protein, therefore trends were observed only for three of the six DNA promoters. Changes in absorbance, as seen in Figure 2.7, were then fit to equation [2.1] and the dissociation constants were averaged over 6 scans.
Figure 2.7. UV spectroscopy titration of sinIR. Each type of symbol and style of line represent one
titration of six of AbrB to sinIR. Lines where globally fitted to equation [1]. Then averaged Kd’s are
DNA Modeling. Table 2.3 lists all the sequences modeled along with specifics about the interaction with AbrB while table 2.4 list all the modeled parameters of intrinsic DNA topology pertaining to AbrB binding and recognition. To establish differences in binding of AbrB to DNA, specific helical parameters were determined through X3DNA [122]. Minor groove length, propeller twist, opening, and stretch, as well as a multitude of other structural parameters, were examined. Rotational structural components of DNA are described by the parameters propeller twist and opening. Propeller twist is the angle of rotation between adjacent nucleotides in the non-nucleotide plane. Opening is the angle in adjacent nucleotides in the nucleotide plane. The translational structural component of DNA is represented by the parameter stretch. Stretch is the distance between adjacent binding nucleotides.
Solution Dissociation Constantsa
Promoter Kdb (nM) Kdc (nM) Kdd (nM) Kde (nM)
sinIR 0.75 ± 0.15 - - - - - - 28-200
spo0E 3.3 ± 0.90 300 - - - 6-23
BS18 >40 30 4 - - -
TGGNA 3 N/De - - - - - - - - -
TGGNA 1 N/De - - - - - - - - -
Negative control - - - - - - - - - - - -
Table 2.2. Affinity constants. Kd determination of AbrB using UV spectroscopy compared to known
dissociation constants. a Solution phase K
d determination was accomplished to clarify previous reports of
gel shift assay measurements that may have had the equilibrium process perturbed by separation of bound and free components. b this work. c Xu K, Strauch MA (2001) J Bacteriol. 183(13):4094-8. d Xu K,
Known natural AbrB DNA targets used in modeling studiesa
Promoters Regualtionb Absolute Positionc Locationd Target Binding Sequence Referencee
abrB Negative 45219 - 45248 -43:-14 CAAAATGATTGACGATTATTGGAAACCTTG 23
aprE Negative 1105085 - 1105157 -59:+15 AAAATCATCTCAAAAAAATGGGTCTACTAAAATATT 23
ATTCCATCTATTACAATAAATTCACAGAATAGTCTTT
bsuB1 ND ND -60:-10 GAAAAGTACCAGCAGGGTTTATTGTGTT 22
--AATCATTACAAAAAATGATAAA
comK Negative 1116464 - 1116583 ND CATTAAATATCATTAAAAGATGATTTTATCTT 14
AAATGTTAAAAAAACCTGTCGTTTTACAAAAA
CAGATGATAGATTATTAGTATAAATTTTGCAG
AAAAAGGATGGAGGCCATAATATG
dppA Negative 1359815 - 1359848 -16:+18 TTTAATATAATTTGTTAGAATATTCATAATTTAG 24
Table 2.3. Promoter sequences used in modeling studies. Known AbrB binding promoters used in modeling studies in addition to those listed in table 1.a
ftsA Negative 1595731 - 1595749 -1:+18 AATAAACATAAAATGTGAA 22
ftsA Negative 1595765 - 1595788 +34:+57 TTCTGTTGTTATTTTTTGTTACAC 22
hutP Positive 4040438 - 4040460 +199:+221 CAATTGAAACCGCTTCCAAAAAG 2
kinB Negative ND -20:ND AAAATGAAGATTATAAATCACAATATTAT 22
pbpE Negative 3534606 - 3534630 -75:ND ATGTGATGGGTTAAAAAGGATCTCT 22
pbpE Negative 3534573 - 3534598 -40:ND GGATTTTTCAAAATATTTGAAACGTT 22
rbsR Positive 3700294 - 3700370 -133:-67 GAAATCTTCATCCATATTTGTGAAGACTTTGTC 18
AAAAAAAGAGTGAAAACCTTAAATTTTTCAA
TTATATATACAAT
rbsR Positive 3700432 - 3700464 -4:+29 CTATGTAAACGGTTACATAAACAAGGAGGAGCT 18
sigW Negative 194824 - 194850 +14:+41 GAGGTTAGATAAATATGGAAATGATGA 13
sinI Negative 2551623 - 2551645 +24:+46 TTTAATGGCAAATGACTTCCAGA 12
sinI Negative 2551622 - 2551647 ND ATTTAATGGCAAATGACTTCCAGAGA 21
spo0E Negative 1430061 - 1430095 -39:-5 TATGTTTACAAATAAAGTATAATCTGTAATAATGC 23
spo0H Negative 116537 - 116576 -35:+5 TGACGCTTTTTTGCCCAATACTGTATAATATTTCTA 22
TCTA
spoVG Negative 55753 - 55822 -75:-6 TAACTATATCCTATTTTTTCAAAAAATATTTTAAAAA 4
CGAGCAGGATTTCAGAAAAAATCGTGGAATTGA
tycA Negative ND -60:-35 TTTTTTGCAAAATATCCCTATTTTTTAAT 4
tycA Negative ND +169:+199 GAAGGGAATTTCCCAGAAACAGGAAATTTTCT 4
tycA Negative ND +207:+231 TTAAAATACCCAAATGATGGAAAAT 4
Intrinsic DNA Parametersa
Promoter
Minor Groove
Width (Å) Stretch (ο) Opening (o) Propeller (o)
sinIR 6.1 -0.107 -6.40 0.139
spo0E 5.2 -0.095 -6.79 0.158
BS18 5.2 -0.108 -6.36 0.136
TGGNA1 7.1 -0.103 -6.52 0.145
TGGNA3 4.7 -0.103 -6.49 0.141
All known natural
binders 4.6 – 7.4 -0.108 - -0.087 -6.32 - -7.18 0.132 - 0.172
Negative Control 4.0 -0.121 -5.90 0.115
Plots of propeller twist versus opening, opening versus stretch, and propeller twist versus stretch displays a linear relationship (Figure 2.8), suggesting a close correlation of these parameters. In addition, all natural known binding sequences along with BS18, TGGNA1
and TGGNA3 are clustered within a distinct region in each case (boxed) (Table 2.3). The single outlier in each case is the negative control DNA. These requirements for acceptable values of propeller, opening and stretch are -0.108 to -0.087, -6.32 to -7.18 and 0.132 to 0.172, respectively. Furthermore, distances calculated for one turn of B-DNA suggested a length of approximately 26.4 – 30.36 Å for all oligonucleotides examined; including the negative control. However, comparison of the minor groove distances reveals a length of approximately 4.6 – 7.4 Å for all oligonucleotides except the
Table 2.4. Patterns of Intrinsic DNA Parameters for the oligonucleotides used in AbrB and AbrBN binding studies.a The table shows the trend for several parameters for the modeled DNA. All
minor groove. The negative control has a minor groove length of 4.0 Å, lying outside of the range of appropriate values for the minor groove lengths to establish an interaction (Table 2.4).
DISCUSSION
AbrB regulates the expression of over 60 different genes nominally expressed or repressed in suboptimal environments. AbrB’s regulation of these genes is unrivaled. The genes are regulated with differing levels of affinity and with no apparent consensus binding sequence linking them. Although initial investigations of the DNA-binding domain of AbrB have aided in the understanding these promiscuous DNA recognition properties to some degree, there is still much unknown [99, 123]. It has been suggested that DNA targeting by AbrB may depend on recognition of a general DNA tertiary structure [96, 103, 105, 123, 124].
The promoters used in this study were chosen for several reasons: sinIR and spo0E are well-studied binding promoters for AbrB [110, 112, 121, 125], BS18 was chosen because it contains one idealized sequence of TGGNA-5bp-TGGNA, TGGNA1, TGGNA3, and the negative control were constructed based on results from Strauch et. al [110]. The negative control was constructed using areas known to be completely unprotected in DNase 1 footprinting assays, not just from sequences that showed weak, sub-millimolar binding [110]. To further elucidate the mode of interaction, µESI-MS experiments were performed on AbrB, AbrBN, and protein-DNA complexes.
µESI-MS was performed at 20 µM in 10 mM NH4HCO3 pH 8.0 in order to preserve
protein-DNA complexes for cations present in solution formed salt adducts which broadens peaks in the µESI-MS spectrum. While both positive and negative-ion modes afford signals that could be easily assigned and deconvoluted, the negative-ion mode was chosen due to less salt adducts and the corresponding improved spectral quality. In the negative-ion mode, the DNA spectra generated both single-stranded and double-stranded DNA ion series. Deconvolution of these data provided the correct molecular masses for all the expected values of the DNA sequences (data not shown).All protein-DNA complexes were stable over time and under conditions of increased energy source and heat capillary temperatures.
negative control afforded no complex and provided sequence specificity for interactions between AbrB, AbrBN and natural DNA targets. This result also confirmed the binding of DNA is the responsibility of the N-terminal domain. This represents the minimum structural content of AbrB necessary to bind DNA. The spectra collected showed the ability of AbrB and AbrBN to bind and form stable and significant/relevant complexes with the DNA oligonucleotides used in this study (Figure 2.2 and 2.3). The spectra also provided information concerning the relative affinity of AbrB and AbrBN for DNA.
To investigate general conformational changes upon DNA binding, CD and tyrosine emission fluorescence were used to probe the structural characteristics of AbrB, AbrBN and the DNA. CD was employed to discern any gross changes in structural motifs of AbrB, AbrBN and the DNA that may contribute to this differential binding. While CD provided an excellent method of probing secondary structure the instrumentation was limited by sensitivity, the lowest concentration that could be used to provide acceptable spectra was not within the range of the reported affinity constants. For this reason CD was used only for structural characterization and not affinity determination. While it is not possible to deconvolute the protein CD data into their secondary structural elements, reference spectra described by Johnson [118] indicate that the data for both AbrB and AbrBN are consistent with proteins that contain both α-helix and β-sheet elements, with the α-helical structures contributing to the minimum at 208 nm. The AbrB and AbrBN protein spectra are not superimposable when the data are normalized for the total number of amino acids for each protein. Analysis of this mean residue ellipticity suggests the secondary structure of the AbrBN dimer was affected by the loss of the C-terminus.
subtraction of the maximum intensities around ~215 nm for each oligonucleotide from the intensity of the negative control in their unbound and bound state. The resulting order is the same order of strength of interaction as seen in µESI-MS (Figure 2.5). The most significant determination from CD studies, was that the negative control was more topologically constrained (blue shifted by 5.4 nm), indicating the first known property of DNA that would lead to the inability of AbrB to bind. To ensure that the complexation, as seen in µESI-MS, did not necessitate any ionic cofactor binding or any buffer induced conformational change took place, titrations of MgCl2 and into differing buffers with
differing pH’s were performed. In all instances no differences were observed in the spectra obtained (data not shown).
the β-sheet scaffold of the dimerization domain in AbrBN, thereby contributing to the loss of signal.
It was determined that varying pH, as well as the introduction of Mg2+ as a possible binding co-factor, did not affect the overall tyrosine emission spectra, suggesting no major conformational changes (Figure 2.6A). This is congruent with µESI-MS and CD studies. Fluorescence was also used to probe protein-DNA interactions. Emission at 345 nm was normalized to sinIR, the strongest binder as seen in µESI-MS and CD studies, and then an identical relative strength of binding compared to µESI-MS and CD studies was evident; sinIR >> spo0E > BS18 > TGGNA3 > TGGNA1 >> negative control, (Figure 2.6B).
UV spectroscopy was then used to support the binding data obtained in the µESI-MS, CD and tyrosine fluorescence emission experiments. Solution phase dissociation constants (Table 2.2) determined by UV spectroscopy showed that the binding order of sinIR >>
recent studies in this area also suggest the possibility of performing solution phase competition experiments in a high throughput proteomic fashion [134].
oligonucleotides can then be verified through µESI-MS for relative binding affinities and competitive binding experiments.
This comprehensive study suggests, for the first time, a potential mode of regulation for a multitude of gene promoter sequences by AbrB from B. subtilis. The regulation seems to exist on many levels. The AbrB-negative control complex does not form under any circumstances, thereby defining a level of sequence specificity. This appears to be the first level of discrimination. After a subset of appropriate sequences are made available, the DNA must possess the necessary minor groove length, propeller, opening, and stretch in order to establish a potential interaction with AbrB. However, each combination of sequence, DNA topology and flexibility will vary slightly from one promoter to the next resulting in differential binding affinities. The contributions from a multitude of DNA characteristics, that make each promoter appealing to AbrB, allow binding to be more defined by subtle structural and dynamic features rather than by any obvious consensus base-pairing sequence.
previous results. The UV studies also corroborate the results of various relative binding affinity measurements using µESI-MS, CD and fluorescence. With this validation in mind, it is clear that using µESI-MS as a very rapid assay to study relative interactions of DNA binding proteins is particularly appealing.
Material and Methods
Expression and Purification of AbrB and AbrBN
Expression and purification of AbrB and AbrBN was carried out as previously described in Benson et. al [117] and in Appendix E .
DNA
All oligonucleotides and their complementary strands were synthesized as described in Appendix E.
Micro-electrospray mass-spectrometry
All mass spectrometry analyses were performed as described in Appendix E.
Circular Dichroism
CD spectra were measured as described in Appendix E.
Fluorescence
UV spectroscopy
As described in Appendix E. Changes in absorbance (maximum and minimum points of 200 and 240 nm) for each scan and normalization to DNA concentration at 260 nm provide the data points for dissociation constant (Kd) determination. The resulting graphs
are then fit to the equation [2.1]:
[Eq. 2.1]
Molecular Modeling
Chapter 3: Refinement of the solution state structure
of AbrBN from Bacillus subtilis
The work in this chapter was performed in collaboration with Dr. Geoffrey Mueller of NIEHS, Dr. Mark Strauch of University of Maryland and Dr. Alexey Murzin of the Laboratory of Molecular Biology at Cambridge University.
ABSTRACT
The availability of a growing number of complete genome sequences has greatly facilitated the determination of new protein structures. The premise of structural proteomics is that the knowledge of protein structure will eventually provide clues to protein function. There may be suggestive structural similarities to functionally characterized proteins. Not all of them are detected at the time of structure publication. Many new relationships between proteins of known structure are routinely discovered for the first time during classification of new protein structures in the SCOP database [135]. Exploration of these relationships can result in the identification of other related proteins, and, by them, in functional predictions. Here we present the refined high-resolution solution structure of the dimeric AbrB N-terminal DNA-binding domain from Bacillus subtilis (AbrBN; residues 1-53) an example of a new structural relationship that prompted the revision of our published structure of the N-terminal domain of the transition state regulator AbrB. These data support a model in which AbrB binds target DNA sequences using an integrated mechanism of macromolecular assembly and reorientation of key features of the DNA binding domain [95, 96]. The revised AbrB structure has conformed to the same relationship and transformed it into a new superfamily of evolutionarily and functionally related proteins with novel DNA-binding fold and protein-DNA recognition mode.
AbrB-bound promoter elements has failed to reveal an obvious DNA consensus sequence recognized by AbrB [75, 76]. However, hydroxy radical footprinting was able to identify that binding occurs on one face of the DNA [76, 136]. AbrB is a tetrameric (Chapter 2) protein consisting of identical 94 residue monomers. Mutational studies have shown that each monomer can be divided into two functional domains. Its DNA-binding function resides in the N-terminal domain, AbrBN [100, 109, 137]. Mutational disruption of the C-terminus alters, but does not eliminate, DNA binding affinity, and results in AbrB mutant solution sizes half that of wild type AbrB. AbrBN forms a dimer, whereas the full length protein forms a tetramer by means of the N- and C-terminal domain interactions (Chapter 2). The reported solution structure of the AbrBN dimer showed no similarity to any known DNA-binding protein. However, its validity was questioned by the discovery of a new relationship between two new protein structures.
One of the new protein structures is the antidote protein MazE of the Escherichia coli
octamer. Described in the original report as having a novel fold, MraZ subunit nevertheless has a striking structural similarity to the MazE dimeric domain [139]. It consists of two repeats of similar structure and sequence. The N-terminal parts of both repeats are intertwined into a single domain of the MazE fold, whereas the extra C-terminal α-helical regions determine the octameric assembly. With these data in mind, we felt a refinement of the AbrBN structure needed to take place. Discussed below are the structural refinement and relationship of AbrBN to MraZ and MazE.
RESULTS
Chemical Shift Index (CSI) analysis of the Hα, Cα, Cβ, and C’ chemical shifts revealed one stretch of α-helical region, residues 20 - 26. Furthermore CSI analysis revealed four stretches of β-strand regions; 4 - 10, 15 - 17, 34 - 39, and 41 - 46. Additionally, TALOS analysis of the sequence and chemical shifts corroborates the CSI analysis of the data [140]. These predictions correspond quite well with the previously reported structure with one notable exception for β-strand 2. β-strand 2 is a very short β-strand similar to an “X” (Figure 3.1). This arrangement is in agreement with hydrogen exchange NMR, residue 15 and 17 are in fast exchange while residue 16 (the crossing point in the “X”) is in slow exchange due to hydrogen bonding.
Figure 3.1 Hydrogen exchange data. Hydrogen exchange data showing residues 15’, 16, and 17. Notice the arrangement of hydrogen bonds, 16 is hydrogen bonded to 16’ in accordance to the hydrogen exchange data while residue 15’ and 17’s NH bonds are oriented in opposite directions. Blue residues are 16 and 16’. 15’ and 17 are as noted in the figure. Orange boxes denote NH bonds and green boxes denote CO bonds. Verifies hydrogen exchange data and confirms that beta – strand 2 is a loosely associated sheet through only two hydrogen bonds.
Residue 15’