ISSN(Online) : 2319-8753 ISSN (Print) : 2347-6710
I
nternational
J
ournal of
I
nnovative
R
esearch in
S
cience,
E
ngineering and
T
echnology
(An ISO 3297: 2007 Certified Organization)
Website: www.ijirset.com
Vol. 6, Issue 6, June 2017
Teaching Learning Based Optimization for
Combined Economic Emission Load Dispatch
Problem
Ritunjoy Bhuyan
1, Dr Sarmila Patra
2Research Student, Department of Electrical Engineering, Assam Engineering College, Guwahati, Assam, India1
Associate Professor, Department of Electrical Engineering, Assam Engineering College, Guwahati, Assam, India 2
ABSTRACT: “TEACHING LEARNING BASED OPTIMIZATION” is a budding efficient optimization Technic which is proposed in this paper as a tool to optimize the Combined Economic Emission Load Dispatch Problem in Electrical Power System . The key mechanism of this optimization method is dependency of the learners on the teacher . Being a population based optimization technic, this method utilizes a population of solutions for heading towards global solution. The population is taken as a class of learners. The Algorithm has been experimented on two different test systems and the superiority has been revealed in comparison to some other optimization technics.
KEYWORDS: Effect, Teaching learning based optimization,Combined economic emission load dispatch, Genetic algorithm, cost coefficient, emission coefficient, fuel cost
I.INTRODUCTION
One of the most important part of the Electrical Engineering is the Electrical Power System. With the ever increasing popularity of this version of Energy among all layered people , now a days ,it becomes very much necessary for it to be cost effective. Economic load dispatch is an integral part of such cost controlling practice. Initially , Economic load dispatch has involved only optimal power allocation of the generator to cope with the load demand within certain constraints resulting minimum cost. But because of the low capital cost and abundant availability of the fossil fuel, Thermal power plant started mushrooming globally with a dangerous threat to the environment with toxic gases and particulates mixed with residual flue gas to the air. The problem is very rightly taken over and Combined Economic Emission Load Dispatch system(CEED) in a optimized manner has emerged in the field of Electrical Power System Engineering. Both the fuel cost and environmental pollution are supposed to minimize with this approach by allocating optimal power the concerned generators.
Earlier , CEED optimization problems are being solved by Evolutionary programming technic[1], ACO-MSM Approach[2].PSO Technic[3] etc.
Teaching Learning Based Optimization ,a population based technic involving teacher and students’ relationship concept, , is comparatively new in the field [4]. The method has speedy computation characteristic in comparison to other method like GA[6],PSO[7],ABC[8].ABC-PSO ,a new optimization method has also been proposed to solve CEED[13].
LITERATURES SURVEY
ISSN(Online) : 2319-8753 ISSN (Print) : 2347-6710
I
nternational
J
ournal of
I
nnovative
R
esearch in
S
cience,
E
ngineering and
T
echnology
(An ISO 3297: 2007 Certified Organization)
Website: www.ijirset.com
Vol. 6, Issue 6, June 2017
CelalYasaret al,2005[]applies gradient method to solve CEED highlighting easy control of constraints. The paper shows the inconvenience of absence of clearly defined method for the choice of ∝𝐺 which control the the speed of convergence
Lakshmi A Devi et al,2008[] utilizes evolutionary programming method to solve CEED.According to this paper,Lambda may be used to make the coding of chromosome independent on the number of units.
II.OVERVIEW OF COMBINEDC ECONOMIC EMISSION LOAD DISPATCH PROBLEM 2.1 Fuel and Emission cost Function:
The aim of CEED is to minimize fuel cost and emission cost within all constraints .
The cost function is given by
𝐹𝑖(𝑃𝑖) = 𝑎𝑖𝑃𝑖2+ 𝑏𝑖𝑃𝑖+ 𝑐𝑖--- (1)
𝐸𝑖 𝑃𝑖 =∝𝑖 𝑃𝑖2+ 𝛽𝑖𝑃𝑖+ 𝛾𝑖)--- (2)
Min [𝐹𝑖 𝑃𝑖 + 𝐸𝑖(𝑃𝑖)] Where
𝐹𝑖 𝑃𝑖 =Fuel cost function 𝐸𝑖 𝑃𝑖 = Emission cost function 𝑃𝑖=Out put power of generator i 𝑁 =Number of generators 𝑎𝑖, 𝑏𝑖, 𝑐𝑖 =cost coefficient of unit i ∝𝑖, 𝛽𝑖, 𝛾𝑖 =emission cost coefficient
2.2 Constraints
I) Constraints with equality 𝑃𝑖
𝑁
𝑖=1 (t)= Load Demand+ Transmission Loss
II)Constraints with Inequality 𝑃𝑖𝑚𝑖𝑛 ≤ 𝑃𝑖 ≤ 𝑃𝑖𝑚𝑎𝑥
𝑃𝑖𝑚𝑖𝑛&𝑃𝑖𝑚𝑎𝑥=Minimum and maximum operating limit of the generatots
III. OVERVIEW OF TEACHING LEARNING BASED OPTIMIZATION TECHNIC (TLBO)
TLBO method is a relationship based method between teacher and students in the class. The method is analogous to the effect of teacher students understanding learning in a class
The population in TLBO is a group of Learners.
TLBO consists of two parts
i) “TEACHER PHASE”
ii) “LEARNER PHASE”
Initialization of the population is random within certain limit and the concerned equation is
𝑋𝑖,𝑗0 = 𝑋𝑗𝑚𝑖𝑛 + 𝑟𝑎𝑛𝑑 ∗ (𝑋𝑗𝑚𝑎𝑥 − 𝑋𝑗𝑚𝑖𝑛)--- (3)
Where rand denotes uniformly distributed random variable within the range (0,1),
𝑋𝑗𝑚𝑖𝑛 , 𝑋
ISSN(Online) : 2319-8753 ISSN (Print) : 2347-6710
I
nternational
J
ournal of
I
nnovative
R
esearch in
S
cience,
E
ngineering and
T
echnology
(An ISO 3297: 2007 Certified Organization)
Website: www.ijirset.com
Vol. 6, Issue 6, June 2017
i) Teacher phase:
The mean parameter of each subject of the learners in the class at generator g is given by 𝑀𝑔 = [𝑚1
𝑔 , 𝑚2
𝑔
, − − − − −𝑚𝑗𝑔− − − −𝑚𝐷 𝑔
]--- 𝑇𝑜 𝑜𝑏𝑡𝑎𝑖𝑛 𝑎 𝑛𝑒𝑤 𝑝𝑜𝑝𝑢𝑙𝑎𝑡𝑖𝑜𝑛 𝑠𝑒𝑡 𝑜𝑓 𝑙𝑒𝑎𝑟𝑛𝑒𝑟
𝑋𝑛𝑒𝑤𝑖𝑔 = 𝑋𝑖𝑔+ 𝑟𝑎𝑛𝑑(𝑋𝑇𝑒𝑎𝑐 𝑒𝑟𝑔 − 𝑇𝐹∗ 𝑀𝑔)--- (4)
𝑇𝐹=Teaching factor between value 1to 2
If 𝑋𝑛𝑒𝑤 𝑖𝑔 is better than 𝑋𝑖𝑔 in generation g then it replace 𝑋𝑖𝑔 otherwise wise it remains 𝑋𝑖𝑔
ii) Learner Phase
The students can enhance their knowledge in Learner Phase by interacting with other students or by sharing knowledge
For a Learner𝑋𝑖𝑔 Another learner 𝑋𝑟
𝑔
is randomly selected with 𝑖 ≠ 𝑟 Now to set a new vector in learner phase
𝑋𝑛𝑒𝑤𝑖𝑔 = 𝑋𝑖𝑔+ 𝑟𝑎𝑛𝑑 ∗ 𝑋𝑖𝑔− 𝑋𝑟 𝑔
𝑖𝑓 𝑓(𝑋𝑖𝑔) < 𝑓(𝑋𝑟
𝑔
)--- (5)
𝑋𝑛𝑒𝑤𝑖𝑔 = 𝑋𝑖𝑔+ 𝑟𝑎𝑛𝑑 ∗ 𝑋𝑟 𝑔
− 𝑋𝑖𝑔 𝑖𝑓 𝑓(𝑋𝑖𝑔) > 𝑓(𝑋𝑟
𝑔
)--- (6)
IV. IMPLEMENTATION OF TLBO METHOD TO CEED PROBLEM
The sequential steps involved in solution of CEED by TLBO are explained below
Step 1: Input the total number of learners, number of subjects offered to the learners, cost coefficients, loss coefficients, load demand and limits of the constraints. Here the number of learners in a class is considered as population and the number of subjects offered to the learner is considered as generators. Each learner indicates a solution for the power generation of the units.
Step 2: Generate the initial population which satisfies the limits and constraints. Each individual (generating units’ output) learner is randomly initialized according to equation (1) in the feasible range, which would satisfy the equality and inequality constraints. If any individual violets the limit set that individual at the limiting value. If the equality constraint is violated, discard that individual and repeat the process of initialization until all constraints are satisfied.
Step 3: Objective function of each individual is calculated.
Step 4: : In the current iteration the best solution is considered as the teacher and the new value of population is calculated using equations (2) If any new individual violets the limit set that individual at the limiting value. If the equality constraint is violated, discard that individual and repeat the process until all constraints are satisfied.
Step 5: New learners are evaluated according to equation (5) and (6). If any new individual violets the limit set that individual at the limiting value. If the equality constraint is violated, discard that individual and repeat the process until all constraints are satisfied. Step 6: Stop the process if maximum number of iteration is reached, otherwise repeat from step 4.
V. FLOWCHART OF TLBO ALGORITHM
The flow chart of Teaching Learning based Optimization technic has basically two parts-Teacher’s Part and Learner’s part
After initialization of the solutions , the best is considered as teacher and the rest of the populations are updated by the teachers
Each better updated solution is accepted to join in the learner phase.
In learner phase, there is random selection of two populations and the worst is updated by other. The updated is rejected if not better than original one .
ISSN(Online) : 2319-8753 ISSN (Print) : 2347-6710
I
nternational
J
ournal of
I
nnovative
R
esearch in
S
cience,
E
ngineering and
T
echnology
(An ISO 3297: 2007 Certified Organization)
Website: www.ijirset.com
ISSN(Online) : 2319-8753 ISSN (Print) : 2347-6710
I
nternational
J
ournal of
I
nnovative
R
esearch in
S
cience,
E
ngineering and
T
echnology
(An ISO 3297: 2007 Certified Organization)
Website: www.ijirset.com
Vol. 6, Issue 6, June 2017
IV. RESULTS AND DISCUSSION
The proposed TLBO algorithm is applied to solve ELD, EED and CEED for two different test cases.
Test case 1: 6 unit system Test case 2: 10 unit System Test case 1
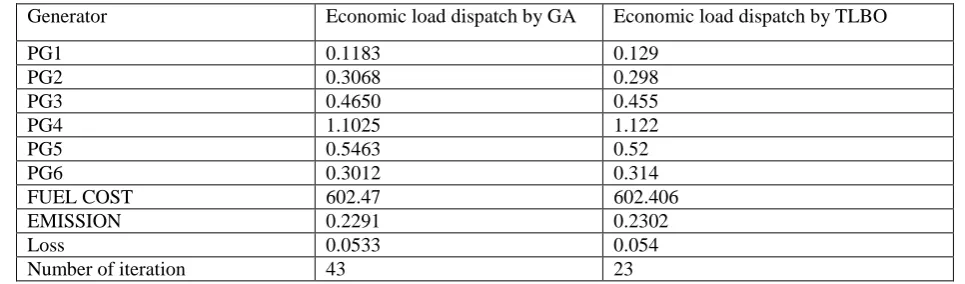
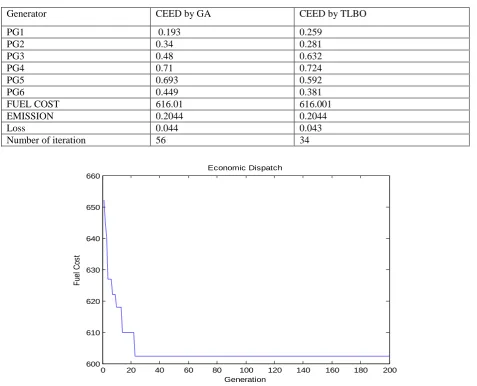
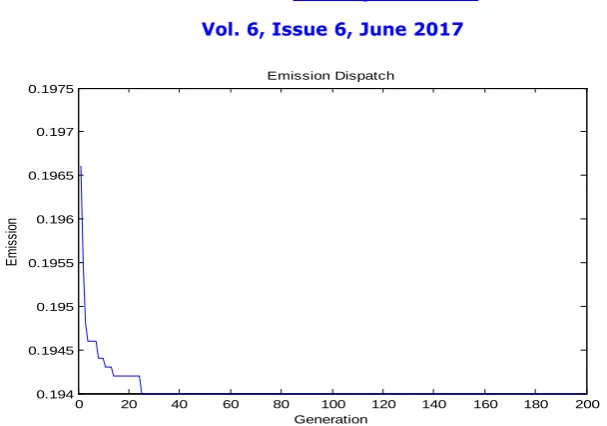
The results of solution ELD, EED and CEED by TLBO for 6 unit system are given in Table I, II and III respectively. Results from application of by GA are also shown in the table I for comparison. Fuel cost for ELD comes out as 602.406 $ and Emission for EED comes out as 0.194 lb and for CEED fuel cost and emission are 616.001 $ and 0.2044 lb. A slight better results in terms of objective function has been obtained by TLBO. Moreover for all the cases in TLBO the numbers of iterations are considerably less than the numbers of iterations in GA.. Fig .1 to .3 shows the convergence characteristics of ELD, EED and CEED for 6 unit system by TLBO.
Table I :Comparison of Economic load dispatch for 6 generators
Generator Economic load dispatch by GA Economic load dispatch by TLBO
PG1 0.1183 0.129
PG2 0.3068 0.298
PG3 0.4650 0.455
PG4 1.1025 1.122
PG5 0.5463 0.52
PG6 0.3012 0.314
FUEL COST 602.47 602.406
EMISSION 0.2291 0.2302
Loss 0.0533 0.054
Number of iteration 43 23
Table II:Comparison of Economic Emission Dispatch for 6 generators
Generator Economic Emission dispatch by
GA
Economic Emission dispatch by TLBO
PG1 0.418 0.411
PG2 0.465 0.477
PG3 0.543 0.548
PG4 0.407 0.384
PG5 0.531 0.548
PG6 0.52 0.518
FUEL COST 649.04 651.14
EMISSION 0.1942 0.194
Loss 0.038 0.037
ISSN(Online) : 2319-8753 ISSN (Print) : 2347-6710
I
nternational
J
ournal of
I
nnovative
R
esearch in
S
cience,
E
ngineering and
T
echnology
(An ISO 3297: 2007 Certified Organization)
Website: www.ijirset.com
Vol. 6, Issue 6, June 2017
0 20 40 60 80 100 120 140 160 180 200
600 610 620 630 640 650 660
Generation
F
ue
l C
os
t
Economic Dispatch
Table III :Comparison on CEED by GA& TLBO for 6 generators
Generator CEED by GA CEED by TLBO
PG1 0.193 0.259
PG2 0.34 0.281
PG3 0.48 0.632
PG4 0.71 0.724
PG5 0.693 0.592
PG6 0.449 0.381
FUEL COST 616.01 616.001
EMISSION 0.2044 0.2044
Loss 0.044 0.043
Number of iteration 56 34
ISSN(Online) : 2319-8753 ISSN (Print) : 2347-6710
I
nternational
J
ournal of
I
nnovative
R
esearch in
S
cience,
E
ngineering and
T
echnology
(An ISO 3297: 2007 Certified Organization)
Website: www.ijirset.com
Vol. 6, Issue 6, June 2017
0 20 40 60 80 100 120 140 160 180 200
0.194 0.1945 0.195 0.1955 0.196 0.1965 0.197 0.1975
Generation
E
m
is
si
on
Emission Dispatch
0 20 40 60 80 100 120 140 160 180 200
740 760 780 800 820 840 860
Generation
T
ot
al
C
os
t(
fu
el
+
E
m
is
si
on
)
CEED
Fig. .2Convergence characteristics of EED for 6 unit system by TLBO
Fig. .3Convergence characteristics of CEED for 6 unit system by TLBO
Test case 2
ISSN(Online) : 2319-8753 ISSN (Print) : 2347-6710
I
nternational
J
ournal of
I
nnovative
R
esearch in
S
cience,
E
ngineering and
T
echnology
(An ISO 3297: 2007 Certified Organization)
Website: www.ijirset.com
Vol. 6, Issue 6, June 2017
Table IVComparison of Economic Load Dispatch by GA & TLBO for 10 generators
GENERATOR Economic Load dispatch by GA Economic Load dispatch by TLBO
PG1 55 55
PG2 80 79.999
PG3 106.93 106.946
PG4 100.57 100.607
PG5 81.49 81.487
PG6 83.01 83.007
PG7 300 299.999
PG8 340 339.999
PG9 470 469.999
PG10 470 469.999
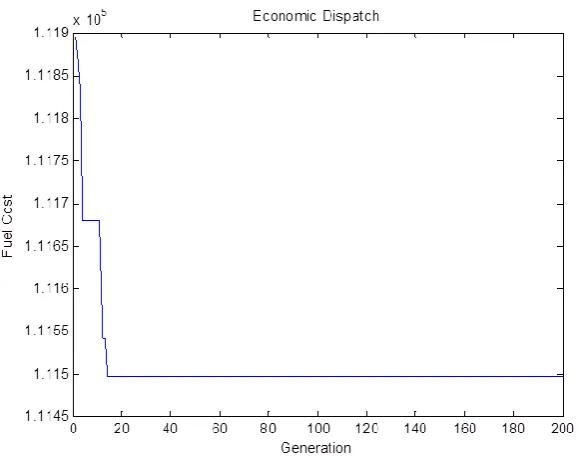
FUEL COST 111500 111497.632
EMISSION 4571.2 4572.362
LOSS 87.03 87.03
NUMBER OF ITERATION 45 40
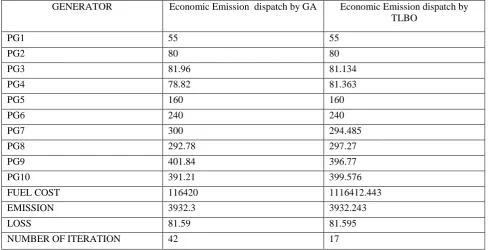
Table V: Comparison of Emission Dispatch by GA & TLBO for ten generators
GENERATOR Economic Emission dispatch by GA Economic Emission dispatch by
TLBO
PG1 55 55
PG2 80 80
PG3 81.96 81.134
PG4 78.82 81.363
PG5 160 160
PG6 240 240
PG7 300 294.485
PG8 292.78 297.27
PG9 401.84 396.77
PG10 391.21 399.576
FUEL COST 116420 1116412.443
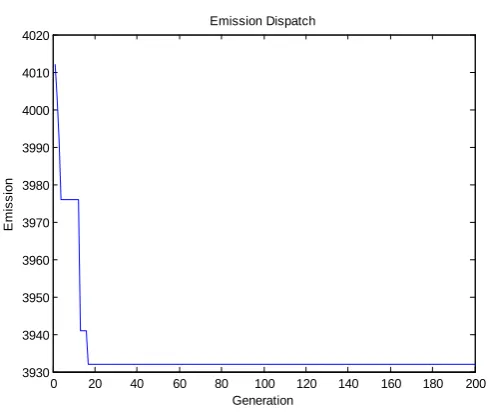
EMISSION 3932.3 3932.243
LOSS 81.59 81.595
ISSN(Online) : 2319-8753 ISSN (Print) : 2347-6710
I
nternational
J
ournal of
I
nnovative
R
esearch in
S
cience,
E
ngineering and
T
echnology
(An ISO 3297: 2007 Certified Organization)
Website: www.ijirset.com
Vol. 6, Issue 6, June 2017
Table VI : Comparison of CEED by GA and TLBO for ten generators
GENERATOR CEED by GA CEED by TLBO
PG1 55 55.888
PG2 80 79.96
PG3 81.14 86.586
PG4 81.22 83.74
PG5 134.34 134.27
PG6 167.5 157.134
PG7 296.83 297.64
PG8 311.58 217.295
PG9 420.34 440.48
PG10 449.16 432.23
FUEL COST 113420 113106.894
EMISSION 4120.1 4150.496
LOSS 84.17 83.223
NUMBER OF ITERATION 40 17
ISSN(Online) : 2319-8753 ISSN (Print) : 2347-6710
I
nternational
J
ournal of
I
nnovative
R
esearch in
S
cience,
E
ngineering and
T
echnology
(An ISO 3297: 2007 Certified Organization)
Website: www.ijirset.com
Vol. 6, Issue 6, June 2017
0 20 40 60 80 100 120 140 160 180 200
1.175 1.18 1.185 1.19 1.195 1.2
1.205x 10
5
Generation
T
o
ta
l
C
o
s
t(
F
u
e
l+
E
m
is
s
io
n
)
CEED
Fig .5-Convergence characteristic of EED by TLBO for 10 unit system
Fig .6-Convergence characteristic of CEED by TLBO for 10 unit system
0 20 40 60 80 100 120 140 160 180 200
3930 3940 3950 3960 3970 3980 3990 4000 4010 4020
Generation
E
m
is
s
io
n
ISSN(Online) : 2319-8753 ISSN (Print) : 2347-6710
I
nternational
J
ournal of
I
nnovative
R
esearch in
S
cience,
E
ngineering and
T
echnology
(An ISO 3297: 2007 Certified Organization)
Website: www.ijirset.com
Vol. 6, Issue 6, June 2017
VII. CONCLUSION
TLBO has been successfully applied on CEED . It comes out to be a better technic over the counter parts .This technic in both the cases minimize both the fuel cost as well as emission cost satisfactorily.
REFERENCES
1. Senthi K, ME ”Combined Economics Emission Sispatch using Evolutionary Programming Technic”IJCA Special Issue on “Evolutionary Computation for optimization Technique”ECOT2010
2. Waiel F Abd El-Wahed, A A MOSA,M A Elsisy, “Solving Economic Emission Load Dispach Problem by Using Hybrid ACO-MSM approach”-The On Line Journal on Power and Energy Engneering-vol-1, N0-1
3. MuthuVijayaPndianS,”An efficient Particle Swam Optimization Technic”