DOI: 10.1534/genetics.107.081505
Empirical Tests of the Reliability of Phylogenetic Trees Constructed
With Microsatellite DNA
Naoko Takezaki*
,1and Masatoshi Nei
†*Life Science Research Center, Kagawa University, Mikicho, Kitagun, Kagawa 761-0793, Japan and†Institute of Molecular Evolutionary Genetics, Pennsylvania State University, University Park, Pennsylvania 16802
Manuscript received September 5, 2007 Accepted for publication October 26, 2007
ABSTRACT
Microsatellite DNA loci or short tandem repeats (STRs) are abundant in eukaryotic genomes and are often used for constructing phylogenetic trees of closely related populations or species. These phylogenetic trees are usually constructed by using some genetic distance measure based on allele frequency data, and there are many distance measures that have been proposed for this purpose. In the past the efficiencies of these distance measures in constructing phylogenetic trees have been studied mathematically or by computer simulations. Recently, however, allele frequencies of 783 STR loci have been compiled from various human populations. We have therefore used these empirical data to investigate the relative efficiencies of different distance measures in constructing phylogenetic trees. The results showed that (1) the probability of ob-taining the correct branching pattern of a tree (PC) is generally highest forDAdistance; (2)FST* , standard genetic distance (DS), andFST=ð1FSTÞgive similarPC-values,FST* being slightly better than the other two; and (3) (dm)2showsP
C-values much lower than the other distance measures. To have reasonably highPC -values for trees similar to ours, at least 30 loci with a minimum of 15 individuals are required whenDAdistance is used.
B
ECAUSE microsatellite DNA loci or short tandem repeat (STR) loci are highly polymorphic, they are very useful for studying the evolutionary relationships of closely related populations or species. However, a number of statistical problems should be solved before this approach can be used effectively. Some of the major problems are: (1) What kind of distance measures should be used for constructing phylogenetic trees?, (2) How many loci should be used?, and (3) How many individuals per locus should be used? Some of these problems have been studied theoretically or by computer simulation with specific mathematical models (e.g., Zhivotovsky andFeldman1995; Takezakiand Nei 1996; Zhivotovsky
et al.2001; Kalinowski2002). However, the assumptions
for constructing mathematical models are not always realistic, and for this reason these studies may give wrong conclusions. Fortunately, a large number of data about STR loci have recently been accumulated from various human populations (Ramachandranet al.2005; Rosenberget al.
2005). We have therefore decided to study the above problems using these empirical data.
MATERIALS AND METHODS
Microsatellite data:Genotypic data of 783 STR loci of 1027 in-dividuals from 53 populations that were used by Ramachandran
et al.(2005) for studying isolation by distance were downloaded from http://rosenberglab.bioinformatics.med.umich.edu/data/ ramachandranEtAl2005/combinedmicrosats-1027.stru. Allele frequencies were computed by excluding missing data. In-formation regarding the STR loci such as the unit of nu-cleotide repeats and genomic locations of STR loci was obtained from http://rosenberglab.bioinformatics.med. umich.edu/data/rosenbergEtAl2002/diversityloci.txt and by internet search including databases of Marshfield (http:// marshfieldclinic.org/research/pages/index.aspx) and UniSTS at NCBI (http://www.ncbi.nlm.nih.gov/). These data were essen-tially the same as the microsatellite data used by Rosenberget al. (2005), although Rosenberg et al.’s data included insertion/ deletion polymorphism data and data from the Surui popula-tion in Brazil. In our data set of 783 STR loci, there were 45 dinucleotide, 175 trinucleotide, 555 tetranucleotide, and 8 pentanucleotide repeat loci. Examining 1056 individuals from 52 populations, Zhivotovskyet al.(2003) studied the extent of variation in 377 STR loci, of which 45 were dinucleotide, 58 were trinucleotide, and 274 were tetranucleotide repeat loci. The same data set was also used by Rosenberget al.(2002). The dinucleotide repeat loci used by Zhivotovskyet al.(2003) were the same as those in this study, and their trinucleotide and tetranucleotide repeat loci were a subset of the loci used in this study.
Genomic locations were available for300 loci, but only a few pairs of loci were within a genomic distance of 1 Mbp. Therefore, the extent of linkage disequilibrium between the loci seems to be negligible.
The heterozygosity for a locus was calculated byh¼ ð2n= ð2n1ÞÞð1Px2
iÞ, wherexiis the frequency of theith allele
in the sample, and nis the number of diploid individuals examined at the locus. In this study null alleles were excluded when allele frequencies were computed. Therefore, the actual 2n value could be smaller than two times the number of 1Corresponding author:Life Science Research Center, Kagawa University,
1750-1 Ikenobe, Mikicho, Kitagun, Kagawa 761-0793, Japan. E-mail: [email protected]
individuals examined. The average heterozygosity (H) for rloci was estimated byH¼Pr
j¼1hj=r, whereas the sampling
variance ofH is computed by VðHÞ ¼Pr
j¼1VðhjÞ=r, where
VðhÞ ¼Pr
j¼1ðhjHÞ2=ðr1Þ (Nei 1987). The expected value of heterozygosity½E(H)in an equilibrium population is EðHÞ ¼M=ð11MÞ for the infinite-allele model (IAM) (Kimura and Crow 1964) and EðHÞ ¼11= ffiffiffiffiffiffiffiffiffiffiffiffiffiffiffiffi112M
p
for the stepwise mutation model (SMM) (Ohta and Kimura 1973), whereM¼4Nv, andNandvare the effective popu-lation size and mutation rate, respectively. We also examined the distribution of the average of the number (na) of alleles per locus within populations.
Genetic distance measures: We examined the statistical properties of several genetic distance measures that are often used in actual data analysis. Most of them were originally developed for classical genetic markers such as blood group and isozyme loci that approximately follow the IAM, in which a new allele is always created by mutation. TheDAdistance (Nei et al.1983) is defined as
DA¼11 r
Xr
j
Xmj
i
ffiffiffiffiffiffiffiffiffi xijyij
p ;
wherexij and yij are the frequencies of the ith allele at the
jth locus in populations X and Y, respectively, and mj is
the number of alleles at the jth locus. Cavalli-Sforza and Edwards (1967) proposed the chord distance (DC) defined by
DC¼ 2
pr Xr
j
h
21X
mj
i
ffiffiffiffiffiffiffiffiffi xijyij
p i1=2 :
In the computer simulation by Takezakiand Nei(1996), the DAandDCdistances showed the highest probabilities of ob-taining the correct tree. However, sinceDAperformed slightly better thanDC in constructing phylogenetic trees, we used onlyDAin this study.
Nei’s (1972) standard genetic distance (DS) is given by
DS¼ ln JXYffiffiffiffiffiffiffiffiffi JXJY
p ;
whereJX ¼
Pr j
Pmj
i xij2=randJY ¼
Pr j
Pmj
i yij2=rare the average
homozygosities over the loci for populationsXandY, respec-tively, andJXY ¼
Pr j
Pmj
i xijyij=r. Under the IAM with mutation–
drift balance,E½DS, the expectation ofDS, is given by 2vt, where vis a mutation rate per locus per generation andtis the time measured in generations after the two populations diverged. Therefore,DSis expected to increase linearly with time under the IAM.
F* ST¼
ðJX1JYÞ=2JXY
1JXY
:
DL¼ lnð1FST*Þ(Latter1972; Reynoldset al.1983) was also proposed as a distance measure. However, our previous studies showed that the probabilities of obtaining correct tree topologies were very similar forDLandFST* or slightly lower for DLthan forFST* . Therefore,DLis not considered in this study. In this study we examine the following distance measure related to FST* , which was not included in our previous computer simulation:
FST9 ¼ FST 1FST
:
FST in the above formula is equivalent to Nei’s (1973) GST (Slatkin1995), andGSTcan be estimated byFST* in the case of two populations. Therefore,FST9 was computed by FST* /(1 FST* ) in this study.FST9 was originally proposed as a measure of isolation by distance (Slatkin1993; Rousset1997). It was shown to increase approximately linearly with time after the two populations separated for the case of low mutation rate (Slatkin1995).
Some distance measures were developed specifically for STR loci in which the number of short nucleotide repeats was assumed to change following the SMM. Distance measure (dm)2was developed for this model in which the number of
nucleotide repeats (i) changes toi1 ori11 with an equal probability (Goldsteinet al.1995). It is defined by
ðdmÞ2¼X
r
j
ðmX jmYjÞ
2=r;
wheremXj ¼Piixij and mYj ¼
P
iiyij are the average repeat
numbers of alleles at the jth locus, and xij and yij are the
frequencies of the allele with repeat number (allele size)iat thejth locus in populationsXandY, respectively. Under the SMM with mutation–drift balance, the expected value of (dm)2
is 2vt, wherevis a mutation rate per locus per generation andt is the time measured in generations after the two populations diverged. Therefore, (dm)2is expected to increase linearly with
time under the SMM.
Measures of the efficiency of phylogenetic construction:In this study, phylogenetic trees were constructed by the neigh-bor-joining method (Saitouand Nei1987) with the genetic
distance measures considered above. We examined the effi-ciencies of phylogenetic construction of different genetic dis-tance measures by the nonparametric bootstrap approach. In this approach a certain number of loci (10, 20, 30, 50, 100, 300, 500, and 700) were chosen at random with replacement from the actual STR data set and neighbor-joining trees were constructed with the different distance measures mentioned above. In the examination of the effect of sample size on the efficiency of phylogenic construction, 5, 10, 15, 20, or 25 individuals were chosen at each locus, but in the other cases all the individuals were used. To examine the accuracy of a constructed tree, we need a true tree or a model tree with which the topology of the tree constructed can be compared. In the case of computer simulation, this model tree can be predetermined as in the case of Takezakiand Nei’s (1996) study. In a study with empirical data there is no way to know the true tree that would reflect the historical relationship of the populations used. We have therefore decided to use a crude model tree based on the biogeographical distribution of popu-lations and the consensus tree constructed by using all 783 STR loci with all distance measures used. Such a convergent topology is presented in Figure 1, and we used this tree to-pology as a model tree. We are aware of many arguments that can be raised against this approach. Interestingly, however, the same tree topology as this one was obtained by all distance measures when all STR loci were used. Therefore, this tree is not an arbitrary one but is supported by both biogeographical and genetic data. As far as the STR data are concerned, this is the tree to which all tree estimates are supposed to converge as the number of loci increases.
To measure the accuracy of a reconstructed tree, we com-puted the average of the topological distances (dT) (Robinson and Foulds1981; Neiand Kumar2000) of constructed trees from the model tree, the probability (PC) of obtaining the correct topology, and the probabilities (P1) of obtaining the groupings (partitions) of the populations separated by each interior branch of the model tree with 10,000 replications. It should be noted thatdTis twice the number of partitions in a constructed tree different from those in the model tree. In this study we did not consider branch length errors, because it was difficult to determine the true or model branch lengths in the present case.
We computed the means and coefficients of variation (CVs) (standard deviation/mean) for the distance measures by the TABLE 1
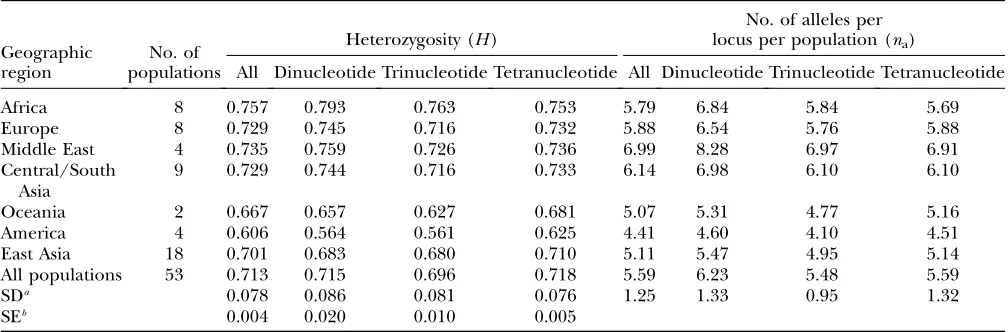
Average heterozygosities and numbers of alleles per locus for populations in different geographic regions
Heterozygosity (H)
No. of alleles per locus per population (na) Geographic
region
No. of
populations All Dinucleotide Trinucleotide Tetranucleotide All Dinucleotide Trinucleotide Tetranucleotide
Africa 8 0.757 0.793 0.763 0.753 5.79 6.84 5.84 5.69
Europe 8 0.729 0.745 0.716 0.732 5.88 6.54 5.76 5.88
Middle East 4 0.735 0.759 0.726 0.736 6.99 8.28 6.97 6.91
Central/South Asia
9 0.729 0.744 0.716 0.733 6.14 6.98 6.10 6.10
Oceania 2 0.667 0.657 0.627 0.681 5.07 5.31 4.77 5.16
America 4 0.606 0.564 0.561 0.625 4.41 4.60 4.10 4.51
East Asia 18 0.701 0.683 0.680 0.710 5.11 5.47 4.95 5.14
All populations 53 0.713 0.715 0.696 0.718 5.59 6.23 5.48 5.59
SDa 0.078 0.086 0.081 0.076 1.25 1.33 0.95 1.32
SEb 0.004 0.020 0.010 0.005
a
Standard deviation of heterozygosity (h) and the average of the number of alleles per locus per population (na).
b
nonparametric bootstrap approach. The averages and the standard deviations of the distance values were computed for the distance values for 30 loci chosen at random in each replication by carrying out 10,000 replications.
RESULTS
Extent of variation in di-, tri-, and tetranucleotide
repeat loci: Because the extent of genetic
polymor-phism affects the efficiency of phylogenetic construc-tion, we first examined the levels of heterozygosity for three different groups of STR loci with respect to the size of the unit of nucleotide repeats (Table 1). Average heterozygosities (H) were similar for three kinds of loci across all populations (0.715 for dinucleotide, 0.696 for trinucleotide, and 0.718 for tetranucletide repeat loci). Table 1 also shows the average number (na) of alleles
per locus for populations in different geographical re-gions. The averagenafor the entire set of populations
is somewhat higher for dinucleotide repeat loci (6.23) than those for trinucleotide (5.48) and tetranucleotide repeat loci (5.58). Thena’s for trinucleotide and
tetra-nucleotide repeat loci are similar, but the peak of the frequency distribution ofnafor tetranucleotide repeat
loci is slightly shifted to the left and wider in comparison to that of trinucleotide repeat loci (Figure 2). Z hivo-tovskyet al.(2003) showed the frequency distributions
of the number of alleles per locus for the entire population, not the average of the number of alleles per locus per population (na) that we examined in this
study. We also computed the number of alleles per locus for the entire population (see supplemental Figure 1 at http://www.genetics.org/supplemental/). The shapes of the distributions of this quantity for the different repeat sizes are similar to those in Zhivotovskyet al. (2003),
who used the subset of the loci used in this study, and to those of the averages ofnain Figure 2.
Although the distributions of the average ofnaseem
to be somewhat different among different types of STR loci of different repeat sizes,Hvalues are similar for all three types of loci. Considering the large standard devi-ation associated with thenaand relatively small numbers
of dinucleotide (45) and trinucleotide (175) repeat loci, we decided to use all 783 loci together in the analysis of this study.
The values ofHare the highest for the African popu-lations and the smallest for the Oceanian and American populations (Table 1; for the heterozygosity values for all 53 populations see supplemental Tables 1–4 at http://www.genetics.org/supplemental/). The values of H are likely to reflect the large population size of Africans and the small population size of Oceanians and Americans.nais also smaller in these populations. But
thenavalues of the Middle Eastern and Central/South
Asian populations are higher than those of the African population. This could be due to the recent gene admixture that occurred in these regions.
Efficiency of constructing phylogenetic trees using
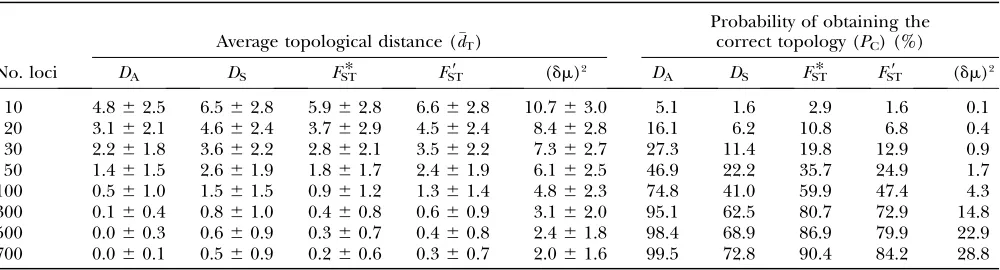
different distance measures:Table 2 shows the average
topological distance (dT) (measure of the extent of
difference in topologies of constructed trees and the model tree) and the probabilities (PC) of obtaining the
topology of the tree of 12 populations constructed from the 783 loci (model tree) (Figure 1) for the cases of 10, 20, 30, 50, 100, 300, 500, and 700 loci computed by the nonparametric bootstrap approach (seematerials and methods).
Among the distance measures compared,DA
gener-ally shows the smallest dT and the highest PC-values.
FollowingDA,FST* has the second smallest dT and the
second highestPC.dTandPC-values ofDSandFST9 are
similar to each other, butFST9 has slightly lowerdTand
higherPC-values thanDS. (dm)2shows much higherdTand
is because (dm)2has low efficiency in phylogeny construc-tion because of its large sampling error (Zhivotovsky
and Feldman1995; Takezakiand Nei1996; Goldstein
and Pollock1997; Zhivotovskyet al. 2001). With 700
loci, while thePC-value ofDAbecomes almost 100% and PC-values ofFST* ,DS, andFST9 are.70%, thePC-value of
(dm)2is only,30%.
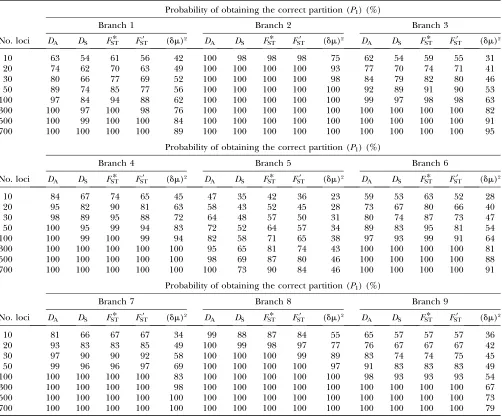
Table 3 shows the probabilities (P1) of obtaining the
grouping of the populations (partitions) separated by each interior branch of the model tree (Figure 1). For example, at branch 1 of the model tree the populations are separated into Yoruba and Mandenka and the rest. The P1-value at branch 1 is a frequency that a branch
separating populations into Yoruba and Mandenka and the rest appeared in a constructed tree in the nonpara-metric bootstrap replications. The general tendency of relative efficiencies of the different distance measures at each interior branch is similar to that observed indTand PCas described above.DAhas the highest efficiency in
phylogeny construction among all the distance meas-ures examined,FST* has the second highest,DSandFST9
have similar values, and (dm)2has much lower efficiency than the other distance measures. However,FST* has the
highest P1-value and the P1-value of DA becomes the
second highest at branch 6.
P1-values at the branches that separate the clusters of
the four geographic regions require smaller numbers of loci to reach high values (e.g., 90%) than those at the branches within the major geographic clusters.P1-values
forDA,DS,FST* , andFST9 are already$98% with 10 loci
at branch 2 that separates Africans and non-Africans and$97% with 20 loci at branch 8 for the cluster of Americans. However,P1-values of the four distance
mea-sures for the clusters of Europeans and East Asians require 50 and 100 loci to reach 90%.P1-values of (dm)2
are lower than those for the other distances, but they reach 90% with 20 loci at the branch for the African cluster and with 50 loci for the American cluster. P1
-values of (dm)2for the cluster of East Asians and for the clusters of East Asians and Americans need 300–500 loci to reach 90%. P1-values ofDA, DS,FST* , and FST9 at the
branches within the clusters of the four geographic regions become$90% with 100 loci at branches 3 and 9 and with 300 loci at branch 1. P1-values at branch 5
become 95% forDA with 300 loci, but 70–80% forDS, FST* , andFST9 . TheP1-value of (dm)2at branch 5 is,50%
even with 700 loci and needs$500 loci to reach 90% at the other branches within the clusters of the major geographic regions.
Means and sampling errors of distance measures:
The efficiency of constructing phylogenetic trees by distance measures depends on their linearity with time and sampling errors (Goldstein and Pollock 1994;
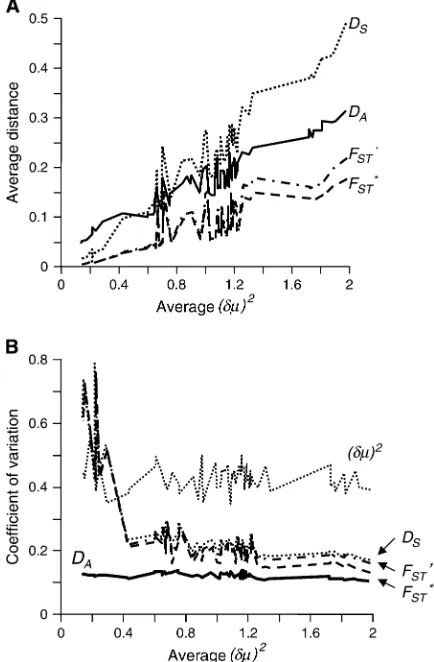
Tajimaand Takezaki1994; Takezakiand Nei1996).
Therefore, we examined the means and CVs of the distance measures. Figure 3 shows the means and CVs of the distance measures of each pair of the 12 populations (Figure 1) in relation to the mean (dm)2computed for the same pair of populations in the abscissa by choosing 30 loci in the nonparametric bootstrap approach. In the data set used in this study, the assumptions for the linear increase of the expected (dm)2 with time apparently do not hold. The different heterozygosity values for the populations of the different geographic origins (Table 1) indicate that population sizes have changed some times. Further, the mutational pattern of microsatellite loci does not strictly follow the SMM (DiRienzoet al.
1994; Ellegren2000; Xuet al.2000; Huanget al.2002;
Ellegren2004). The other distance measures increase
approximately linearly in short-term evolution, but lose the linearity with time quickly under the SMM (Takezaki
and Nei 1996). Therefore, the means and CVs of the
distance measures are shown in relation to the mean (dm)2in the abscissa.
The slope of the meanDSis the steepest among those
of DA, DS,FST* , andFST9 . When the mean (dm)2 in the
abscissa is close to zero, the meanDSis smaller than that
of DA, but slightly larger than those of FST* and FST9
(Figure 3A). However, as the average (dm)2increases, the mean DS becomes larger than the mean DA and
becomes the largest of the means of the four distance measures. The slopes of mean DA, FST* , and FST9 are TABLE 2
Average topological distance and the probabilities of obtaining the correct tree topology for different distance measures
Average topological distance (dT)
Probability of obtaining the correct topology (PC) (%)
No. loci DA DS FST* FST9 (dm)2 DA DS FST* FST9 (dm)2
10 4.862.5 6.562.8 5.962.8 6.662.8 10.763.0 5.1 1.6 2.9 1.6 0.1
20 3.162.1 4.662.4 3.762.9 4.562.4 8.462.8 16.1 6.2 10.8 6.8 0.4
30 2.261.8 3.662.2 2.862.1 3.562.2 7.362.7 27.3 11.4 19.8 12.9 0.9
50 1.461.5 2.661.9 1.861.7 2.461.9 6.162.5 46.9 22.2 35.7 24.9 1.7
100 0.561.0 1.561.5 0.961.2 1.361.4 4.862.3 74.8 41.0 59.9 47.4 4.3
300 0.160.4 0.861.0 0.460.8 0.660.9 3.162.0 95.1 62.5 80.7 72.9 14.8
500 0.060.3 0.660.9 0.360.7 0.460.8 2.461.8 98.4 68.9 86.9 79.9 22.9
similar to one another, although the meanDAis much
larger than those ofFST* andFST9 for all the (dm)2values.
Means ofFST* andFST9 are similar to each other, but the
meanFST9 is larger than that ofFST* particularly for the
larger abscissa values.
CVs of (dm)2are much higher than those of the other distance measures (Figure 3B) as expected from theoret-ical and computer simulation studies (Zhivotovskyand
Feldman1995; Takezakiand Nei1996; Zhivotovsky
et al.2001). By contrast,DAhas the smallest CVs for all
the abscissa values. CVs ofDS,FST* , andFST9 are
inter-mediate between those of (dm)2andD
A, although CVs of
these three distance measures are extremely high for small abscissa values (,0.2). CVs ofDS,FST* , andFST9 are
very similar to one another, butDS generally has the
largest CVs of the three,FST9 has the second largest CVs,
and CVs ofFST* are the smallest.
In general, CV values are inversely related to thePC
-values of the distance measures. DA with the highest PC-values has the smallest CVs, andFST* with the
second-highest PC-values has the second-smallest CVs. (dm)2
that has the largest CVs shows the lowest PC-values.
Thus, as far as the data set used in this study is con-cerned, the relative values of CVs of the distance mea-sures are a main factor that affects their performance in constructing phylogenies, and the effect of the linear increase of the distance measure with time seems minor.
Sample size: To investigate the effect of sample size
on the efficiency of phylogeny construction, we con-structed phylogenetic trees for the 12 populations by sampling a different number of individuals (n) per locus. Averagenvalues of the 783 loci are 20–45 for most of the populations (see supplemental Tables 1–4 at http://www.genetics.org/supplemental/). Average n TABLE 3
Probabilities (P1) of obtaining the correct partitions for different distance measures
Probability of obtaining the correct partition (P1) (%)
Branch 1 Branch 2 Branch 3
No. loci DA DS FST* FST9 (dm)2 DA DS FST* FST9 (dm)2 DA DS FST* FST9 (dm)2
10 63 54 61 56 42 100 98 98 98 75 62 54 59 55 31
20 74 62 70 63 49 100 100 100 100 93 77 70 74 71 41
30 80 66 77 69 52 100 100 100 100 98 84 79 82 80 46
50 89 74 85 77 56 100 100 100 100 100 92 89 91 90 53
100 97 84 94 88 62 100 100 100 100 100 99 97 98 98 63
300 100 97 100 98 76 100 100 100 100 100 100 100 100 100 82
500 100 99 100 100 84 100 100 100 100 100 100 100 100 100 91
700 100 100 100 100 89 100 100 100 100 100 100 100 100 100 95
Probability of obtaining the correct partition (P1) (%)
Branch 4 Branch 5 Branch 6
No. loci DA DS FST* FST9 (dm)2 DA DS FST* FST9 (dm)2 DA DS FST* FST9 (dm)2
10 84 67 74 65 45 47 35 42 36 23 59 53 63 52 28
20 95 82 90 81 63 58 43 52 45 28 73 67 80 66 40
30 98 89 95 88 72 64 48 57 50 31 80 74 87 73 47
50 100 95 99 94 83 72 52 64 57 34 89 83 95 81 54
100 100 99 100 99 94 82 58 71 65 38 97 93 99 91 64
300 100 100 100 100 100 95 65 81 74 43 100 100 100 100 81
500 100 100 100 100 100 98 69 87 80 46 100 100 100 100 88
700 100 100 100 100 100 100 73 90 84 46 100 100 100 100 91
Probability of obtaining the correct partition (P1) (%)
Branch 7 Branch 8 Branch 9
No. loci DA DS FST* FST9 (dm)2 DA DS FST* FST9 (dm)2 DA DS FST* FST9 (dm)2
10 81 66 67 67 34 99 88 87 84 55 65 57 57 57 36
20 93 83 83 85 49 100 99 98 97 77 76 67 67 67 42
30 97 90 90 92 58 100 100 100 99 89 83 74 74 75 45
50 99 96 96 97 69 100 100 100 100 97 91 83 83 83 49
100 100 100 100 100 83 100 100 100 100 100 98 93 93 93 54
300 100 100 100 100 98 100 100 100 100 100 100 100 100 100 67
500 100 100 100 100 100 100 100 100 100 100 100 100 100 100 73
values of the 12 populations in the model tree (Figure 1) are 25 except for Cambodian and Colombian pop-ulations whose average n values are 11.5 and 12.5, respectively.
We chose 5–25 individuals per locus for each pop-ulation at random without replacement and recalcu-lated the allele frequencies and computed PC for a
different number of loci (10–700). If the number of individuals at a locus was,5–25, we used all the available samples. Table 4 showsPC-values forDAdistance. Note
that the result of the other distance measures was essentially the same as that forDA(data not shown). As
expected for the data of high heterozygosities (0.6–0.8) (Table 1 and supplemental Tables 1–4 at http://www. genetics.org/supplemental/) (Takezakiand Nei1996),
the effect of sample size onPC-values is quite large. By
increasingnfrom 5 to 15,PC-values increase to a great
extent. In the case of 300–700 lociPC-values are.80–
90% forn¼15–25, butPC-values are 40–60% forn¼5. It
should be noted, however, that the number of loci generally has a larger effect onPC-values than the sample
size whenn$15.
DISCUSSION
Using microsatellite data of human populations, this study showed that DA distance is the most efficient in
obtaining a correct branching pattern, followed byFST* , FST9 , andDS, and that (dm)2has much lower efficiency
than the other distance measures. This result is con-sistent with the previous computer simulation study, although efficiency ofFST9 was not examined (Takezaki
and Nei 1996). DA, DS, FST* , and FST9 were originally
developed for classical genetic markers that the IAM can apply. Mean values for these distance measures approx-imately increase linearly with time after separation of the two populations for a small 2vt value (expected number of mutations) even under the SMM, but the rate of the increase slows down for large 2vt values. Theoretically, (dm)2 is expected to be proportional to mutation rate under the SMM. However, (dm)2 has a much larger sampling error than the other distance measures. As far as the data examined in this study are concerned, the extent of sampling error is a major factor that affects the efficiencies of phylogenetic con-struction of the distance measures.
ThePC-values for the actual STR loci obtained in this
study are comparable to those in the case ofH¼0.8 and the largest 2vtbetween populations¼0.56 in the com-puter simulation with the SMM (Takezaki and Nei
1996). They tend to be lower than those in the simu-lation for all the distance measures. But PC-values of
(dm)2are particularly lower in this data analysis than in the simulation in comparison to the other distance mea-sures. The mutational pattern of STR loci is believed to roughly follow the SMM. However, there are irregular changes such as a large number of nucleotide repeat changes or disruption of nucleotide repeats, the con-straints for the repeat number, and the asymmetric mutation rate for contraction and expansion of the
Figure3.—Relationships of the means and coefficients of variation of different distance measures in relation to the mean (dm)2. Average distance values and the coefficients of
variation were computed for the 12 populations in Figure 1 by choosing 30 loci in each replication of the nonparametric bootstrap approach. (A) Means. (B) Coefficients of variation.
TABLE 4
The probabilities of obtaining the correct tree topology (PC) (%) for different sample sizes
Diploid sample size (n)
No. loci 5 10 15 20 25
10 0 2 3 4 5
20 2 6 10 14 15
30 4 12 19 23 26
40 6 18 27 33 37
50 8 23 32 41 46
100 21 44 58 67 71
200 34 64 79 84 87
300 44 74 86 90 92
500 56 83 89 95 97
700 61 88 93 96 98
allele (DiRienzoet al. 1994; Goldsteinand Pollock
1997; Kruglyaket al.1998) at STR loci. Furthermore,
the mutation rates vary among the STR loci (Ellegren
2004). Such complication of the mutational pattern in these loci may have affected the efficiency of (dm)2in phylogeny construction. Cooper et al. (1999) found
that the standard deviation of (dm)2is much larger than the expected value (Zhivotovskyand Feldman1995;
Goldstein and Pollock 1997) by studying 213
di-nucleotide STR loci of four human populations. At any rate, the present study showed that (dm)2is not efficient in reconstructing phylogenetic trees of populations even if a large number of loci are used.
We already have a DOS version of the computer pro-gram (POPTREE) for constructing phylogenetic trees for STR data with bootstrapping. It is available free of charge from http://www.bio.psu.edu/People/Faculty/ Nei/Lab/software.htm. We are currently in the process of converting the program to a Windows version.
LITERATURE CITED
Cavalli-Sforza, L. L., and A. W. Edwards, 1967 Phylogenetic
anal-ysis. Models and estimation procedures. Am. J. Hum. Genet.19:
233–257.
Cooper, G., W. Amos, R. Bellamy, M. R. Siddiqui, A. Frodsham
et al., 1999 An empirical exploration of the (dm)2genetic
dis-tance for 213 human microsatellite markers. Am. J. Hum. Genet.
65:1125–1133.
DiRienzo, A., A. C. Peterson, J. C. Garza, A. M. Valdes, M. Slatkin
et al., 1994 Mutational processes of simple-sequence repeat loci in human populations. Proc. Natl. Acad. Sci. USA91:3166–3170. Ellegren, H., 2000 Heterogeneous mutation processes in human
microsatellite DNA sequences. Nat. Genet.24:400–402. Ellegren, H., 2004 Microsatellites: simple sequences with complex
evolution. Nat. Rev. Genet.5:435–445.
Goldstein, D. B., and D. D. Pollock, 1994 Least squares
estima-tion of molecular distance–noise abatement in phylogenetic re-construction. Theor. Popul. Biol.44:219–226.
Goldstein, D. B., and D. D. Pollock, 1997 Launching
microsatel-lites: a review of mutation processes and methods of phylogenetic inference. J. Hered.88:335–342.
Goldstein, D. B., A. RuizLinares, L. L. Cavalli-Sforzaand M. W.
Feldman, 1995 Genetic absolute dating based on
microsatel-lites and the origin of modern humans. Proc. Natl. Acad. Sci. USA92:6723–6727.
Huang, Q. Y., F. H. Xu, H. Shen, H. Y. Deng, Y. J. Liu et al.,
2002 Mutation patterns at dinucleotide microsatellite loci in humans. Am. J. Hum. Genet.70:625–634.
Kalinowski, S. T., 2002 Evolutionary and statistical properties of
three genetic distances. Mol. Ecol.11:1263–1273.
Kimura, M., and J. F. Crow, 1964 The number of alleles that can be
maintained in a finite population. Genetics49:523–538. Kruglyak, S., R. T. Durrett, M. D. Schug and C. F. Aquadro,
1998 Equilibrium distributions of microsatellite repeat length resulting from a balance between slippage events and point mu-tations. Proc. Natl. Acad. Sci. USA95:10774–10778.
L , B. D., 1972 Selection in finite populations with multiple al-leles. III. Genetic divergence with centripetal selection and mu-tation. Genetics70:475–490.
Nei, M., 1972 Genetic distance between populations. Am. Nat.106:
283–291.
Nei, M., 1973 Analysis of gene diversity in subdivided populations.
Proc. Natl. Acad. Sci. USA70:3321–3323.
Nei, M., 1987 Molecular Evolutionary Genetics.Columbia University
Press, New York.
Nei, M., and S. Kumar, 2000 Molecular Phylogenetics and Evolution.
Oxford University Press, New York.
Nei, M., F. Tajimaand Y. Tateno, 1983 Accuracy of estimated
phy-logenetic trees from molecular data. II. Gene frequency data. J. Mol. Evol.19:153–170.
Ohta, T., and M. Kimura, 1973 A model of mutation appropriate to
estimate the number of electrophoretically detectable alleles in a finite population. Genet. Res.22:201–204.
Ramachandran, S., O. Deshpande, C. C. Roseman, N. A. Rosenberg,
M. W. Feldmanet al., 2005 Support from the relationship of
genetic and geographic distance in human populations for a serial founder effect originating in Africa. Proc. Natl. Acad. Sci. USA102:15942–15947.
Reynolds, J., B. D. Weirand C. C. Cockerham, 1983 Estimation of
the coancestry coefficient: basis for a short-term genetic distance. Genetics105:765–779.
Robinson, D. F., and L. R. Foulds, 1981 Comparison of
phyloge-netic trees. Math. Biosci.53:131–147.
Rosenberg, N. A., J. K. Pritchard, J. L. Weber, H. M. Cann, K. K.
Kiddet al., 2002 Genetic structure of human populations.
Sci-ence298:2381–2385.
Rosenberg, N. A., S. Mahajan, S. Ramachandran, C. Zhao, J. K.
Pritchardet al., 2005 Clines, clusters, and the effect of study
design on the inference of human population structure. PLoS Genet.1:e70.
Rousset, F., 1997 Genetic differentiation and estimation of gene
flow fromF-statistics under isolation by distance. Genetics145:
1219–1228.
Saitou, N., and M. Nei, 1987 The neighbor-joining method: a new
method for reconstructing phylogenetic trees. Mol. Biol. Evol.4:
406–425.
Slatkin, M., 1993 Isolation by distance in equilibrium and
non-equilibrium populations. Evolution47:264–279.
Slatkin, M., 1995 A measure of population subdivision based on
microsatellite allele frequencies. Genetics139:457–462. Tajima, F., and N. Takezaki, 1994 Estimation of evolutionary
dis-tance for reconstructing molecular phylogenetic trees. Mol. Biol. Evol.11:278–286.
Takezaki, N., and M. Nei, 1996 Genetic distances and
reconstruc-tion of phylogenetic trees from microsatellite DNA. Genetics
144:389–399.
Xu, X., M. Peng, Z. Fangand X. Xu, 2000 The direction of
micro-satellite mutations is dependent upon allele length. Nat. Genet.
24:396–399.
Zhivotovsky, L. A., and M. W. Feldman, 1995 Microsatellite
variabil-ity and genetic distances. Proc. Natl. Acad. Sci. USA92:11549– 11552.
Zhivotovsky, L. A., D. B. Goldsteinand M. W. Feldman, 2001 Genetic
sampling error of distance (dm)2and variation in mutation rate
among microsatellite loci. Mol. Biol. Evol.18:2141–2145. Zhivotovsky, L. A., N. A. Rosenberg and M. W. Feldman,
2003 Features of evolution and expansion of modern humans, inferred from genomewide microsatellite markers. Am. J. Hum. Genet.72:1171–1186.