Noise Reduction in Real Time Images Using
Filtering Techniques
R.Suganya1, Dr.M.Jagadeeswari2
Student, Department of ECE (PG), Sri Ramakrishna Engineering College, Coimbatore, India1
Head of the Department, Department of ECE (PG), Sri Ramakrishna Engineering College, Coimbatore, India2
ABSTRACT: Speckle noise is a type of granular noise that inherently exists in and degrades the quality of ultrasound images. Speckle noise tends to reduce the resolution and contrast thereby degrades the diagnostic accuracy of this modality. It was one of the most important processes to enhance the quality of ultrasound images. This paper proposed comparison of four types of filters such as Edge Enhanced Modified Lee filter, Modified Kuan filter, Fast Bilateral filter, Adaptive centre pixel Weighted Median Exponential filter (ACPWMEF). These filters are tested on Ultrasound image and Synthetic Aperture radar image. Effectiveness of the proposed filter is compared on the basis of Structure Similarity Index (SSI), Image Quality Index (IQI), Peak Signal to Noise Ratio (PSNR), Root Mean Square Error (RMSE), and Edge Preservation Factor (EPF) by using Matlab tool R2013a. The experimental results demonstrate that the proposed ACPWMEF can reduce the speckle noise effectively without blurring the edges and gives better qualitative and quantitative results compared to Existing Filtering Techniques.
KEYWORDS: Structure similarity index, Effective number of looks, Pearson correlation coefficient, EEMLF, MKF, FBF, ACPWMEF.
I.INTRODUCTION
In medical imaging, ultrasound imaging has been viewed as non-invasive and most prevalentdiagnostic tool for imaging bones, organs and soft tissue structures of the human body. This is often considered due to its non-ionizing radiations with minimum cost. But this imaging has major disadvantage of having Speckle noise. Speckle in ultrasound imaging is caused by the interference of energy from transducer aperture, too small to be resolved by imaging system. The presence of speckle results in poor image quality and makes it tough for human interpretation and diagnosis. The intent of speckle reduction is to remove the unwanted speckle pattern without reducing the detail in the ultrasound image. The section (II) introduces Speckle noise issues and its mathematical description. The section (III) contains overview and comparison of proposed filters.
II. SPECKLE NOISE MODEL
Speckle noise is a common phenomenon in ultrasound images. Speckle noise become apparent from random interference between the coherent wave’s returns from scatters present on surface. Presence of the speckle noise in ultrasound images is undesirable.Therefore, the speckle noise filtering is important pre-processing step.Mathematically, the speckle noise can be represented as pure multiplicative model,
I (t) = R (t). U (t) (1)
III.RELATED WORK
A.EDGE ENHANCED MODIFIED LEE FILTER (EEMLF)
EEMLF is based on multiplicative speckle model and it preserves the edges using local statistics.Lee filter smoothens and removes noise only in High variance areas. Smoothening cannot be carryout in Low (or) constant areas.To overwhelm this, Ratio based Edge detectorand Iterative filter is used.For edge detection Maximum strength Pruned Edge Ratio of average detector is used.In MSP-RoA all the pixels are belongs to either two classes such as Valid region and Invalid region .The process starts with Centre pixel in filtering window, it grows uni-directionally in all 8-directions.A threshold of is set in all 8-directions,once the pixel reaches the particular threshold point it will stop growing,it is considered as valid pixel.
Fig.1 Block diagram of EEMLF
Fig.1 shows the Block diagram of Edge enhanced Modified Lee filter. In this,valid pixels only further used for statistical calculations like mean and Variance.Its advantage is smoothens and sharpens the edges.For automatic updation iterative filter is used.Every iteration MSP-RoA generates new edge map and it saves computational time.
B.MODIFIED KUAN FILTER (MKF)
Kuan filter converts the multiplicative noise model into signal dependent additive noise model. Here minimum mean square error (MMSE) and weighting factor criterion is applied.
Rˆ (t) = I (t) ×W (t) + I ^ (t) × [1-W (t)] (2)
Where R (t) is de-noised image, I (t) is the original image multiplied with weighted function W (t).
Fig.2 shows the Block Diagram of Modified Kuan Filter, which consists of Weighted and Sigmoid Weighted Function Blocks.
Weighted function is applicable only to Homogeneous regions and for Heterogeneous regions Sigmoid weighted
function
W1 (t) is used.C
2u, 2I
C
are called as Filter coefficients.2 2 2 1 ) ( 1 ) ( u I u C t C C t W
(3)
0.5)) -) exp(-k(W(t 1 1 ) ( W1 t (4)
C. FAST BILATERAL FILTER
Bilateral filters are broadly used in computer vision and digital imaging applications such as de-noising, video abstraction, optical-flow estimation etc. Its performs good smoothening and edge preserving characteristics. It is characterized using Domain filtering and Range filtering.
BF= 1/Wt [D (p-q) * R (p-q)] (5)
Where, Wt is the weighted function which is the summation of all pixel’s weight .p, q is the range.
Fig.3 Block diagram of Fast Bilateral Filter
D.ADAPTIVE CENTER PIXEL WEIGHTED MEDIAN EXPONENTIAL FILTER(ACPWMEF)
It uses the variation in the magnitude of filter centre pixel with the noise variance present in the image to achieve high performance.It uses the estimated speckle noise variance present in an image to vary the centre pixel of the filter for effective filtering. Initially image is normalized and natural logarithm is taken for both original and noisy image in order to smoothen the image and convolution is performed to retain the sharp edges followed by MSE calculation. Finally inverse logarithm is taken to get a de-noised image.
Fig.4 Block diagram of ACPWMEF
Fig.4 shows the Block Diagram of ACPWMEF.Normalize the noisy image, then compute the natural logarithm of the normalized noisy image. Estimate the speckle noise variance present in the noisy image by using the estimated noise variance to compute the filter kernel. Next compute the convolution function between the natural logarithm of the normalized noisy image and the computed filter kernel. Finally, compute the inverse natural logarithm of the output from to obtain the filtered image.
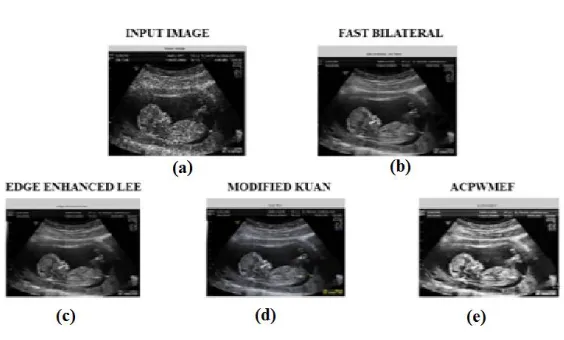
IV. SIMULATION RESULTS
Fig.5 Simulation Results of proposed Filters. (a)Original Image (b) FBF’s Output Ultrasound Baby image (c) EEMLF’s Output Image (d) Modified kuan Filter’s output (e) ACPWMEF’s Output.
V. QUALITY MEASURES
COMPARISION OF FILTERS (ULTRASOUND BABY IMAGE)
Various Filters output values are obtained by the following Quality metrices.
TABLE I
Table.1 shows the Quality metrices of various denoising filters, among these Adaptive Centre Pixel Weighted Median Exponential Filter gives better performance results.
VI. CONCLUSION
The proposed filtering technique Adaptive Centre Pixel Weighted Median Exponential Filter for Speckle noise removal is implemented in Matlab and tested with different Ultrasound image using different types of Quality metrices and producing promising results. This method reduces the noise in different type of Realtime images efficiently. The output of this method has been comparedwith other filtering methods and shows superior performance. In future work the proposed efficient filter is going to implement in FPGA kit.
REFERENCES
[1]Yi-Xiang Lua, Qing-Wei Gaoa*, De-Xiang Zhanga, Dong Suna, “Directionlet-Based Bayesian Filter for Image Despeckling”, A School of Electrical Engineering and Automation of Anhui University, Hefei 230039, 2013 China.
[2] Yongjian Yu and Scott T. Acton, Senior Member, IEEE, “Speckle Reducing Anisotropic Diffusion”, IEEE Transactions on Image Processing, Vol. 11, No. 11, November 2014.
[3] Juan L. Mateo a, Antonio Fernández-Caballero, “Finding out general tendencies in speckle noise reduction in ultrasound images”,2013. [4] Pierrick Coup, Pierre Hellier, Charles Kervrann and Christian Barillot, University of Rennes, France“NonLocal Means-based Speckle Filtering For Ultrasound Images”, IEEE Transaction on Image Processing 2013; 18(10):2221.
[5] A. Buades B. Coll, and J. M. Morel, “A review of image denoising algorithms, with a new one,” Multiscale Model. Simul.vol. 4, no. 2, pp. 490–530, 2005.
[6]Dr.M.Jagadeeswari (2015) Real Time Video Processing using ZYNQ 7000 SOC”, International Journal of Applied Engineering Research, Vol 10, No.1.pp.734-738, ISSN: 0973-4562.
[7] C. Kervrann, J. Boulanger, and P. Coupé, “Bayesian non local means filter, image redundancy and adaptive dictionaries noise removal,” in
METRICES FILTERS
EEMLF MKF FBF ACPWMEF
MSE 10.23 50.60 22.8 0.332
RMSE 3.198 7.11 4.77 0.556
SNR 0.356 0.187 0.216 0.193
PSNR 35.875 34.792 86.42 117.9
ASNR 1.57E+5 1.54E+5 1.38E+6 1.28E+7
AD 0.09877 0.0421 0.0231 0.0196
Proc. Conf. Scale-Space and Variational Methods, Italy, Jun.2007, pp. 520–532.
[8] P. C. Tay, S. T. Acton, and J. A. Hossack, “A stochastic approach to ultrasound despeckling,” in Proc. 3rd IEEE Int. Symp. Biomedical Imaging: Nano to Macro, 2006, pp. 221–224.
[9] B. S. Kramer, C. D. Berg, D. R. Aberle, and P. C. Prorok, “Lung cancer screening with low-dose helical CT: results from the National Lung Screening Trial (NLST).,” Journal of medical screening, vol. 18, no. 3, p. 110, Jan. 2011
[10]S. Abramov, V. Abramova, V. Lukin, N. Ponomarenko, B. Vozel, K. Chehdi, K. Egiazarian, and J. Astola, “Methods for Blind Estimation ofSpeckle Variance in SAR Images: Simulation Results and Verification for Real-Life Data,” INTECH Computational and numerical Simulations, 2010