ABSTRACT
WANG, YUN. Performance Analysis of Smart Space with Indoor Localization Capabilities. (Under the direction of Michael Devetsikiotis.)
Smart spaces with indoor localization capabilities can recognize the users and interact
with them under the Artificial Intelligence (AI) algorithms. The intelligent, interactive systems
may replace the non-interactive systems around us within the next decade, enriching the overall
indoor experience, and changing many areas of our lives. The user experience greatly depends
on the performance of the smart space, which can be affected by the inaccurate indoor location
estimation. In this thesis, we try to quantify the indoor localization precision requirements to
achieve acceptable user experience in smart spaces by varying the user arrival rate and the size
of the smart space. We conduct a comprehensive survey on various indoor localization
solutions, present the implementation of a cross-platform WLAN indoor localization system,
and analyze the dependency between the indoor localization precision and smart space
performance. Various precision levels summarized from the localization survey are used in the
analysis. We furthermore take this dependency into account for optimizing smart space
© Copyright 2014 Yun Wang
Performance Analysis of Smart Space with Indoor Localization Capabilities
by Yun Wang
A thesis submitted to the Graduate Faculty of North Carolina State University
in partial fulfillment of the requirements for the degree of
Master of Science
Computer Engineering
Raleigh, North Carolina
2014
APPROVED BY:
_______________________________ ______________________________ Dr. Harry Perros Dr. R. Michael Young
________________________________ Dr. Michael Devetsikiotis
BIOGRAPHY
Yun Wang was born in Shanxi Province, China in 1989. She graduated from Beijing University
of Posts and Telecommunications and Queen Mary, University of London in June 2011 with
two Bachelor of Engineering degrees in Telecommunications Engineering with Management.
Following that, she began the study for pursuing her Master of Science degree in Computer
Engineering at North Carolina State University under the guidance of Dr. Michael
Devetsikiotis starting in August 2011. Yun is currently working towards her thesis defense and
ACKNOWLEDGMENTS
I would like to express sincere appreciation to my advisor, Dr. Michael Devetsikiotis for giving
me the opportunity to work with him and for his persistent guidance, tremendous help and
encouragement in my research work. I would also like to thank Dr. Harry Perros and Dr.
Michael Young for expressing interest in my work and for serving on my thesis committee.
I would like to thank my friends and colleagues: Kostas, Andrew, J., Shalini, and Ioannis for
their help and inspiration along the way. I would also like to thank Dr. Eric Rotenberg, Dr.
Mihail Sichitiu, Dr. Huiyang Zhou, Dr. Yan Solihin, Shirley Rodgers, Maurice York, and Scott
Williams for the opportunities to work with them, it’s been a pleasure. Many thanks to Ms.
Cailan for her kindly help on the administrative issues for the last two semesters.
TABLE OF CONTENTS
LIST OF TABLES ……….………... vii
LIST OF FIGURES ……… viii
CHAPTER 1 Introduction ... 1
1.1 Motivation ... 1
1.2 Introduction to Smart Spaces ... 3
1.2.1 Smart Space Architecture ... 3
1.2.2 Resource Management ... 4
1.2.3 Smart Space Performance Metrics ... 8
1.2.4 User Privacy ... 9
1.3 Introduction to Indoor Localization ... 10
1.3.1 Indoor Localization Solutions ... 10
1.3.2 Effect of Indoor Localization ... 13
1.3.3 Indoor Localization Performance Metrics ... 15
1.4 Objectives ... 17
1.5 Overview of Thesis ... 18
CHAPTER 2 Indoor Localization ... 19
2.1 Overview ... 19
2.2 Wireless-Based Solutions ... 20
2.2.1 Indoor Wireless Environment ... 20
2.2.2 Wireless-Based Localization Algorithms ... 22
2.2.2.1 Proximity ... 23
2.2.2.2 Distance Measurements (Lateration) ... 23
2.2.2.3 Angle Measurements (Angulation) ... 25
2.2.2.4 Fingerprinting ... 26
2.2.3 Survey of Wireless-Based Solutions ... 32
2.2.3.2 UWB (Ultra-wideband) ... 33
2.2.3.3 WLAN ... 34
2.2.3.4 Bluetooth ... 35
2.2.3.5 Others... 36
2.3 Sensor-Based Solutions ... 37
2.3.1 Sensors ... 37
2.3.2 Survey of Sensor-Based Solutions ... 40
2.4 Ambience-Based Solutions ... 41
2.4.1 Light and Acoustic Analysis ... 42
2.4.2 Landmarks... 42
2.5 Summary ... 43
CHAPTER 3 WLAN Localization Implementation ... 46
3.1 System Design ... 46
3.1.1 Server and Database Backend ... 47
3.1.2 App Frontend ... 47
3.2 Localization Algorithm ... 48
3.2.1 Calibration Phase ... 48
3.2.2 Localization Phase ... 50
CHAPTER 4 Smart Space Simulation and Case Study ... 53
4.1 Simulation Setup ... 53
4.1.1 Indoor Localization Error ... 54
4.1.2 Resource Management in Smart Space... 56
4.2 The Way Finding Case Study... 58
4.2.1 Description of the Case Study... 58
4.2.2 Assumptions for the Simulations ... 59
4.2.3 Simulation Inputs ... 60
4.2.4 Performance Metrics ... 61
4.3 Simulation Results and Smart Space Performance Analysis ... 62
4.3.2 Average Time Spent Per Room ... 64
4.3.3 System Blocking Rate ... 66
4.4 Cost Optimization ... 69
4.4.1 Small-Size Smart Spaces ... 71
4.4.2 Large-Size Smart Spaces ... 74
4.5 Summary ... 76
CHAPTER 5 Conclusion ... 77
REFERENCES ………. 79
APPENDICES ……….. 82
Appendix A Code Snippet for Collecting Sensor Data on Android ………….………… 83
LIST OF TABLES
Table 2.1 Comparison of wireless-based indoor localization algorithms ... 31
Table 2.2 Indoor localization solutions ... 45
Table 4.1 Various grid size used in the simulation ... 60
Table 4.2 Arrival rate vs. Average inter-arrival time for simulation ... 60
Table 4.3 Gaussian-distributed location estimation ... 61
Table 4.4 Room mis-prediction rate (different localization precision and grid size) ... 63
Table 4.5 Average time spent per room (different localization precision and grid size) ... 65
Table 4.6 System blocking rate (M = 5, N = 5) ... 66
Table 4.7 System blocking rate (M = 10, N = 10) ... 66
Table 4.8 System blocking rate (M = 30, N = 30) ... 67
Table 4.9 System blocking rate (M = 50, N = 50) ... 67
Table 4.10 Indoor localization solutions and their precisions ... 70
Table 4.11 Parameters of indoor localization solutions ... 71
Table 4.12 Costs for indoor localization solutions (M = 5, N = 5) ... 72
Table 4.13 Results for cost optimization (M = 5, N = 5) ... 72
Table 4.14 Costs for indoor localization solutions (M = 10, N = 10) ... 73
Table 4.15 Results for cost optimization (M = 10, N = 10) ... 74
Table 4.16 Costs for indoor localization solutions (M = 30, N = 30) ... 74
LIST OF FIGURES
Figure 1.1 Smart space architecture ... 4
Figure 1.2 Key components in resource management ... 5
Figure 1.3 Overview of current wireless-based indoor localization technologies ... 12
Figure 1.4 Illustration of the effect of indoor localization, in east wing of EBII, NCSU ... 14
Figure 2.1 Distribution of RSSI at a particular point regarding one AP (MAC address as D8:C7:C8:38:22:C0) and its Gaussian approximation, when user is not present . 21 Figure 2.2 Classification of wireless-based indoor localization algorithms ... 22
Figure 2.3 Indoor localization using TOA ... 24
Figure 2.4 Indoor localization using AOA ... 26
Figure 2.5 Sensor coordinate system (relative to a device) used by Android Sensor API ... 38
Figure 2.6 Acceleration signatures of 14 steps ... 39
Figure 3.1 WLAN localization system design ... 46
Figure 3.2 A screenshot of SignalStrengthCollector (2nd floor of Hunt Library, NCSU) ... 49
Figure 3.3 Database UML diagram ... 50
Figure 3.4 Flowchart of the localization algorithm ... 52
Figure 4.1 The grid layout of smart space simulation ... 54
Figure 4.2 Indoor localization error range ... 55
Figure 4.3 Room mis-prediction rate vs. Standard deviation and grid size ... 64
Figure 4.4 Average time spent per room vs. Standard deviation and grid size ... 65
CHAPTER 1
Introduction
Our daily-life activities involve spending an increasingly high amount of time indoors, either
at home or at work, so improving the quality of indoor life is very important. For decades now,
people have been predicting the advent of the smart space, where human activities can control
and activate various ambient functions remotely and automatically [1], with the use of sensing
devices deployed in the space and the advanced technologies from Artificial Intelligence. The
intelligent, interactive systems may replace the non-interactive systems around us within the
next decade, enriching the overall experience, and changing many areas of our lives. We focus
on the smart space like libraries and museums, and how to achieve the desired level of service
for users in such informal adaptive learning spaces through the available sensing inputs and
resources.
1.1
Motivation
The increasing use of interactive technologies, digital media, and dynamic content in smart
space like libraries and museums is improving the user experience substantially. In
well-designed learning spaces, digital content can itself become a service, either with pre-well-designed
dynamic output to energize the space, or with creative and social output to interact with users
actively. In libraries, repeat users can benefit from enhanced experience with the digital content
the most, because the environment can service based on their preferences, whether they
at one place for extended periods of time for research and project work. In museums, digital
content can assist the users’ walk-through with better learning and educational experience. For
example, the digital content can guide the users through selected scenarios and interact with
them dynamically based on their previous actions, which makes the learning more intriguing,
and elevates their experience along the way. Besides, the automated, digital-driven systems
reduce the amount of workload of giving tours and directions for staff in libraries or museums,
because the tasks can be handled by the dynamic content in the space. The anonymous human
mobility data set (including human behaviors and how people adapt to different situations) can
also be collected from the human-space interactions for future social network research.
The intelligent and interactive technologies for adaptive learning space present new
opportunities, but also new challenges because the automated, digital-driven systems rely on
the sensing inputs from the space, and the available resources. In reality, the sensing inputs
cannot be 100% accurate. The faulty estimate of the user’s state (e.g. errors in users’ physical
location estimation) can lead to suboptimal resource allocation and system performance. Given
the limited number of resources available, the presence of multiple users leads to conflicts
regarding the resources of the space, let alone the effect from the inaccurate sensing inputs,
which will even worsen the situation by assigning the limited resource to the wrong user.
Therefore, the accuracy of the sensing inputs and the number of available resources play
important roles in controlling the system performance. It is evident that pursuing the best
sensing-input accuracy and possessing enough amount of resources can solve all the problems,
have a thorough understanding of the resource requirements and performance demand of the
system to achieve the optimal solution.
1.2
Introduction to Smart Spaces
Smart spaces are highly interactive physical environments equipped with computational
facilities [2]. The smart spaces should be able to autonomously acquire knowledge of their
users and to use it to improve their overall experience in the space [3]. “Smart” is defined by
the sensing capabilities, and the service set the space offers. Sensing capabilities refer to
recognizing the user’s physical location, identity, needs and preferences by collecting various
data such as room temperature, ambient noise level, wireless signal strength, and so on. The
service set adapts the computational resources in the space according to the sensing inputs
collected. It depends on both the resources and the users present in the space at a given time,
as the inherent mobility of the users force the interactions to be transient [4]. And the presence
of multiple users leads to the need of a conflict resolution mechanism regarding the resources
of the space.
1.2.1
Smart Space Architecture
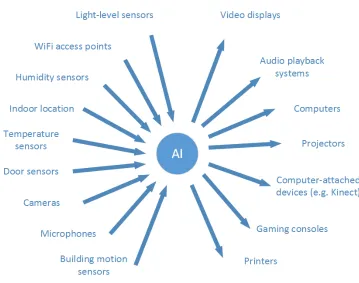
The smart space architecture is shown in Figure 1.1. The Artificial Intelligence (AI) algorithms
control the operations of the smart space. The components on the left of the figure are the
inputs to the AI algorithms. The components on the right of the figure are the resources that
video displays, audio playback system, and computers, etc. accordingly based on the data (like
indoor locations) collected from all kinds of sensors deployed in the space.
Figure 1.1 Smart space architecture
1.2.2
Resource Management
The number of resources in the multi-user smart space shown in Figure 1.1, including the video
displays, computers, etc., is limited, which leads to the necessity of resource management.
Good resource management allocates the different resources to needed users effectively and
efficiently. When the number of users are more than the number of the resources available in
system functioning. So resource allocation and conflict resolution are the two major
responsibilities of resource management.
A lease-based method for managing various resources in smart spaces is introduced in [4].
Leasing is the process of giving users the control of the leased resources transiently. It
introduces a flexible way of utilizing context information in resource management, and helps
optimize the resource usage in smart spaces. Figure 1.2 illustrates the conceptual view of key
components in resource management generally.
Figure 1.2 Key components in resource management [4]
In Figure 1.2, task description specifies what task the user is utilizing the resource for. Service
assembly dynamically builds a service for executing the task by using the leased resources. It
sends a request to the service discovery component based on the resources required by the task.
Service discovery performs a static matchmaking between the received resource requirements
resource management component. The resource management component filters the resource
set based on the resource availability and the validity criteria, such as the proximity of the user.
Finally, the available resources that meet the criteria are leased to the user, and passed to the
service assembly to perform dynamic service composition.
To explain the process in Figure 1.2 in more detail, consider the following use case: Kris is
reading the presentation slides on his smartphone before he attends the class, going through
the materials beforehand in the library. The presentation slides is the content of the task
description. When he walks by a big display, he notices that he can use the display by pairing
his phone and the display with Bluetooth. When he sends the Bluetooth pairing request from
his phone, the discovery request for leasing the screen is sent to the service discovery
component, then forwarded to the resource management component. The resource
management component checks the availability of the display, and the distance between the
display and the user. It turns out that the display is free to use (current content displaying has
lower priority than the user), and the user is standing within the 5m-range of the display, the
leasing process is then initiated.
Kris is allowed to use the display as long as the validity criteria are met, which are user
proximity of 5 meters and maximum leasing duration of 30 minutes. The resource management
component notifies the service assembly with an event containing the lease and the validity
criteria. The service assembly component then adapts the presentation slides service to the
user interface on the phone. Since Kris has to attend his class after 15 minutes, he leaves the
proximity of the display, which violates the validity criteria of the lease. The lease is then
ended, and the display stops showing the presentation slides.
Conflict resolution
Each user in the space tries to gain control on resources over other competitors, causing
conflicts that need to be resolved by resource management. A priority-based scheme should
handle the conflicts. Basically, users with higher priority can transiently override lower priority
services. The system has several priority levels according to the smart space policy. Each user
is assigned to a certain priority level per area. For example, a graduate student can be assigned
to priority level 5 in his office (given priority levels from 1 to 5, 5 as the highest priority), and
priority level 2 in the hallway. A user who tends to stay for a longer duration in a certain area
should have higher priority over the ones who stay for shorter period of time. Users who visits
the area frequently should have precedence as well. Moreover, resources can also be
non-exclusive, depending on the resource type. For example, bandwidth can be shared between
users simultaneously.
In summary, leasing checks the resource's validity criteria and availability status, resulting in
conflict management capability. Temporal validity also enables the estimation of the resource
Hence, lease-based resource management method facilitates the optimization of the resource
usage in smart spaces, thus helps increase the user's QoS.
1.2.3
Smart Space Performance Metrics
In smart spaces, Artificial Intelligence guides the user through multi-action sequences utilizing
the computational resources available, and monitors the user status and experience along the
way. The level of service (QoS) for users is crucial to define the performance of the entire
system. Take a simple navigation scenario as an example, George is studying in a room on the
second floor of the library, and he needs to read about materials from another book which can
be found from a bookshelf on the fifth floor. The system senses his need, locates the book, and
calculates a path to it. Then the system can guide George until he reaches the destination with
the help of the displays and lights along the way. George’s experience is dependent on whether
or not the instructions that are given to him make sense, whether or not he can get to the book
successfully, and when he changes the route, whether or not the system can sense the change,
adapt to it, and give out new instructions. Consistency and adaptivity in the example are both
human task performance metrics. Performance that can be represented in numbers is called
functional performance. The key metrics for functional performance are listed below.
System blocking rate
System blocking rate refers to the ratio of the number of blocked users to the total number of
considered being blocked either when he/she does not get the resource requested, or he/she
cannot finish the task with the assistance from the environment. The cause of blocking can be
different, unavailability of the resource, faulty instructions from the system, or task aborted by
the user itself can all lead to blocking of the user.
Average delay
Delay refers to the time difference between the optimal approach and the actual approach for
the task. The optimal approach is calculated in a perfect system with no resource conflict,
100% accurate sensing inputs and no irregular user behaviors. The actual approach is what
really happens in the real system, where resource conflict, inaccurate sensing inputs and
irregular user behaviors can all exist. Queueing management is applied upon the unavailability
of the resources. Average delay is the average value of the delay for each user in the system.
1.2.4
User Privacy
Smart spaces maintain users’ identity and preferences in order to keep track of the users’ action
sequences and make customized responses. Hence actions need to be taken to protect users’
private information (including who they are, where they are, and what their preferences are)
from being traced and revealed by adversaries or ill-intentioned people. Different security
techniques can be applied according to the smart space policy. One approach to enhance the
system security is to use authentication mechanism, which provides a reliable way of verifying
data to the server, either from the user’s portable devices or from the sensors deployed in the
space. HTTPS (HTTP Secure) is a good choice for requests sent from user’s devices. A more
advanced cryptosystem (a revised ElGamal encryption algorithm) is introduced in [5].
1.3
Introduction to Indoor Localization
Resource management introduced in Section 1.2.2 uses location-based information to filter the
resource set, i.e. the lease can only be valid if the user’s position is within a certain proximity
of the resource, which makes indoor location as one of the most important sensing inputs in
smart spaces, as shown on the left side of Figure 1.1. Since almost everyone has a smart device
in the pocket nowadays, smart device location information is used as the location of the user.
Indoor localization has gained a lot of attention and research interests during the past two
decades, as a result, various indoor localization solutions have been proposed.
1.3.1
Indoor Localization Solutions
Even though Global Positioning System (GPS) is extremely valuable for vehicle and even
pedestrian navigation with an accuracy of around 10 meters outdoors, it is highly inefficient in
the indoor environment due to signal attenuation caused by construction materials. Without
line-of-sight connections between the mobile station and at least three satellites, using GPS
indoors can be impossible. Given that GPS is generally not suitable for indoor localization, a
Wireless-based solutions
There are two basic approaches to design a wireless localization system. The first approach is
to deploy a signaling system and a network infrastructure specifically for localization purposes,
such as a RFID or Bluetooth system. The advantage of this approach is that the designers have
easier control of the physical specification and, consequently, the quality of the location
estimation. The density of the RFID or Bluetooth transceivers can be designed based on
customized localization requirements (e.g. 10-meter accuracy required) and the acceptable
budgets. The second approach is to use an existing wireless network infrastructure to locate a
target, such as a WLAN or cellular system. The advantage of the second approach is that it
avoids the expensive and time-consuming deployment of infrastructure. However, more
intelligent localization algorithms need to be used to compensate for the lack of control over
the physical specification of the system.
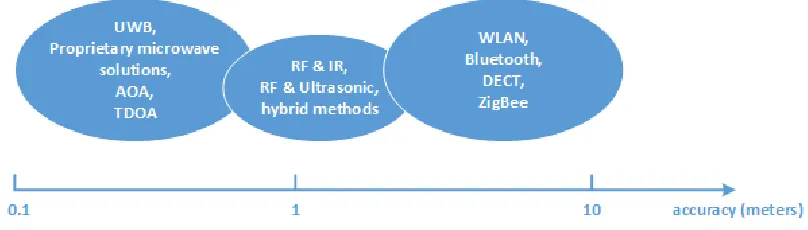
Several types of wireless technologies are used for indoor localization. Figure 1.3 gives a rough
overview of the current wireless-based technologies, and their differences in indoor
localization accuracy, which is a simplified version of [6, Fig. 6]. Ultra-wideband (UWB)
radio, measuring Angle of Arrival (AOA) and Time Difference of Arrival (TDOA) have the
best localization accuracy. Hybrid methods of Radio Frequency (RF) and Infrared (IR), RF
and ultrasonic technologies can achieve the accuracy of around 1 meter. The accuracy of other
(DECT), and ZigBee can be from 3 meters to 10 meters. More detailed description of various
wireless technologies and their localization performance can be found in Chapter 2.
Figure 1.3 Overview of current wireless-based indoor localization technologies
Sensor-based solutions
Most smartphones or tablets have inertial sensors built in, which include accelerometer,
gyroscope, altimeter, etc. Indoor localization systems can take advantage of the embedded
inertial sensors to achieve localization. For example, one possible algorithm can rely on
accelerometer-based step detection and step length estimation, along with gyroscope
measurements for direction and altimeter or barometer measurements for floor detection to
estimate location within known indoor map constraints as long as the entry point to the building
is known (either from GPS or distinct landmarks in the building). Sensor-based indoor
localization technology is a relatively new research area since the embedded sensors on smart
algorithm as described in the example, most of the time, inertial sensor data is used as a
supplement of the wireless-based technologies to enhance the localization accuracy [7].
Ambience-based solutions
Ambience-based indoor localization utilizes ambient sound, light, color and other landmarks
as signatures, which can be sensed by the smart phones' sensors and cameras. The main phases
for the ambience-based solutions are ambience calibration phase and localization phase. The
time-stamped ambience signatures are collected during the calibration phase. Then the
smartphone collects the sensing data again, and the localization algorithm returns the user’s
location based on the closest match in the fingerprint database. Different types of signatures
include light and acoustic signatures, and landmark signatures.
1.3.2
Effect of Indoor Localization
Various indoor location estimation solutions like wireless-based, sensor-based and
ambience-based solutions, or the combinations of two or more solutions can give an accuracy of less than
10 meters, and different technologies have different estimation accuracies (Figure 1.3).
However, localization technologies are not perfect, it is not possible to achieve an accuracy of
Figure 1.4 Illustration of the effect of indoor localization, in east wing of EBII, NCSU
The effect of indoor localization can be various as well, because a few meters’ estimation error
can put the target in a completely different room in the space. As shown in Figure 1.4, user B
is in room 2259 currently, but the system (the smart space) recognizes him/her as point B’ in
room 2261, due to localization error. That is, the system recognizes the user on the other side
and the estimated position of user B are in two rooms, if user B wants to use the projector in
room 2259 (actual position), the system won’t be able to lease the projector to B even though
the projector is not occupied at the moment, because it thinks B is in room 2261 (estimated
position). The system fails to provide service to the user due to localization error, the user is
“blocked”. While in some other cases, the penalty due to localization error might be subtle.
For example, user A is in room 2231 now, and his/her estimated position A’ is in the same
room. Even though the estimated position is still off by a few meters, this won't be a huge issue
when it comes to validating the user’s proximity to the resources.
1.3.3
Indoor Localization Performance Metrics
Referring to [6] and considering the differences between various technologies, the following
performance metrics for indoor localization system are considered: accuracy, precision,
complexity, dimension, and cost. There is often a tradeoff between accuracy, precision and
other characteristics like complexity and cost. The comparison among different localization
solutions is made in Table 2.1, Chapter 2.
Accuracy
Accuracy is the most important characteristic of a localization solution. It’s calculated as the
average estimation error (the Euclidean distance between the actual position and the estimated
Precision
Precision refers to the distribution of the estimation error, i.e. it measures the variation of the
accuracy over time. Precision is represented by the cumulative probability functions (CDF) of
the estimation error. For example, if the localization solution has a precision of 90% within
5m, it means that the probability of estimation error being less than 5 meters is 0.9 on the CDF
graph. Higher precision means that estimation errors are concentrated in small values. The
higher the precision (reaches high probability value faster), the better the localization solution.
Complexity
Complexity includes hardware and software complexity. Only software complexity is
considered in this thesis. Thus, complexity refers to the computing complexity of the
localization algorithm. Computing complexity consists of both time complexity and space
(memory) complexity. The lower the complexity, the better the localization solution.
Dimension
Dimension refers to the ability to locate a target in a 2-D or 3-D space. Some localization
solutions only focus on locating in 2-D spaces, while other solutions with floor-detection
Cost
Cost of a localization solution depends on many factors, including money, time, space, and
energy. Money refers to the amount of money needed to purchase the necessary hardware and
software specifically for localization purposes. Time is related to the effort in installation and
maintenance needed. Space refers to how much space the localization hardware takes. Energy
is also an important cost factor. Some localization units (e.g., RFID tags, and QR code tags)
are completely energy passive, and they can have an unlimited lifetime. Other units (e.g.,
devices with rechargeable battery) can only last for several hours without recharging.
1.4
Objectives
The objectives of this thesis are as follows:
• Conduct a comprehensive survey on indoor localization solutions. o Present an overview of the existing indoor localization solutions.
o Classify different location estimation technologies.
o Compare the performance of different localization solutions using the proposed
metrics.
• Implement a cross-platform WLAN indoor localization system. o Design the server backend for the localization system.
o Implement a WLAN-based location estimation algorithm.
• Analyze how indoor localization performance affects smart space performance. o Build a simulation platform for resource management in smart space with indoor
localization capabilities.
o Use the simulation results to analyze the performance dependencies.
o Solve the cost optimization problems with available resources and different system
load.
1.5
Overview of Thesis
The thesis is organized as follows. Chapter 2 presents various indoor localization solutions and
the comparison among different solutions. Chapter 3 describes the implementation of the
WLAN indoor localization system. The software development process as well as UML-based
descriptions are provided. Chapter 4 gives a description of the simulation platform for the way
finding case study for resource management modeling in smart spaces. The dependency
between the indoor localization performance and smart space performance is evaluated based
on the simulation results. The optimal solution for choosing the proper localization solution
(accuracy) with available budget, resources under different system load to achieve acceptable
CHAPTER 2
Indoor Localization
2.1
Overview
Indoor localization has gained a lot of attention and research interests during the past two
decades. Since Global Positioning Systems (GPS), the most popular outdoor localization
method, does not work indoors, a variety of alternative solutions have been proposed for indoor
localization (RADAR, Horus, SurroundSense, WILL, etc. [8, 9, 10, 11]). The notion of
location can range from physical coordinates in 2-D/3-D maps to logical labels (such as store
names or room IDs) [10]. The choice of whether to deploy physical localization or logical
localization mostly depends on the requirement of the application. For example, if the
application only needs room-level localization accuracy (such as the apps that send coupons to
customers who are in the store), physical coordinates and logical labels are both acceptable.
Most researches have been focusing on physical localization, while logical localization has
also been studied lately.
Different indoor localization solutions include wireless-based solutions, sensor-based
solutions, and ambience-based solutions. Wireless-based solutions have been studied
extensively during the last ten years. As the mobile technology being developed rapidly, more
and more sensors are now available in mobile phones or tablets. The use of cameras,
microphones, and other inertial sensors such as accelerometer on the mobile devices make
sensor-based solutions and ambience-based solutions possible, which brings variety to indoor
2.2
Wireless-Based Solutions
As discussed in Section 1.3.1, there are two basic approaches to design a wireless-based
localization system. One is to deploy a signaling system and a network infrastructure
specifically for localization purposes, such as a RFID or Bluetooth system. The other one is to
use an existing wireless network infrastructure to locate a target, such as a WLAN or cellular
system. Both approaches have their own advantages and disadvantages, the choice of the
technology should be made considering the specific localization requirements, available
hardware, and the acceptable budget. Various wireless technologies for both approaches are
introduced in this section.
2.2.1
Indoor Wireless Environment
According to the characteristics of the Radio Frequency (RF) signals, it is inevitable for the
signals to experience absorption, reflection, scattering, refraction, diffraction, multipath
fading, time delay, attenuation (free space path loss), and gain during propagation from the
transmitter antenna to the receiver antenna. The RF propagation behaviors can vary drastically
depending on the materials on the signal’s path and the signal’s frequency.
Indoor WLAN environment
Given that IEEE 802.11 is currently the dominant local wireless networking standard, an
and employing received signal strength indicator (RSSI) as a metric for location determination.
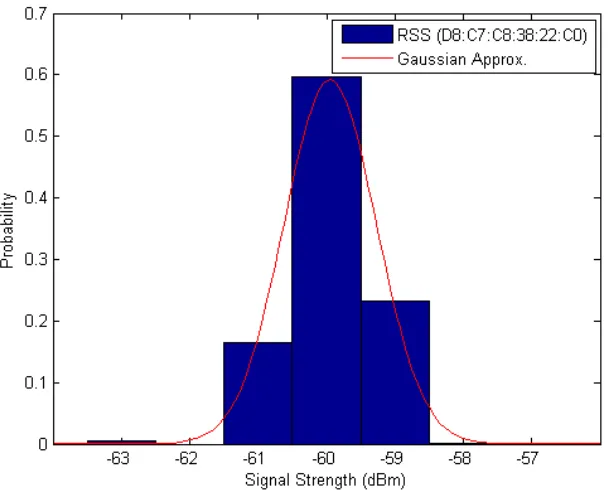
Several studies have been performed to model the indoor received signal strength. According
to [12], the indoor received signal strength is normally distributed. An experiment is conducted
at one particular point for a certain Access Point (AP) in EBII, NCSU, one signal strength
sample is measured every 0.8 seconds for a duration of 1 hour. The measurements are taken
by a Lenovo T420 laptop. The experimental results are shown in Figure 2.1, with the RSSI
distribution and its Gaussian approximation curve (µ = -59.95, σ = 0.67). The results suggest
Gaussian being a reasonable approximation.
RSSI can be affected by many factors like the building materials, floor layout, moving objects,
and even user’s presence. Human body can greatly attenuate the WLAN signals. [12], Fig. 2
shows that the presence of users can greatly spread the distribution of the RSSI. In addition,
the user’s orientation can also block the signal from a certain AP. With different APs in the
space, the independence of RSSI values from different APs is assumed. The assumption is
based on the experiments in [12] that evaluate the correlation factor among the different APs’
RSSI values as almost zero, i.e. the different APs’ RSSI values are uncorrelated.
2.2.2
Wireless-Based Localization Algorithms
Due to severe multipath, lack of Line-of-Sight (LOS) paths, and scattering objects in indoor
wireless environment, it is very tricky to model the radio propagation. There are various
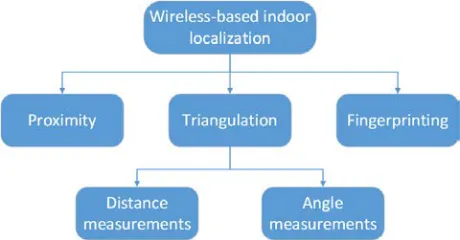
wireless-based algorithms for location determination. They are divided into four major groups:
proximity, distance measurements, angle measurements and fingerprinting. Distance
measurements and angle measurements are classified as triangulation. A detailed classification
of wireless-based localization algorithms is shown in Figure 2.2.
2.2.2.1
Proximity
Proximity algorithms are the simplest localization algorithms to implement. The position of
the mobile device is determined by the cell of origin (CoO) method with known antenna
positions and limited range. When a mobile device is detected by a single antenna, it is
considered to be at the location of the antenna. When more than one antenna detects the mobile
device, it is considered to be at the location of the one that receives the strongest signal. The
accuracy of CoO relates to the density of the antenna grid and its signal range. In practice, the
systems using infrared radiation (IR) and radio frequency identification (RFID) are often based
on this method [6].
2.2.2.2
Distance Measurements (Lateration)
The location of the user can be estimated based on its distances from multiple reference points.
Distances are measured using time of arrival (TOA), time difference of arrival (TDOA), or
received signal strength indicator (RSSI).
TOA (time of arrival)
Since the distance between the transmitter and the receiver is proportional to the radio
propagation time, by measuring the one-way propagation time between the user and at least
three reference points, the user’s location can be determined (as shown in Figure 2.3). The
one-way propagation time is calculated by the time difference between the timestamp sent with the
transmitters and receivers in the system have to be precisely synchronized for the algorithms
to work correctly. Three different TOA algorithms, Closest-Neighbor (CN) algorithm,
Least-Squares (LS) algorithm and Residual Weighting (RWGH) algorithm are presented in [13].
TOA algorithms can be used for ultra-wideband (UWB) measurements.
Figure 2.3 Indoor localization using TOA
TDOA (time difference of arrival)
Instead of using absolute time in TOA, TDOA uses the time differences when the signal arrives
at multiple reference points to determine the relative position of the user. TDOA algorithms
on the user. A conventional solution to TDOA algorithm can be found in [14]. Li et al. [15]
present a delay measurement-based TDOA algorithm for 802.11 wireless LANs.
RSSI (received signal strength indicator)
Since it is difficult to find a LOS path from the transmitter to the receiver, and RF propagation
suffers from multipath effect in indoor environments, location estimation accuracy with TOA
and TDOA algorithms can be decreased significantly. An alternative approach is to estimate
the RF propagation distances according to the measured RSSI values using path loss model
and multipath model. However, due to the irregular and unpredictable signal propagation in
indoor environment (with densely located obstructions), the distance-estimation model can get
very complicated, and the parameters employed in the models are site-specific. RADAR [8]
introduces a signal propagation model using wall attenuation factor (WAF) and floor
attenuation factor (FAF). Madigan et al. [16] propose a Bayesian hierarchical model.
2.2.2.3
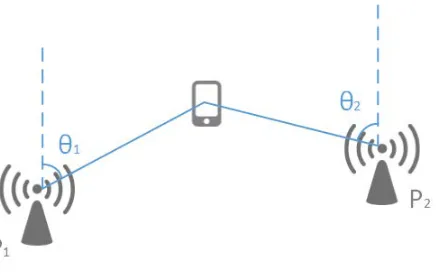
Angle Measurements (Angulation)
The location of the user can also be determined based on its angles from multiple reference
points, which is called the angle of arrival (AOA) algorithm. As shown in Figure 2.4, the
location of the user is the intersection of two lines formed from the reference points to the user.
At least two known reference points (P1 and P2) and two measured angles (θ1 and θ2) are
are required. Direction finding (DF) is accomplished with highly directional antennas or
antenna arrays [6], which adds more hardware cost to the system.
Figure 2.4 Indoor localization using AOA
A common drawback that AOA shares with TOA and TDOA is its susceptibility to multipath
interference [17]. AOA, TOA and TDOA work well with direct line of sight (LOS), but suffer
from decreased accuracy and precision when confronted with multipath effect. Unfortunately,
in indoor wireless environment, they are barely usable because line of sight to two or more
reference points is difficult to find.
2.2.2.4
Fingerprinting
Fingerprinting techniques exploits the relationship between a location and its corresponding
radio signature [18]. Fingerprinting solutions can be implemented completely in software,
which can reduce localization complexity and cost significantly compared to lateration and
(RSSI) at the client side as the radio signature (fingerprint). A fingerprinting localization
process is divided into two phases: calibration phase and localization phase. Radio signatures
are collected at different locations in the area of interests during the calibration phase, which
take the radio propagation effects like multipath and attenuation from objects in the space into
account. The localization phase match the reported radio signature of the target against
calibration-map database.
Calibration phase
In the calibration phase, the location fingerprints are collected by performing a walk-around of
the space with a mobile device. The location fingerprint, F, refers to the vector of RSSI values
from each access point at their corresponding location, L in the space. A calibration map refers
to the collection of fingerprints and their associated locations, <F, L>. Since the RSSI values
fluctuate over time for a given location (estimated as a Gaussian distribution as shown in Figure
2.1), a fingerprint can be the vector of the mean RSSI values from each access point at a certain
location, the size of the vector is the number of the access points can be detected. Assuming
that N access points can be detected at a certain location, and the mean RSSI values from the
ith access point is ri, the fingerprint at the given location can be described as:
1 2 ( , ,..., N)
Localization phase
In the localization phase, the user’s mobile device measures RSSI values from each detected
access point, and forwards the vector of the values to the location server. The location server
uses a localization algorithm and the calibration-map database to estimate the location of the
mobile device. The server then reports the estimated location estimate back to the mobile
device. Fingerprinting localization algorithms can be classified into three groups:
• Deterministic algorithms
Assume that the calibration map <F, L> contains m location fingerprints. The fingerprint
set F is represented as{F , F ,..., F }1 1 m , and the location set L is represented as{L , L ,..., L }1 2 m .
Each fingerprint is represented by the vectorFi =(r , r ,..., r )1i 2i Ni , wherei∈[1, m]. In the
localization phase, a sample RSSI-value vectorS =( ,s s1 2,...,sN)is measured from N access
points, where si is the RSSI value from the ith access point. The deterministic algorithms
attempt to find the fingerprint Fi that is the “closest” to the current measurement S.
“Closest” is defined as the fingerprint in the database that has the minimum signal distance
to S.
(S, F )j Dist(S, F ), kk j
Dist ≤ ∀ ≠ (2.2)
The distance function Dist( )⋅ can be computed using Euclidean, Manhattan, or
In practice, estimating the location using only the closest fingerprint can be error-prone.
An improvement is to use kNN (k nearest neighbor) algorithm. Instead of using only the
closest one, kNN estimates the location based on the average position returned by k nearest
neighbors. According to [8], the location accuracy increases as the value of k increases,
until k = 8 [19].
• Probabilistic algorithms
Probabilistic algorithms use probability inferences to determine the likelihood of a
particular location [17]. The most popular approach is to use Bayesian probability
inferences. Assume that there are m location candidatesL L1, 2,...,Lm, and S is the measured
RSSI vector during the localization phase. Location Liwill be chosen if:
( i| S) ( j | S), , j [1, ], j i
P L ≥P L ∀ ∈i m ≠ (2.3)
where (P Li| S) denotes the probability that the mobile device is at location Li, given that
the measured RSSI vector is S. Assume that P L( )i =P L( j)) for i, j = 1,2,...,n. Based on
Bayes’ formula,
1
(S | ) ( ) (S | ) ( ) ( | S)
(S)
(S | ) ( )
i i i i
i m
k k
k
P L P L P L P L
P L
P
P L P L
=
= =
∑
(2.4)We have the decision rule that location Li is chosen if:
(S | i) (S | j), , j [1, ], j i
The most popular approach, kernel approach can be used to calculate (S |P Li), i.e. the
probability that the measured RSSI vector is S, given that the mobile node is located at
locationLi. Assume that for each location Li in the space, n RSSI samples are taken from
each access point (N in total). Each sample is assumed to be Gaussian distributed with a
mean of µ and a standard deviation of σ (Figure 2.1). Then the likelihood function can be
defined as an equally weighted Gaussian kernel function:
2
2 1
(s )
1 1
(s | ) [ exp( )]
2 2 n j i j P L n µ σ πσ = −
=
∑
− (2.6)Since the RSSI values from multiple access points are independent from each other, and
1 2
( , ,..., N) S = s s s ,
1 2
(S | i) (s | i) (s | i) (s |N i)
P L =P L ⋅P L ⋅⋅⋅P L (2.7)
• Other algorithms
Other algorithms include neural networks and support vector machine (SVM) algorithms.
Neural networks assume that the RSSI is too complex to be analysed mathematically and
require non-linear discriminant functions for classification [17]. Extensive training data is
needed to adequately train the neural networks in optimizing the weighting parameters.
SVM is a machine learning algorithm that can be applied to classification or regression.
The indoor localization performance of SVM is almost the same as the deterministic
algorithms. However, SVM is more suitable for determining if an area is inside or outside
Even though fingerprinting algorithms are very popular for indoor localization systems due to
their relatively low computing complexity, low cost and high accuracy in severe multipath
environments, they do have drawbacks. One of the drawbacks is their labor-intensive site
survey (calibration phase), the other one is that they fully depend on the existing infrastructure,
which means that if the infrastructure changes, all the fingerprints will need to be recollected,
and the fingerprint database will need to be repopulated. For example, if the manager decides
to install a new set of routers from a different manufacturer to replace the existing ones, all of
the existing fingerprints will become useless.
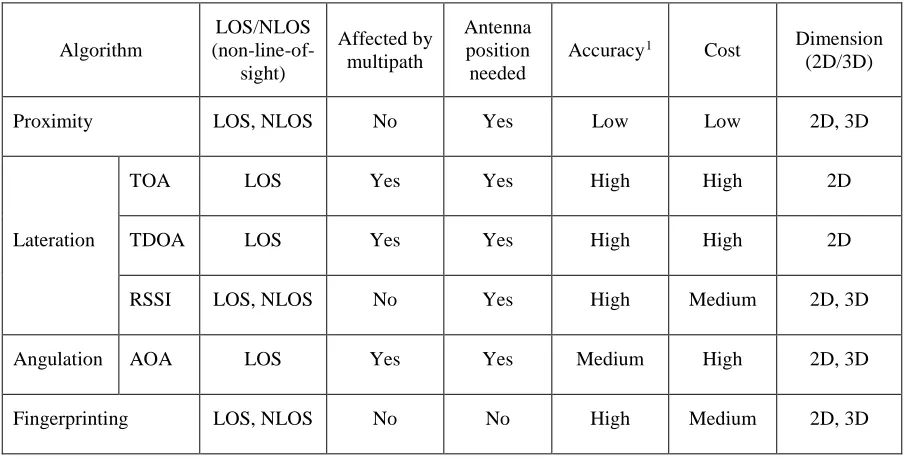
Table 2.1 Comparison of wireless-based indoor localization algorithms
Algorithm LOS/NLOS (non-line-of-sight) Affected by multipath Antenna position needed
Accuracy1 Cost Dimension
(2D/3D)
Proximity LOS, NLOS No Yes Low Low 2D, 3D
Lateration
TOA LOS Yes Yes High High 2D
TDOA LOS Yes Yes High High 2D
RSSI LOS, NLOS No Yes High Medium 2D, 3D
Angulation AOA LOS Yes Yes Medium High 2D, 3D
Fingerprinting LOS, NLOS No No High Medium 2D, 3D
1 Accuracy is evaluated based on the assumption of perfect wireless environment. For example, for TOA and TDOA algorithms, we are
assuming that multiple LOS paths are available, and there are no severe multipath effect.
2.2.3
Survey of Wireless-Based Solutions
Having introduced the different localization algorithms and the comparison among them
(Table 2.1), we will discuss about specific wireless-based localization solutions. There are
various types of wireless technology that are used for indoor localization, including radio
frequency identification (RFID), ultra-wideband (UWB), WLAN, Bluetooth, infrared radiation
(IR), ultrasound, ZigBee, etc.
2.2.3.1
RFID (Radio Frequency Identification)
RFID is a non‐contact (direct contact or line-of-sight contact) and automatic identification
technology that uses radio signals to identify, track and detect objects. An RFID system
consists of several RFID readers and RFID tags. RFID readers and tags can send and receive
data using a defined RF and protocol. RFID tags can be either active or passive. Passive tags
operate without a battery, and they are lighter, smaller, less expensive, and more energy
efficient compared to active tags. The passive tags have a communication range of 3m, while
the communication range of active tags is more than 100m. A well-known indoor localization
system that uses active RFID technology is LANDMARC [21]. It uses the fingerprinting
(kNN) algorithm to calculate the RFID tags. In order to increase accuracy without placing more
readers, the system employs the idea of having extra fixed location reference tags to help with
the location calibration. LANDMARC has an error distance of 1 m for 50% of the time, and a
maximum error distance of 2 m. An RFID-based localization system using passive tags is
location estimation. The experiment is conducted in a 9×9 grid with a cell size of 1m2. 6 trials
out of the 90 trials estimated the location incorrectly, giving a precision of 93% within 1 m.
2.2.3.2
UWB (Ultra-wideband)
UWB is a radio technology that transmits ultra-short pulses (less than 1ns), with low duty cycle
over a large portion of the radio spectrum (more than 500 MHz). The brevity of the emitted
UWB pulses minimizes the multipath interference, because the reflected pulses are well
separated in time from those taking the direct path between transmitter and receiver [22]. A
Dublin-based fabless semiconductor manufacturer, DecaWave2 has a wireless-networking
chip (ScenSor DW1000) designed to provide extremely precise indoor locations using UWB.
Indoor localization is achieved by installing the chips into both users’ phones and all the access
points. It utilizes TDOA algorithms to measure the time it takes the pulses to travel to a fraction
of a nanosecond, allowing the precision of less than 10 cm, even while moving at up to 5m/s.
Even though UWB has high immunity to multipath fading, the UWB signals get blocked too
easily (40% of the time according to [22]) in various indoor environments, leading to the
possibility of the first pulse detected not being the LOS path. The absence of the LOS signal
can easily create errors of a meter or two, which gives a localization accuracy similar to the
other wireless-based solutions. Other companies that provide UWB location equipment
include Berlin-based Nanotron3, Time Domain of Huntsville, Ala.4, and Zebra Technologies
of Lincolnshire, Ill5.
2 http://www.decawave.com/products/dw1000 3 http://www.nanotron.com/EN/index.php 4 http://www.timedomain.com/
2.2.3.3
WLAN
The WLAN (IEEE 802.11) standard, operating in the 2.4-GHz ISM (Industrial, Scientific and
Medical) band, is the most popular local wireless networking standard currently. WiFi signals
can be found in almost every building now, and they can penetrate through walls and
obstructions where GPS fails. Due to the excellent signal accessibility indoors and its ubiquity,
WLAN (WiFi) indoor localization systems can be deployed without installing extra hardware
as RSSI values can be obtained directly from NICs that are available on most handheld
computing devices. WLAN infrastructures provide a cost-effective solution for localization in
indoor environments.
An early attempt to adopt WLAN technologies in location determination is RADAR [8].
RADAR proposed two solutions: empirical and signal propagation modeling. The first one
utilizes the kNN fingerprinting algorithm as described in Section 2.2.2.4. The second one uses
the wall attenuation factor (WAF) and the floor attenuation factor (FAF) propagation model.
The result for RADAR system shows that, the propagation solution provides an accuracy of
about 4.3 m compared to an accuracy of 2.94 m for the empirical one. For the empirical
solution, results show that 25% of the error distances is within 1.92 m, 50% of the error
distances is within 2.94 m and 75% of the error distances is within 4.69 m. Horus system [9],
improved upon RADAR, employs a stochastic description of the RSSI-location relationship
and uses a maximum likelihood-based method to estimate locations. The experiment results
show that the average accuracy of the Horus system is better than the RADAR system by more
WILL [11] presents an indoor logical localization approach without site survey or knowledge
of AP locations. Fingerprints are partitioned into different virtual rooms based on RSSI
stacking difference. Fingerprints with high similarity are put into one virtual room. Different
virtual rooms then construct the logical floor plans, which are mapped into physical floor plans
using betweenness centrality of a vertex and shortest paths length between vertices. The
implementation results show that WILL can achieve an average room-level accuracy of 86%.
EZ [23] models the physics constraints of wireless propagation with path loss model and uses
a genetic algorithm to solve them for localization. However, EZ still relies on occasionally
available GPS information at the entrance or near a window. Besides, EZ involves complex
computation and the physical localization scheme might result in lot of misdetections of rooms.
From the commercial and research systems built based on WLAN fingerprinting algorithms,
it is observed that there is a trade-off between the measurement efforts and the localization
performance. The more the number of samples are taken during the calibration phase, the more
accurate the location estimation is. Researchers have also been working on reducing the
measurement efforts, like WILL [11], but it has to trade with more complicated localization
algorithm and increased location estimation latency.
2.2.3.4
Bluetooth
Compared to WLAN, Bluetooth has shorter transmission range, which makes it easier to be
confined to a single room. Each Bluetooth transceiver (beacon) has a unique ID, which can be
the Bluetooth “beacon” they are getting the signal from. Bluetooth can provide higher indoor
localization resolutions than WLAN. However, there are several drawbacks of using Bluetooth
technology for localization. One of the drawbacks is the extra cost for installing special
hardware (beacons) in the space. Another drawback is that the beacons run the device
discovery procedure upon each location request, which significantly increases the localization
latency (by 10 to 30 seconds) and the power consumption. An Austria-based indoor positioning
software company, indoo.rs6 has developed a Bluetooth solution (iOS and Android SDK
released) based on Bluetooth LE (Bluetooth 4.0) standard. Their solution uses the signals from
beacons installed in the space to determine the real-time location, allowing an accuracy of 1-2
meters. Other companies, like the France-based company, Insiteo7 is also working on ways to
squeeze precise indoor localization out of Bluetooth beacons.
2.2.3.5
Others
Other wireless technologies have also been studied for feasibility in indoor localization. IR
(infrared radiation) is one of most popular ones on the list. Most IR wireless devices require
line-of-sight (LOS) communication between the transmitter and the receiver. IR devices are
small in volume and light in weight, and IR-based systems can precisely locate the target.
However, interference from fluorescent light and sunlight can significantly degrade the
localization performance [6]. Besides, hardware and maintenance of IR devices are expensive,
which makes scalability an issue. Ultrasound signals can also be used to estimate indoor
6 http://indoo.rs/
locations with an accuracy of around 10 cm, but they are blocked by obstructions like walls
easily and suffer a lot from the reflected-signal interference. Recent research in
ultrasound-based indoor localization can be found in [24]. Hu et al. [25] presents a ZigBee-ultrasound-based solution
for indoor localization.
2.3
Sensor-Based Solutions
As introduced in Section 1.3.1, most smartphones and tablets have built-in inertial sensors that
measure motion and orientation of the device. Raw data provided by the sensors can be used
to detect 3-D device movement and its position indoors. According to [27], if the initial
location of an object and all forces applied the object are known, its position can be tracked
over time. If the initial location is not known, only the relative position to the origin can be
estimated.
2.3.1
Sensors
Figure 2.5 shows the sensor coordinate system used by Android Sensor API. The sensor
framework uses a standard 3-axis coordinate system. When a device is held in its default
orientation, the X axis is horizontal and points to the right, the Y axis is vertical and points up,
and the Z axis points to the front side of the screen [26]. This coordinate system is used by
Figure 2.5 Sensor coordinate system (relative to a device) used by Android Sensor API [26]
Accelerometer
The Accelerometer measures the acceleration applied to the device, including the force of
gravity. According to [28], accelerometers provide apparent evidence of human walking
patterns. An experiment is conducted by walking along the hallway of EBII, NCSU with a
Nexus 7 with Android 4.4. An Android application is created to record the raw accelerometer
data, the code snippet of the application can be found in Appendix A of the thesis. The sensor
data is a vector of three values with each one being the reading on x, y, or z axis (Figure 2.5).
The raw z-axis readings from the first 14 steps taken are shown in Figure 2.6 as the blue line.
As illustrated in Figure 2.6, magnitude of about 2 m/s2 is caused by foot lifting and about 3
m/s2 by putting the foot down. This signature can be exploited for step detection (marked as
Figure 2.6 Acceleration signatures of 14 steps
Gyroscope and Magnetometer
The gyroscope measures the rotation in rad/s around a device’s x, y and z axis. Together with
the magnetometer that monitors changes in the earth’s magnetic field, it is possible to calculate
the change of angles on the device over time, which can be explored to detect the user’s
direction. With the knowledge of the user’s average step distance, we can estimate how far
away the user has walked towards which direction. Therefore, the sensors on the smartphone
or the tablet can pretty much track the user’s movement in the space, and determine the indoor
Another approach is to use magnetic fields (collected by the magnetometer) as unique
signatures in fingerprinting algorithms.
Compared to the fingerprinting algorithms, sensor-based dead reckoning algorithms can
reduce the measurement efforts dramatically since constructing a dense fingerprint database,
with 1-2 meters fingerprint samples distance, can be very labor-intensive. However,
sensor-based dead reckoning algorithms have drawbacks. First, the algorithms need to have complete
knowledge of the building plan, and mapping the model of the building into software can be
very complicated. Second, the availability of multiple inertial sensors on different mobile
devices can also be a constraint.
2.3.2
Survey of Sensor-Based Solutions
Even though sensor-based indoor localization technology is a relatively new research area,
there has been several systems developed that attempt to utilize sensor data to determine indoor
positions. Liu et al. [30] proposes an indoor positioning system based on the accelerometer and
compass on ubiquitous smart phones. In the system, only limited WiFi fingerprints at the center
of each room and each segments of corridors are collected. Initial estimation is derived as the
most similar room among all the fingerprints. Digital compass measurements are taken at each
step detected by the accelerometer. Localization solution is based on the particle filter. By
eliminating the particles whose trajectory intersects with walls dynamically, positioning error
decreases over time, which can achieve the accuracy of 0.33 m at the last position. The Android
compass, to follow a path in a building. The project is published as open sources software8. A
Finland-based indoor localization software company, IndoorAtlas9 has developed a
fingerprinting-based solution using a smartphone’s magnetometer measurements as location
signatures, allowing an accuracy of less than 3 meters for 90% of the time.
2.4
Ambience-Based Solutions
Most ambience-based solutions use fingerprinting algorithms to pinpoint users’ location
indoors. As discussed in Section 2.2.2.4, fingerprinting algorithms are divided into two phases,
calibration phase and localization phase. Time-stamped ambience signatures are collected
during the calibration phase. In the localization phase, the smartphone collects the sensing data
again, and the localization algorithm (deterministic algorithm, probabilistic algorithm, etc.)
returns the user’s location based on the closest match in the fingerprint database. Even though
ambience-based fingerprinting localization solutions depend less on the network infrastructure
compared to wireless-based fingerprinting solutions, recognizing fingerprints from raw
ambience data can be labor intensive due to the huge variety of data. Another drawback of
ambience-based solutions is that motion recognition may take time to collect, which increases
the localization latency. Different types of ambience signatures include light and acoustic
signatures, and landmark signatures.
8 https://github.com/COMSYS/FootPath/ 9 https://www.indooratlas.com/
2.4.1
Light and Acoustic Analysis
Different places can have different light and acoustic signatures, which makes light and
acoustic analysis a feasible solution for indoor localization. For example, coffee shops can
have specific noise signatures from coffee machines and microwaves, which are different from
the clinking sounds of forks and spoons in restaurants [10], pubs can have high noise level and
dark indoor environment.
SurroundSense [10] considers audio sample amplitude distribution as the ambient sound
fingerprint for acoustic processing, so it distinguishes between stores with different loudness
characteristics. And the system translates pixels of the floor pictures to a
hue-saturation-lightness (HSL) space, and considers the light intensity on L-axis as the ambient light
fingerprint. These two fingerprints alone do not give good localization accuracy, but they work
well as the sub-stages in the multi-sensor localization method. Tarzia et al. [31] introduces the
Acoustic Background Spectrum (ABS), an ambient sound fingerprint technique. The system
first calculates the ABS of the room, and then classifies the room by comparing its ABS with
the existing, labeled ABS values in the database. The system yields 69% correct fingerprint
matches.
2.4.2
Landmarks
Landmarks can be the different signatures that naturally exist in the environment. Similar to
the red wall and keep going until you reach the help center. These landmarks can be detected
by a smartphone’s sensors or cameras. Example landmarks can be the distinct motion signature
of an elevator (abrupt change in altitude), or certain dead points where there are no WiFi or
cellular signals, or a distinct color of the carpet or the wall [32]. SurroundSense [10] considers
human movement pattern as a fingerprint. Two simple states from the accelerometer readings,
stationary and motion are used as the input to the support vector machines (SVM). The
sequence of stationary or moving state are viewed as an abstraction of the user's movement
pattern. This fingerprint works as the second last stage of the multi-sensor filter. Putting all the
stages together, SurroundSense can achieve an average room-level accuracy of 87%.
2.5
Summary
In this chapter, we reviewed different indoor localization solutions (wireless-based,
sensor-based, and ambience-based solutions). One or two solutions picked from each indoor
localization technology are listed in Table 2.2. Each solution has its advantages and
disadvantages. The choice of localization solutions is mainly dependent on the requirement of
the specific project and the available network infrastructure and mobile devices. However, if
possible, employing hybrid schemes that take advantage of multiple solutions can help achieve
better localization performance, which is a common choice for most commercial and research
location-aware products. For example, combining WLAN together with cellular signals,
Bluetooth, even ultra-wideband sources, if these are available. Wireless-based solution or
![Figure 1.2 Key components in resource management [4]](https://thumb-us.123doks.com/thumbv2/123dok_us/1633971.1203820/15.612.91.533.319.461/figure-key-components-resource-management.webp)


![Figure 2.5 Sensor coordinate system (relative to a device) used by Android Sensor API [26]](https://thumb-us.123doks.com/thumbv2/123dok_us/1633971.1203820/48.612.258.373.70.206/figure-sensor-coordinate-relative-device-used-android-sensor.webp)
