Lean Operational Principles and Practices
Effecting in a Manufacturing Concern
Aravinth Kumar A1, Janagiraman R2, Rajenthirakumar D3, Sathishkumar K4
Assistant Professor, Department of Mechanical Engineering, United Institute of Technology, Coimbatore, India. 1
Assistant Professor, Department of Mechanical Engineering, VSB College of Engineering, Technical Campus
Coimbatore, India. 2
Associate Professor, Department of Mechanical Engineering, PSG College of Technology, Coimbatore, India. 3
UG Scholar, Department of Mechanical Engineering, United Institute of Technology, Coimbatore, India. 4
ABSTRACT: The purpose of this research is to apply the lean tools towards reduction of lead time in a compressor manufacturing industry. The study is done on the 2 Hp air compressors. Value stream mapping (VSM) technique is applied in order to create an overview of the entire production flow in manufacturing process, visualize non value added activities and identify process waste. Then suitable Lean tool is used to eliminate the non value added activities. The standard operating procedure is developed and training is given to operators. Line balancing technique is used to balance the total work content among different work stations. It is concluded that with the implementation of lean tools, lead time is reduced and overall equipment effectiveness is improved.
KEYWORDS: VSM, Kaizen, 5S, Overall equipment effectiveness, Lead time, Line balancing.
I. INTRODUCTION
The main aim of study is to reduce the lead time by lean tools. With the proper implementation of lean tools the problems can be solved effectively and the productivity can be increased. The paper discusses about the analysis and implementation of lean tools for lead time reduction. The focus of study is to improve the overall equipment effectiveness and to meet the customer demand by using standard operating procedure and line balancing techniques. Value stream mapping (VSM) is a technique that was originally developed by Toyota.VSM is used to find waste in the value stream of the product. Once waste is identified, it is easier to make plan to eliminate it. The purpose of VSM is process improvement at the system level.VSM shows in normal flow format. However, in addition to the information flow necessary plan and meet the customer’s demand.
Kaizen is a methodology that permits to identify the opportunities for continuous improvement in a short period of time, such as days or hours. It is an action-based strategy to apply Lean, JIT, quick result, and time-to-market. In business, results should transform to increase income. But a well-established company focuses on a strategy with much more financial improvement than projected.KAI means change or the action to correct and ZEN means good. So basically kaizen is small incremental changes made for improving productivity and minimizing waste.5S is a system which helps to organize a workplace for efficiency and optimizes quality and productivity via monitoring an organized environment.5S was developed in Japan and was identified as one of the techniques that enabled JIT manufacturing. The term refers to five steps-sorts, set in order, shine, standardize and sustain that are also known as 5 pillars of visual workplace. The 5S system is good tool for all improvement efforts aiming to drive out waste from the manufacturing process and ultimately improve productivity.
II. LITERATURE REVIEW
originally developed as a method within the Toyota’s Production System and is an essential element of Lean Management. Value Stream Mapping is a simple, yet very effective, method to gain a holistic overview of the status of the value streams in an organization.
NaikShrikantShrikrishna, K.Natarajan, VinayGouda, (2014), Reduction of idle time and process lead time in the manufacturing of rocker arm lines using lean tools. This paper concentrates on the productivity improvement by reducing idle time and process lead time in the manufacturing of process lead time using lean tools. It can be seen that line efficiency before and after heat treatment is improved by 15 % and 17 % respectively and process lead is reduced by 0.31 days. [3].Fawaz A. Abdulmaleka, Jayant Rajgopalb (2006) analysing the benefits of lean manufacturing and value stream mapping via simulation: A process sector case study. They used Value stream mapping as the main tool to identify the opportunities for various lean techniques. we also describe a simulation model that was developed to contrast the ‘‘before’’ and ‘‘after’ Rajesh Gautam, Sushil Kumar, Dr. Sultan Singh, (2012). This case study deals with the kaizen implementation in an industry in an assembly line in India that manufactures front and rear axle for heavy and medium vehicles. One more interested thing is observed from the study that not a single operator after Kaizen reach to 90% of the takt time. These will results in minimum cost and increase in productivity. [5].Kaizen is a continuous improvement process. Kaizen can Obtain quick results. It rearranges the process. 5S is a workplace organization and continuous improvement system that lays the foundation for all other lean improvement activities. It has been proven to work in any business, every sector, all industries, in any country and has been instrumental in changing the culture of organizations worldwide [7]
III. PROBLEM DEFINITION
The study and observation showed that while the setup time is more. Further observation revealed that they are not meeting the customer demand, because there is no proper assembly of workstations it will increases the manufacturing lead time. Another observation is the machine downtime is more because of improper maintenance. This will causes the less productivity. In machine shop there is no proper handling of 5S activity, this causes for more tool searching time for operators. It will also increase the non value added activity for operators in machine shop. Machine utilization is poor because of improper operating procedure. It causes less production.
Objectives
To reduce the total lead time
To improve the overall equipment effectiveness
To meet the customer demand on time
To reduce the downtime by increasing the machine utilization
To reduce the non value added activities
IV. METHODOLOGY
Fig 1: Methodology
V. DATA COLLECTION
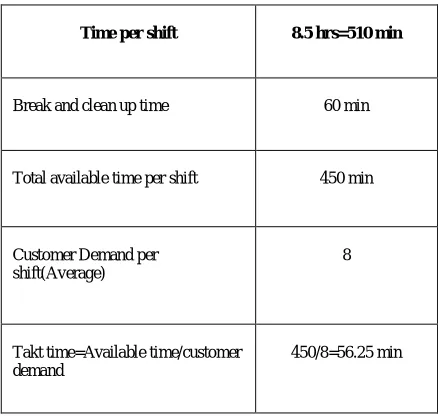
Data collection is done for the manufacturing of 2Hp air compressors. First the takt time is calculated for 2 Hp air compressors. Takt time is time required to manufacture the product to meet customer demand. Takt time is available time divided by customer demand.
Table I: Time study
Conclusion Result & Discussions Implementation & Future state Data collection & Current state analysis
Literature review Objectives Problem definition
Time per shift 8.5 hrs=510 min
Break and clean up time 60 min
Total available time per shift 450 min
Customer Demand per shift(Average)
8
Takt time=Available time/customer demand
Table II: Data Collection
After calculation of takt time, VSM is drawn to analyze the time taken by each operation and their setup time. A value stream is a collection of all actions (value added as well as non-value-added) that are required to bring a product (or a group of products that use the same resources) through the main flow , starting with raw material and ending with customer. All the data required for current state mapping were collected. Data collection consists of the process cycle times, changeover times and no of operator required for doing the same operation. Current state value stream mapping is constructed by using I–GRAFX 2013 software. The VSM gives the total lead time required. Current state map is giving the clear picture of the operation and their setup time and processing time. The time study is done for each and every activity. Table II gives the details about the data collection. This data is tabulated based on average values noted. Value Stream Mapping was originally developed as a method within the Toyota’s Production System and is an essential element of Lean Management.
Fig 2: Current state value stream map
Activity Cycle Time
(mins)
Value added time (mins)
Non value added time (mins)
Compressor head machining 09 6.3 2.7
Crankcase machining 57 29.6 27.4
Cylinder machining 33 26 07
Connecting rod machining 7.6 4.6 03
Valve plate grinding 12.2 9.2 03
Shaft coupling machining 05 03 02
Inspection 13 00 13
Assembly 26 20 6
Testing 15 00 15
Painting 11 05 06
Table III : VSM Results
Description Time in minutes
Lead time 209
Value added time 120
Non value added time 89
VI. IMPLEMENTATION
Different lean tools are identified to improve the OEE and productivity. After identification of lean tools, each tool is implemented as given below.
A.5S :
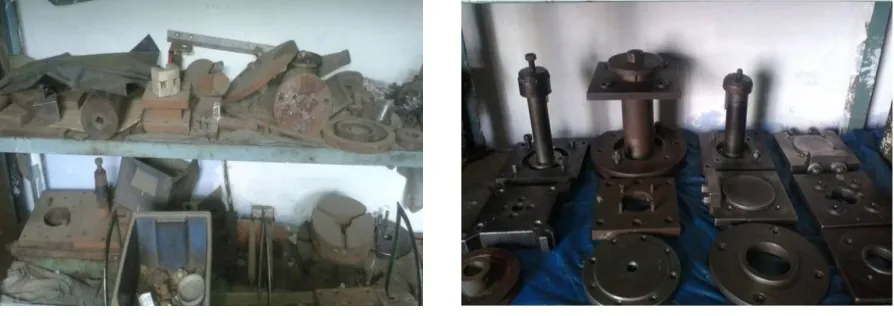
5S is a workplace improvement tool.5S encourages workers to improve their working conditions and helps them to learn to reduce waste. By implementing this tool, time required to search different items is reduced and workplace condition is improved. Fig 3 shows that the tool storage section, here there is no proper arrangement of tools for convenient access to operators. It will increase the tool searching time for the operators.
Fig 3: Before 5S Fig 4: After 5S
B. Kaizen :
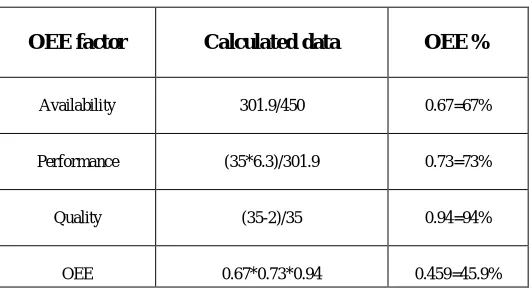
C. Overall equipment effectiveness:
OEE = Equipment availability (%) × Performance Efficiency (%) × Quality Performance (%)
Table IV: OEE Calculation
The implementation of various lean tools and SOP for different machines in the shop floor leads to less downtime of machine, increased output/month, availability, performance efficiency and quality performance which result increase OEE of machine.
D. Line balancing:
The industry manufactures different types of air compressors. The cycle time is very high compared to the takt time. Line efficiency varies from 52 % to 62%. The issues are due to idle time in work stations, improper utilization of labor and bottlenecks. An approach is made using industrial engineering philosophy to solve issues faced in meeting the demand.
Takt time = Available time Demand
Available time = Total time – Scheduled breaks Available time = 510 – 60
= 450 mins Takt time = 450/8
= 56.25 min
Theoretical no of workstations (n) = Total work content time Takt time
= 193.3/56.25
= 3.43 = 4 workstations
OEE factor Calculated data OEE %
Availability 301.9/450 0.67=67%
Performance (35*6.3)/301.9 0.73=73%
Quality (35-2)/35 0.94=94%
Table V: Activity Details
Fig 5. Precedence diagram
Largest candidate rule
Station 1 Station 2 Station 3 Station 4
Line efficiency = Total work content time = 193.3 = 87.07 %
No of workstation * Max station time4 * 55.5 Kilbridge westers method
Station 1 Station 2 Station 3 Station 4
Line efficiency = Total work content time = 193.3 = 88.1 %
No of workstation * Max station time4 * 54.8 Ranked positional Weightage method
Station 1 Station 2 Station 3 Station 4
B,E (55.5)
C,A,D,F (52.3)
G,H,I (54)
J,K (31.5)
A,B (53) C,D,E (54.8) G,H,I (54) (31.5)J,K
Operation Description Time (min) Predecessor
A Compressor head machining 8 -
B Crankcase machining 45 -
C Cylinder machining 33 -
D Connecting rod machining 6.3 -
E Valve plate grinding 10.5 -
F Shaft coupling machining 05 -
G Inspection 13 A,B,C,D,E,F
H Assembly 26 G
I Testing 15 H
J Painting 11 I
Line efficiency = Total work content time = 193.3 = 87.07 %
No of workstation * Max station time4 * 55.5
New heuristic algorithm
Table VI: Activity Details
Successors Activity Predecessors Sum of Successors time (min)
G A - 13
G B - 13
G C - 13
G D - 13
G E - 13
G F - 13
H G A to F 26
I H G 15
J I H 11
K J I 22.5
- K J 0
Station 1 Station 2 Station 3 Station 4
Line efficiency = Total work content time = 193.3 = 96.6 %
No of workstation * Max station time4 * 50
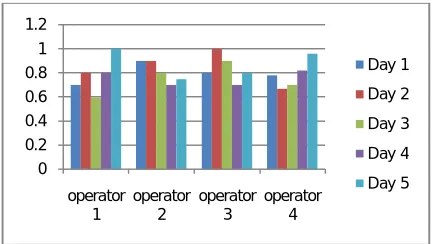
Fig 6.Tool Searching Time
B,E (55.5)
C,A,D (52.3)
G,H,I (54)
J,K (31.5)
B,F (50) C,D,E (49.8 A,G,H (47) (46.5)I,J,K
0 0.2 0.4 0.6 0.8 1 1.2
operator 1
operator 2
operator 3
operator 4
TABLE VII: OEE Results Comparison
S.no Description Before After
1 Availability 0.67=67% 0.746=74.6%
2 Performance 0.73=73% 0.749=74.9%
3 Quality rate 0.94=94% 1.00=100%
4 OEE % 0.459=45.9% 0.558=55.8%
Fig 7: Future state value stream map
TABLE VIII: LEAD TIME COMPARISON TABLE IX: LINE BALANCING RESULTS
S.no Method
No of Work Stations
Efficiency
1 Largest
Candidate Rule
4 87.07%
2 Kilbridge Westar
Method
4 88.18%
3 Ranked
Positional Weightage
4 87.07%
4 New Algorithm 4 96.65%
S.no Description Before After
1 Lead time 209 min 193 min
2 Value added time 120 min 120 min
3 Non value added
time
VII. RESULTS AND DISCUSSION
After implementing lean tools, tool searching time is reduced as shown in the figure 7 and OEE is improved from 44% to 55% as shown in the figure 8. A future state map is drawn to show the improvements achieved as shown in figure 9 and reduction in lead time of manufacturing of air compressor to 6 minutes as shown in figure 7.
VIII. CONCLUSION
The study suggests the benefits of lean implementation. The results are compared with previous situation that is before implementation of lean tool. By implementing 5S there is significant reduction in non value added time. Kaizen implementation gives the suitable reduction in setup time as well as some small improvements. Process improvements give the reduction in lead time. It is concluded that 5S, Kaizen, Process Improvement, line balancing, overall equipment effectiveness are important lean tools for the lead time reduction and productivity improvement.
REFERENCES
[1] Fawaz A. Abdulmaleka, Jayant Rajgopal 2007, “Analyzing the benefits of lean manufacturing and value stream mapping via simulation: A process sector case study,” Int. J. Production Economics., 107, 223–236, 2007.
[2] Norm Bain,2010 the consultants guide to successfullyimplementing 5S, Jan 2010.
[3] Ranteshwar Singh, Ashish M Gohil, Dhaval B Shah, Sanjay Desai,2013 “Total Productive Maintenance (TPM) Implementation in a Machine Shop: A Case Study,” Procedia Engineering., 51, 592 – 599, 2013.
[4] Rajesh Gautam, Sushil Kumar, Dr. Sultan Singh2012, “Kaizen Implementation in an Industry in India: A Case Study”ISSN : 2249-5762 (Online) | ISSN : 2249-5770, IJRMET Vol. 2, Issue 1, April l 2012.
[5] Rahani AR*, Muhammad al-Ashraf, 2012, “Production Flow Analysis through Value Stream Mapping: A Lean Manufacturing Process Case Study” Procedia Engineering 41 (2012) 1727 – 1734.
[6] U. Dombrowskia, T. Mielkea, 2013, “Lean Leadership fundamental principles and their application” Procedia CIRP 7 (2013) 569 – 574. [7] AmmarNoorwalia, [2013]“Apply Lean and Taguchi in different level of variability of food flow processing system” Procedia Engineering 63
(2013) 728 – 734.
[8] D.T. Matt*, E. Rauch, 2009 “Implementation of Lean Production in small sized Enterprises”Procedia CIRP 12 (2013) 420 – 425.
[9] Edgardo J. Escalante, 1999, “quality and productivity improvement: a study of variation and defects in manufacturing” Quality Engineering, 1 (3), 427-442 (1 999).
[10] Jagtar Singh, VikasRastogi and Richa Sharma, 2013“Total Productive Maintenance Review: A Case Study in Automobile Manufacturing Industry” ISSN 2277 - 4106 © 2013 INPRESSCO.
[11] Amit Kumar Gupta, Dr. R. K. Garg, 2012, “OEE Improvement by TPM Implementation: A Case Study”ISSN: 2319-4413 Volume 1, No. 1, October 2012.
[12] Prof Pradeep Kumar, Dr. K. V. M. Varambally, Dr. Lewlyn L.R. Rodrigues3 2012, “A Methodology for Implementing Total Productive Maintenance in Manufacturing Industries–A Case Study”e-ISSN: 2278-067X, p-ISSN : 2278-800X, www.ijerd.com Volume 5, Issue 2 (December 2012), PP. 32-39.
[13] Wasim. S. Hangad, Dr. Sanjay Kumar, 2013, “TPM- A Key Strategy for Productivity Improvement in Medium Scale Industry” (ISSN 2250-2459, ISO 9001:2008 Certified Journal, Volume 3, Issue 6, June 2013.
[14] Prof. A.Bangar, Hemlatasahu, Jagmohanbatham, 2013, “Improving Overall Equipment Effectiveness by Implementing Total Productive Maintenance in Auto Industry” (ISSN 2250-2459, ISO 9001:2008 Certified Journal, Volume 3, Issue 6, June 2013).
[15] Premkumar.s, d.shanmugasundaram, 2014, “line balancing and idle time reduction in grinder manufacturing industry”.