ABSTRACT
HECKMAN, SARAH SMITH. A Systematic Model Building Process for Predicting Actionable Static Analysis Alerts. (Under the direction of Laurie Williams).
Automated static analysis tools can identify potential source code anomalies, like null pointers, buffer overflows, and unclosed streams that could lead to field failures. These anomalies, which we call alerts, require inspection by a developer to determine if the alert is important enough to fix. Actionable alert identification techniques can supplement automated static analysis tools by classifying or prioritizing the alerts generated by automated static analysis such that the likelihood of a developer inspecting actionable alerts first is increased. By classifying and prioritizing actionable static analysis alerts, the developer will focus his or her time on inspecting and fixing actionable alerts rather than inspecting and suppressing unactionable alerts.
The goal of my research is to reduce inspection time by accurately predicting actionable and unactionable alerts when using static analysis by creating and validating a systematic actionable alert identification model. The Systematic Actionable Alert Identification (SAAI) process uses machine learning to identify actionable alerts. Investigation of the following three hypotheses will inform the goal of my research:
• Hypothesis 1: The artifact characteristics of an alert and the surrounding source code are predictive of the actionability of an alert.
• Hypothesis 2: A systematic actionable alert identification technique using machine learning can accurately identify actionable alerts.
A benchmark, FAULTBENCH, provides the evaluation framework for the proposed SAAI
model building process and comparison with other actionable alert identification techniques. The dissertation presents a feasibility study and three empirical studies evaluating the hypotheses above. The feasibility study evaluates an adaptive actionable alert identification technique that utilizes the alert’s type and code location in addition to developer feedback to prioritize actionable alerts. The first empirical study investigates hypotheses 1-3 using
FAULTBENCH on 15 SAAI models generated on five treatments for each of three subject
programs. The treatments considered different grouping of alerts within revisions to train and test SAAI. The second empirical study is a comparative evaluation of the generated SAAI
models with other actionable alert identification techniques in further evaluation of Hypothesis 2. Additionally, an empirical user study was conducted where students in the senior capstone project course used a custom SAAI model during development of their
software project.
Selection of predictive artifact characteristics as part of the SAAI process suggests the
acceptance of hypothesis 1. All but four of the 58 artifact characteristics used to build SAAI
models were in one or more of the artifact characteristics subsets. The SAAI model identified actionable and unactionable alerts with greater than 90% accuracy for eight of the 15
FAULTBENCH subject treatments. Comparing SAAI models with other actionable alert identification techniques from literature found that SAAI models had the highest accuracy for
The contributions of this work are as follows:
• A systematic actionable alert identification model building process to predict actionable and unactionable automated static analysis alerts;
• A benchmark, FAULTBENCH, for evaluating and comparing actionable alert identification techniques; and
A Systematic Model Building Process for Predicting Actionable Static Analysis Alerts.
by
Sarah Smith Heckman
A dissertation submitted to the Graduate Faculty of North Carolina State University
in partial fulfillment of the requirements for the Degree of
Doctor of Philosophy
Computer Science
Raleigh, North Carolina 2009
APPROVED BY:
_______________________________ ______________________________
Laurie Williams Steffen Heber
Committee Chair
________________________________ ________________________________
DEDICATION
BIOGRAPHY
ACKNOWLEDGMENTS
Many people have supported and encouraged me throughout this journey, and I would not have accomplished all that I have without them.
To Walt. Thank you for keeping me sane and motivated. You have inspired me to be a better person, comforted me during periods of stress, and ensured that I had fun along the way. I could not have done this without you
To Mom and Dad. Thank you both for always encouraging me towards my best. I knew that I could accomplish anything I set my mind to because you both believed in me. Thank you, Mom, for always listening when I needed to talk. Thank you, Dad, for being an example of following your dreams and doing something that you love every day. I hope to look forward to each day of work as you do.
To Patrick. Thank you for always believing in me. Your creativity and passion for your music and art is so inspiring.
To my uncle, Andy. Without you, I would never have considered Computer Science as a major, and found a career that I love. You always pushed me academically, and I hope that I have made you proud.
To Laurie. Thank you so much for being my advisor. Without you, I would not have pursued a Ph.D. You have provided me with guidance and motivation, while allowing me to grow and pursue other activities outside of my research. You have been and continue to be an inspiration of all that is possible in an academic career and life.
To the Realsearch Group (past and present): Nachi, Hema, Jiang, Mark, Dright, Lucas, Michael, Yonghee, Stephen, Andy, Lauren, Ben, Patrick, Raza, and Sophia. I could not have asked for a better group of people to work with during my graduate career. You all have taught me so much, making me a better person and researcher. Reading group, while painful, has been invaluable in ensuring that my presentation, theory, and results are as clear and correct as possible. Extra thanks to Ben who helped with last minute statistical advice in preparation of this document and for naming FAULTBENCH.
To my friends: Alex, Bill, Brandon, Diana, Donna, Kate, Kathryn, Khedron, Larz, Liz, Michael, Phyl, Rebecca, and Sarah. Thank you for reminding me that there is more to life than research: like cookouts, shopping, and fun!
To my committee. Thank you for your feedback and encouragement.
Funding. I have been funded by a CACC grant and an IBM Ph.D. Fellowship from 2006-2009.
Some of the work in this dissertation is revised and expanded from the following conference publications, which are copyright of the following organizations:
• S. Heckman and L. Williams, "On Establishing a Benchmark for Evaluating Static Analysis Alert Prioritization and Classification Techniques," Proceedings of the 2nd International Symposium on Empirical Software Engineering and Measurement, Kaiserslautern, Germany, October 9-10, 2008, pp. 41-50. © ACM, 2008.
TABLE OF CONTENTS
LIST OF TABLES ... x
LIST OF FIGURES ... xi
LIST OF ABBREVIATIONS…... xii
1 Introduction... 1
2 Related Work ... 5
2.1 AAIT Overview ... 6
2.1.1 Alert Type Selection ... 7
2.1.2 Contextual Information ... 7
2.1.3 Graph Theory ... 8
2.1.4 Test Case Failures from Hybrid Analysis ... 8
2.1.5 Mathematical and Statistical Models ... 9
2.1.6 Machine Learning ... 9
2.1.7 Data Fusion ... 9
2.2 Classification AAITs ... 9
2.2.1 Ogasawara, et al., 1998 ... 10
2.2.2 Xiao and Pham, 2004 ... 10
2.2.3 Williams and Hollingsworth, 2005 ... 11
2.2.4 Aggarwal and Jalote, 2006... 12
2.2.5 Boogerd and Moonen, 2008b... 13
2.2.6 Csallner, et al., 2008 ... 14
2.3 Prioritization AAITs ... 15
2.3.1 Kremenek and Engler, 2003 ... 15
2.3.2 Kremenek, et al., 2004 ... 17
2.3.3 Jung, et al., 2005 ... 18
2.3.4 Kim and Ernst, 2007a ... 19
2.3.5 Kim and Ernst, 2007b ... 20
2.3.6 Kong, et al., 2007 ... 21
2.3.7 Yi, et al., 2007... 22
2.3.8 Boogerd and Moonen, 2008a... 23
2.3.9 Meng, et al., 2008 ... 25
2.3.10 Ruthruff, et al., 2008 ... 25
3 FAULTBENCH... 27
3.1 Related Work ... 28
3.2 FAULTBENCH Process... 30
3.2.1 Generate Subject Revision History... 30
3.2.2 Subject Build Process ... 31
3.2.3 Alert Oracle Creation ... 31
3.2.5 AAIT Evaluation Process ... 33
3.3 Definition of FAULTBENCH... 34
3.3.1 Motivating Comparison ... 34
3.3.2 Task Sample... 34
3.3.2.1 jdom... 37
3.3.2.2 runtime... 37
3.3.2.3 logging... 37
3.3.3 Evaluation Metrics ... 38
3.4 Desiderata for Benchmarks... 42
3.5 Threats to Validity ... 43
4 Feasibility Study ... 45
4.1 Adaptive Prioritization Model Process ... 47
4.1.1 Size Context ... 48
4.1.2 Developer Context ... 48
4.1.3 Artifact Characteristics ... 49
4.1.4 Adaptive Prioritization Models... 50
4.1.5 APM Limitations ... 50
4.2 Case Study ... 51
4.2.1 Study Setup ... 52
4.2.2 Research Questions ... 54
4.2.3 Q1: Improving Anomaly Detection Rate ... 54
4.2.4 Q2: Comparing Prioritizations... 57
4.2.5 Q3: Categorizing Alerts ... 58
4.2.6 Discussion ... 59
5 Systematic Actionable Alert Identification Model Building Process ... 60
5.1 Step One: Data Collection ... 62
5.1.1 Alert Identifiers and Alert History... 63
5.1.2 Software Metrics ... 64
5.1.3 Source Code History ... 65
5.1.4 Source Code Churn ... 66
5.1.5 Aggregate Characteristics ... 66
5.2 Step Two: Artifact Characteristic Selection ... 68
5.2.1 Search Strategies ... 69
5.2.2 Evaluation Methods ... 70
5.3 Step Three: Machine Learning Model Creation ... 70
5.3.1 Classification Rules ... 71
5.3.2 Decision Trees ... 72
5.3.3 Functions... 73
5.3.4 Nearest Neighbor ... 73
5.3.5 Bayesian Networks ... 74
5.4 Step Four: Model Evaluation ... 75
6.1 Hypothesis 1... 77
6.2 Hypothesis 2... 83
6.3 Hypothesis 3... 87
6.4 Limitations ... 89
6.5 Summary ... 89
7 Comparative Evaluation... 91
7.1 jdom... 92
7.2 runtime...101
7.3 logging...107
7.4 Limitations ...114
7.5 Summary ...115
8 User Study...116
8.1 Study Setup ...116
8.2 Model Generation ...118
8.3 Study Results ...119
8.4 Limitations ...123
9 Contributions and Future Work ...124
REFERENCES ...127
APPENDIX...133
LIST OF TABLES
Table 2.1 Summarization of related work... 6
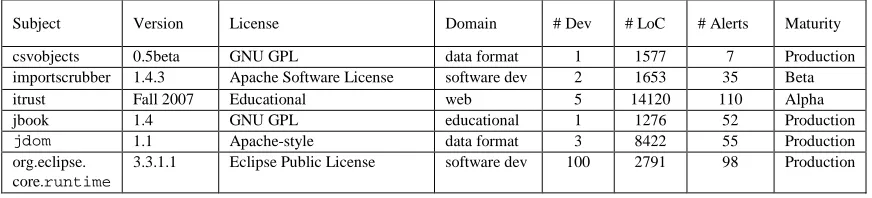
Table 3.1 FAULTBENCH V0.3subject programs ... 35
Table 4.1 Experimental treatments for benchmark evaluation ... 50
Table 4.2 FAULTBENCH V0.1subject programs ... 52
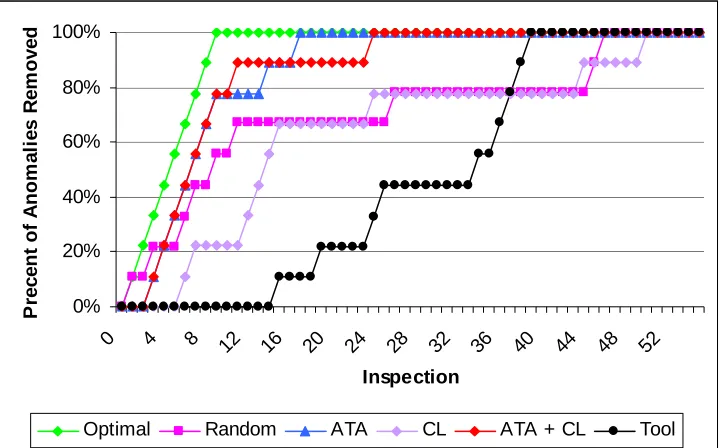
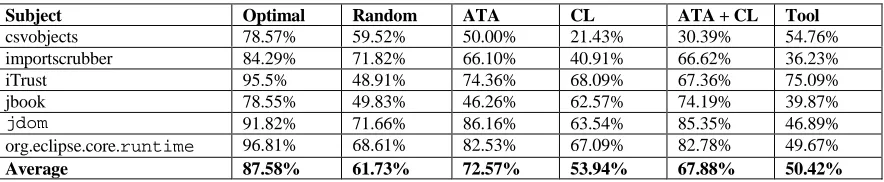
Table 4.3 Area under the anomaly detection curve for prioritization techniques.... 56
Table 4.4 Spearman rank correlation ... 57
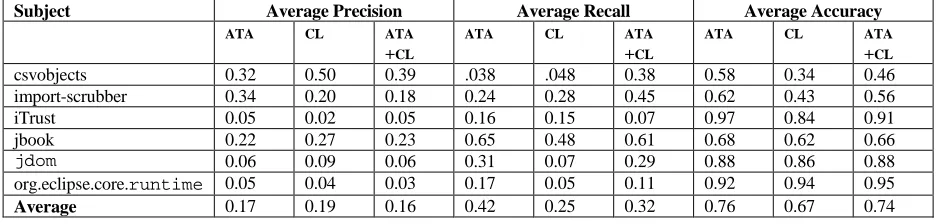
Table 4.5 Average precision, recall, and accuracy metrics of un-inspected alerts at each inspection... 58
Table 6.1 Train and test alert counts ... 77
Table 6.2 Artifact characteristics selection counts for FAULTBENCH subject programs ... 78
Table 6.3 SAAI best models for jdomtreatments ... 84
Table 6.4 SAAI best models for runtimetreatments ... 85
Table 6.5 SAAI best models for loggingtreatments ... 85
Table 6.6 Accuracy when switching models for treatment 100 SAAI... 88
Table 7.1 jdom summary data ... 94
Table 7.2 runtime summary data ...102
Table 7.3 logging summary data ...109
LIST OF FIGURES
Figure 3.1 An alert’s lifecycle ... 32
Figure 3.2 Classification table (adapted from Zimmermann et al. [52])... 39
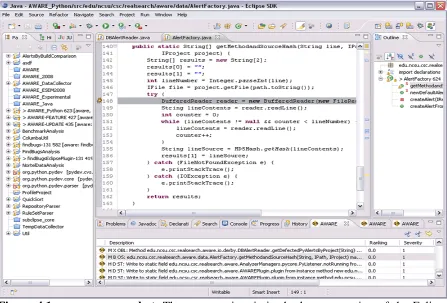
Figure 4.1 AWARE screenshot ... 46
Figure 4.2 Anomaly detection curves for jdom... 55
Figure 6.1 Histogram of artifact characteristic selection counts across subjects ... 81
Figure 7.1 Accuracy across treatments for each AAIT on jdom... 96
Figure 7.2 Precision across treatments for each AAIT on jdom... 98
Figure 7.3 Recall across treatments for each AAIT on jdom...100
Figure 7.4 Accuracy across treatments for each AAIT on runtime...104
Figure 7.5 Precision across treatments for each AAIT on runtime...105
Figure 7.6 Recall across treatments for each AAIT on runtime...106
Figure 7.7 Accuracy across treatments for each AAIT on logging...111
Figure 7.8 Precision across treatments for each AAIT on logging...112
LIST OF ABREVIATIONS
AAIT ... Actionable Alert Identification Technique
APM... Adaptive Prioritization Model
ASA...Automated Static Analysis
ATL-D... Alert Type Lifetime in Days
ATL-R... Alert Type Lifetime in Revisions CNC... Check ‘n’ Crash
HWP... History-based Warning Prioritization LRM... Logistic Regression Model
1 Introduction
Automated static analysis (ASA) tools can identify potential source code anomalies, like null pointers, buffer overflows, and unclosed streams, that could lead to field failures [21]. IEEE defines an anomaly “as a condition that deviates from expectations based on requirements specifications, design documents, user documents, or standards, or from someone’s perceptions or experiences” [24]. These potential anomalies, which we call alerts, require inspection by a developer to decide if the alert is important enough to fix [3]. If a developer decides the alert is an important, fixable anomaly, then we call the alert an actionable alert [18, 19, 41]. When an alert is not an indication of an actual code anomaly or the alert is deemed unimportant to the developer (e.g. the alert indicates a source code anomaly inconsequential to the program’s functionality), we call the alert an unactionable alert [18, 19].
justifies the cost of using ASA. Identification of actionable alerts generated by ASA could reduce the inspection overhead associated with ASA.
Improving ASA’s ability to generate predominantly actionable alerts through development of tools that are both sound1 and complete2 is an intractable problem [9, 10]. Additionally, the development of algorithms underlying ASA requires a trade-off between the level of analysis and execution time [9]. Applying a very detailed analysis can report more alerts likely to be actionable [6], but may increase the time for running ASA [51]. Annotations can improve ASA by supplying conditions and invariants about the code under analysis, but the annotations may be specified incorrectly, and their creation requires developer overhead [14]. Customizing an ASA tool by selecting properties, like the type of alerts to search for, may also lead to a reduction of reported alerts and unactionable alerts [51], but may miss some actionable alerts.
Another way to reduce inspection overhead when using static analysis is to use the alerts generated by ASA with other information about the software under analysis, called artifact characteristics, to prioritize or classify alerts. We call these techniques actionable alert identification techniques3 (AAIT). AAITs supplement ASA tools by classifying or prioritizing the alerts generated by ASA such that the likelihood of a developer inspecting
1 For this research, we consider the generation of an alert as the indication of a potential anomaly. Therefore, sound static analysis ensures that all reported alerts are anomalies (actionable) [11].
2
For this research, we consider the generation of an alert as the indication of a potential anomaly. Therefore, complete static analysis ensures that if there is a place where an anomaly could occur in the source code, the tool reports an alert [11].
actionable alerts earlier is increased. Classification AAITs divide alerts into two groups: alerts likely to be actionable and alerts likely to be unactionable [18]. Prioritization AAITs order alerts by the likelihood an alert is an indication of an actionable alert [18]. By classifying and prioritizing ASA alerts, the developer will focus his or her time on inspecting and fixing actionable alerts rather than inspecting and suppressing unactionable alerts.
The goal of my research is to reduce inspection time by accurately predicting actionable and unactionable alerts when using static analysis by creating and validating a systematic actionable alert identification model. Investigation of the following three hypotheses will inform the goal of my research:
• Hypothesis 1: The artifact characteristics of an alert and the surrounding source code are predictive of the actionability of an alert.
• Hypothesis 2: A systematic actionable alert identification technique using machine learning can accurately identify actionable alerts.
• Hypothesis 3: A systematic actionable alert identification technique using machine learning is project specific.
These hypotheses guided the creation and evaluation of the Systematic Actionable Alert Identifier (SAAI) process and were used to evaluate the efficacy of using an AAIT
synergistically with ASA.
A benchmark, FAULTBENCH [18], was created as part of this research to provide the evaluation framework for the proposed SAAI process and the comparison of SAAI with other
evaluate the above hypotheses. The feasibility study uses FAULTBENCH to evaluate three initial AAITs, which utilize the alert’s type and location to predict if the alert is actionable. The first empirical study investigates hypotheses 1-3 using FAULTBENCH on 15 SAAI models generated on five treatments for each of three subject programs. The treatments considered different grouping of alerts within revisions to train and test SAAI. The second empirical study is a comparative evaluation of the generated SAAI models with other AAIT from literature in further evaluation of Hypothesis 2. Additionally, an empirical user study was conducted where students in the senior capstone project course at North Carolina State University used AWARE4 containing a custom SAAI model during development of their
software project. Data collected by the AAIT tooling and the student’s responses to a survey are reported.
The remainder of this dissertation is organized as follows: Chapter 2 discusses related work in the form of other AAITs, Chapter 3 presents FAULTBENCH, a benchmark for evaluating and comparing AAITs, Chapter 4 presents a feasibility study that provides the foundational work to the SAAI proposed in Chapter 5. Chapter 6 describes how SAAI
performs on FAULBENCH and Chapter 7 compares SAAI with other AAIT. Chapter 8 presents a user study and Chapter 9 concludes, lists the contributions, and future work.
2 Related Work
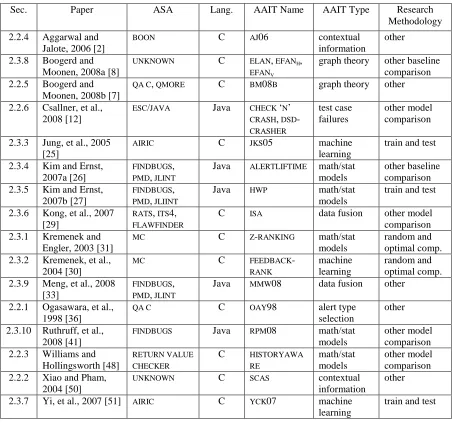
Table 2.1. Summarization of related work. A listing of the ASA supplemented by the proposed AAIT, the programming language, the AAIT name, the high-level AAIT type (as discussed in Section 2.1), and the research methodology used to evaluate the AAIT proposed in each reference.
Sec. Paper ASA Lang. AAIT Name AAIT Type Research
Methodology 2.2.4 Aggarwal and
Jalote, 2006 [2]
BOON C AJ06 contextual
information
other 2.3.8 Boogerd and
Moonen, 2008a [8]
UNKNOWN C ELAN, EFANH,
EFANV
graph theory other baseline comparison 2.2.5 Boogerd and
Moonen, 2008b [7]
QA C, QMORE C BM08B graph theory other
2.2.6 Csallner, et al., 2008 [12]
ESC/JAVA Java CHECK ‘N’ CRASH, DSD -CRASHER
test case failures
other model comparison 2.3.3 Jung, et al., 2005
[25]
AIRIC C JKS05 machine
learning
train and test 2.3.4 Kim and Ernst,
2007a [26]
FINDBUGS, PMD, JLINT
Java ALERTLIFTIME math/stat models
other baseline comparison 2.3.5 Kim and Ernst,
2007b [27]
FINDBUGS, PMD, JLIINT
Java HWP math/stat models
train and test 2.3.6 Kong, et al., 2007
[29]
RATS, ITS4, FLAWFINDER
C ISA data fusion other model comparison 2.3.1 Kremenek and
Engler, 2003 [31]
MC C Z-RANKING math/stat
models
random and optimal comp. 2.3.2 Kremenek, et al.,
2004 [30]
MC C FEEDBACK
-RANK
machine learning
random and optimal comp. 2.3.9 Meng, et al., 2008
[33]
FINDBUGS, PMD, JLINT
Java MMW08 data fusion other 2.2.1 Ogasawara, et al.,
1998 [36]
QA C C OAY98 alert type
selection
other 2.3.10 Ruthruff, et al.,
2008 [41]
FINDBUGS Java RPM08 math/stat
models
other model comparison 2.2.3 Williams and
Hollingsworth [48]
RETURN VALUE CHECKER
C HISTORYAWA
RE
math/stat models
other model comparison 2.2.2 Xiao and Pham,
2004 [50]
UNKNOWN C SCAS contextual
information
other 2.3.7 Yi, et al., 2007 [51] AIRIC C YCK07 machine
learning
train and test
2.1 AAIT Overview
alerts listed blow. The specific AAIT used in each study are described in Section 2.2 and 2.3, below.
2.1.1 Alert Type Selection
ASA tools list the types of problems that can be detected (e.g. a potential null pointer access or an unclosed stream) via a detector or bug pattern, which we call alert type. ASA tools may allow for selection of individual alert types by the user. Selecting alert types that are more relevant for a code base leads to the reduction of reported unactionable alerts, but may also lead to the suppression of actionable alerts in the types that were not selected. Alert type selection works best for alert types that tend to be homogeneous by type (e.g. where all alerts of a type are either actionable or unactionable, but not both) [26, 27, 30]. The alert types that are most relevant may vary by code base. Therefore, a study of the actionability of alert types for a particular code base is required to select the appropriate types. If alerts sharing the same type have been fixed in the past, then the other alerts of that type are likely actionable. AAITs that use alert type selection either use the alert history for a project that can be found through mining the source code repository or bug database or additional knowledge about the specific alert types to determine which alert types to select for a project.
2.1.2 Contextual Information
unactionable alerts can be reduced. The selection of code areas to analyze by ASA can be a manual or automated process created by knowledge of the ASA tool’s limitations. Contextual information techniques identify areas of code where ASA will identify the most actionable alerts and the fewest unactionable alerts [2, 50].
2.1.3 Graph Theory
AAITs that use graph theory to identify actionable alerts take advantage of the source code’s structure to provide additional insight to static analysis. System dependence graphs provide insight into both the control and data flow for a program and are used to calculate the execution likelihood of a particular location of code that contains a static analysis alert [6, 8]. Other graphs of artifact characteristics, like the source code repository history, can also show the relationship between source code changes that may be associated with openings and closures of static analysis alerts [7].
2.1.4 Test Case Failures from Hybrid Analysis
2.1.5 Mathematical and Statistical Models
AAITs may use mathematical or statistical models to determine if an alert is actionable or unactionable. In some cases, these AAITs may exploit knowledge about the specific ASA tool and where mistakes may be made in the analysis to determine if other alerts are actionable or not [31]. Other AAITs may use the history of the code to build a linear model that may predict actionable alerts [26, 27, 41, 48]. Additionally, knowledge about the ASA tools and the observed relationships between the alerts can be used to create linear and other mathematical models [18].
2.1.6 Machine Learning
Machine learning “is the extraction of implicit, previously unknown, and potentially useful information about data” [49]. Machine learning techniques find patterns within sets of data and may then use those patterns to predict if new instances of the data are similar to other instances. AAITs can use machine learning to predict or prioritize alerts as being actionable or unactionable by using information about the alerts and surrounding code [19, 25, 30, 51].
2.1.7 Data Fusion
Data fusion combines data from multiple ASA tools and merges redundant alerts. Similar alerts from multiple tools increase the confidence that an alert is actionable [29].
2.2 Classification AAITs
the foundation for predicting actionable alerts. The subsections below describe the seven classification AAITs.
2.2.1 Ogasawara, et al., 1998
Ogasawara, et al. [36] use alert type selection to identify the most actionable alerts types. The static analysis team identified the 41 alert types from over 500 alert types available in QA C from their experiences using ASA. Out of initial 1,459 alerts generated by
QA C, 250 alerts were of the selected alert types and 88 of those alerts were found to be
actionable. Thirty percent of the 88 actionable alerts were found to be serious problems in the system during inspection.
One limitation not discussed by Ogasawara, et al., is that not all of the alerts of the types removed from the analysis may be unactionable (i.e. actionable alerts were suppressed resulting in a false negative). For the alert types that remain in the analysis, there may still be many unactionable alerts that are generated.
2.2.2 Xiao and Pham, 2004
the developer’s beliefs about software requirements. The beliefs inferred from the context of the source code are combined with a lexical analysis of the comments to determine if missing break alerts are actionable or unactionable. The unreachable code detector maintains a database of patterns that suggest unreachable code. Alerts reported about unreachable code may be compared with the patterns in the database. Additionally, any unreachable code alert suppressed by the developer in the user interface of their tool is transformed into the constituent pattern and recorded in the database. The additional techniques suggested by Xiao and Pham may generate overhead making them too costly to use in-process. Xiao and Pham [50] find that their unactionable alert suppression technique suppresses 32% of the generated alerts.
2.2.3 Williams and Hollingsworth,2005
Williams and Hollingsworth [48] use a mathematical and statistical model in addition to source code repository mining to drive the creation of an ASA tool and to improve the prioritized listing of alerts. The static analysis tool Williams and Hollingsworth created identifies locations where the return value of a function call is not checked before use. Alerts associated with the called function are grouped together, and the called functions are ranked using the HISTORYAWARE prioritization technique. HISTORYAWARE first groups functions by
functions. If the return value of a function is checked most of the time, then the prioritization of that function is high, indicating that instances where the return value is not checked are likely actionable. However, if the return value of a function is almost never checked, then the alerts are likely unactionable. When the return value of a called function is always or never checked, the tool does not alert the developer because there are no inconsistencies.
Williams and Hollingsworth [48] perform a case study to compare a naïve ranking of the alerts based on the current version of code and the HISTORYAWARE prioritization.. They
measure the precision and recall of the classification. The precision of the top 50 alerts generated by static analysis is 62.0% for HISTORYAWARE and 53.0% for NAÏVERANKING for
Wine5 and 42.0% for HISTORYAWARE and 32.0% for NAÏVERANKING for Apache httpd6. The
HISTORYAWARE ranking has a false positive rate between approximately 0 and 70% across the contemporary context of the alerts. The NAÏVERANKING false positive rate between 50%
and 100% on the same contemporary context.
2.2.4 Aggarwal and Jalote, 2006
Aggarwal and Jalote [2] use contextual information to identify potential buffer overflow vulnerabilities, as represented by the strcpy library function in C source code, quickly and effectively through a combination of static and dynamic analysis. The ASA tool, BOON [45], has difficulty in understanding aliased pointers, which may lead to BOON missing buffer
overflow vulnerabilities. Dynamic tools, like STOBO [16], can find vulnerabilities where
5 Wine is an open source program for running Windows applications on Linux, Unix, and other similar operating systems. Wine may be found at: http://www.winehq.org/.
6
static analysis fails. Dynamic analysis requires the generation of test cases, which can increase the time required to use the tool. Aggarwal and Jalote [2] created a tool that identifies areas of code that require buffer overflow analysis and marks the code where pointers are aliased and where they are not. The latter are better for static analysis while the former necessitate dynamic analysis.
Aggarwal and Jalote [2] ran their analysis on rdesktop and wzdftpd and found an increase in static analyzer accuracy and a reduction of test cases required to find buffer overflow vulnerabilities. The analysis of wzdftpd showed that only 37.5% of the dangerous strcpy functions in the code required dynamic analysis. The tool generated by Aggarwal and Jalote [2] for identifying aliased pointers, is limited when structured elements are aliased. Additionally, the buffer overflow vulnerability is not restricted to strcpy functions only. Therefore, the technique can only identify a subset of buffer overflow vulnerabilities.
2.2.5 Boogerd and Moonen, 2008b
underlying anomaly. Spatial coincidence reduces the noise from temporal coincidence by assessing the type of change made that removed an alert. Alerts are considered actionable if they are associated with changes due to fixing faults rather than other source code changes. The requirement for generating spatial coincidence is that changes in the source code that are checked into the repository should be associated with bugs listed in the bug database.
Boogerd and Moonen [7] use graph theory to prioritize alert types. A version history graph is created for each file and is annotated with code changes on each edge. Alerts closed due to fixing a fault increment the alert count. After all versions of a file are evaluated, the remaining open alerts contribute to the overall count of generated alerts. The actionable alert rate values can be used to prioritize alert types in future versions of software.
Boogerd and Moonen [7] used the MISRA-C style rules reported by QA C and compared the alert closures with faults fixed in the history of the development of an embedded mobile TV software (TVoM). The experiment considers 214 revisions of the TVoM project developed between August 2006 until June 2007. Information about the bug reports were mined from the bug database, and had to meet the following requirements: 1) reports were a bug and not a functional change request; 2) associated with the C portions of the project; and 3) reports that were closed on or before June 2007.
2.2.6 Csallner, et al., 2008
are likely actionable. The CHECK ‘N’ CRASH and DSD-CRASHER tooling, respectively, are evaluated in Csallner, et al. [12].
Csallner et al. [12] used JBoss JMS and Groovy as subjects to compare CHECK ‘N’ CRASH
with DSD-CRASHER. Csallner et al. found that they could eliminate one unactionable alert
when using DSD-CRASHER for JBoss JMS and seven unactionable alerts when analyzing Groovy. Additionally, Csallner, et al. compared DSD-CRASHER with ECLAT [38], a dynamic tool. DSD-CRASHER found three class cast exceptions that ECLAT did not find for JBoss JMS
and two additional alerts that ECLAT missed when analyzing Groovy. Finally, Csallner, et al. investigated how well the ASA underlying CHECK ‘N’ CRASH and DSD-CRASHER, ESC/JAVA 2,
finds bugs seeded in open source projects. They evaluated three versions of Apache XML Security containing 13-20 seeded bugs. Approximately half of the seeded bugs are unable to be found by ESC/JAVA 2, and the remainder that could be associated with alerts generated by ESC/JAVA 2 had no associated failing test cases generated by DSD-CRASHER.
2.3 Prioritization AAITs
Prioritization AAITs order alerts by the likelihood an alert is an indication of an actionable alert [18]. The subsections below describe the 10 prioritization AAITs.
2.3.1 Kremenek and Engler, 2003
the premise that alerts, identified by the same detector, and associated with many successful checks are likely actionable. Additionally, Kremenek and Engler hypothesize that unactionable alerts are associated with many other unactionable alerts. A special case is that if there are no successful checks then the alerts are likely unactionable. A hypothesis test is run on the proportion of successful checks out of all reports for a given grouping of checks. Alerts are grouped by an artifact characteristic, called a grouping operator, the alerts have in common (e.g. call site, number of calls to free memory, function). The hypothesis testing allows for consideration of the size of each possible grouping of checks, and the final number is called a z-score. Alerts generated by static analysis are prioritized by their z-score. A limitation of the z-ranking technique is that the prioritization’s success depends on the grouping operator.
Kremenek and Engler [31] compare alerts ranked with the z-ranking technique against an optimal and random ranking of the same alerts. The ranking of the alerts are evaluated for each of alert types reported by MC. A hypergeometric distribution is used to generate the random ordering of alerts.
Additionally, Kremenek and Engler randomly generate 1.0 x 10⁵ ordering of alerts, and determine the number of orderings that are better than the ordering generated by the z-ranking technique. At most, 1.5% of the random orderings were better than alerts ordered by z-ranking.
2.3.2 Kremenek, et al.,2004
Based on the intuition that alerts sharing an artifact characteristic tend to be either all actionable or all unactionable, Kremenek et al. [30] developed an adaptive prioritization algorithm, FEEDBACK-RANK that prioritizes alerts generated by the MC ASA tool. Each inspection of an alert by a developer adjusts the ranking of uninspected alerts. After each inspection, the set of inspected alerts are used to build a Bayesian Network (a machine learning algorithm), which models the probabilities that groups of alerts sharing a
characteristic (e.g. location in the course code) are actionable or unactionable. Additionally, a value representing how much additional information inspecting the report will provide to the model is generated for each alert. The information gain value is used to break ties between alerts with the same probability of being an anomaly.
Kremenek et al. [30] compare alerts ordered by their FEEDBACK-RANK to the optimal and random ordering of the same alerts. For the FEEDBACK-RANK algorithm, they consider two
lead to a better initial prioritization of alerts. Additionally, Kremenek et al. use three different alert sets to generate different models, in particular the conditional probability distribution of the Bayesian Network: the entire code base, self-trained, and a 90% reserved model. For the Bayesian Network trained on the entire code base, all of the generated alerts and their classifications are used to build the conditional probability distribution of the actionable and unactionable alerts. For the self-trained set, the conditional probability distribution values are trained on the set of alerts that are also ranked by the Bayesian Network. Finally, in the 90% reserved model, 90% of the alerts are used to train the conditional probability distributions for the Bayesian Network and the model is tested on the remaining 10% of alerts.
Kremenek et al. [30] use a custom metric, performance ratio, to compare the rankings generated via their technique and the random ordering of alerts. Performance ratio is the ratio between random and the ranking techniques’ “average inspection ‘delay’ or ‘shift’ per bug from optimal.” The results show that all detectors in the MC system show a 2-8x improvement of performance ratio over random when using feedback-rank. The self-trained Alock detector model showed a 6-8x improvement of performance ratio over random when seeded with partial knowledge some alert classifications.
2.3.3 Jung, et al., 2005
array information). The model is generated via inspected alerts generated on the Linux kernel code and several textbook C programs. A user-specified threshold limits the number of alerts reported to developers, which reduces the set of alerts for a developer to inspect.
The train and test technique was used to evaluate the proposed prioritization technique. The alerts were randomly divided into two equal sets. One set was used to train a Bayesian model using the artifact characteristics (which Jung, et al. [25] call symptoms)generated for each alert, and the model was tested on the second set of alerts. The training and testing of models was repeated 15 times.
Jung, et al. [25] evaluated their prioritization technique on “… some parts of the Linux kernel and programs that demonstrate classical algorithms.” The precision, recall, and accuracy are 38.7%, 68.6%, and 73.7%, respectively. Additionally, 15.17% of the unactionable alerts were inspected before 50% of the actionable alerts were inspected. Jung et al. observe that if the threshold for “trueness” is lowered, then all actionable alerts will be provided to the user at the cost of an unknown additional amount of unactionable alerts.
2.3.4 Kim and Ernst, 2007a
line and name changes occur leads to error in the alert lifetime measurement and the variance of lifetimes for an alert type is unknown. The technique assumes that important problems are fixed quickly; however, alerts that are fixed quickly may be the easiest bugs to fix and not the most important alerts [26].
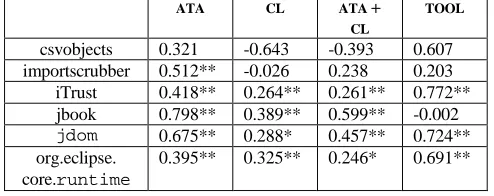
Kim and Ernst [26] validate their alert lifetime prioritization model by comparing the alerts ordered by lifetime with alerts ordered by the tool specified severity, and found that the alert lifetime prioritization did not correspond to the tool specified severity. Additionally, the alert lifetime prioritizations between two projects are compared. The correlation coefficient between the alert type prioritization between the subject programs was 0.218, which demonstrates that the alert type ordering for one program may not be applicable for another program.
2.3.5 Kim and Ernst, 2007b
Kim and Ernst [27] use the commit messages and code changes in the source code repository to prioritize alert types using a mathematical model. The history-based warning prioritization (HWP) weights alert types by the number of alerts closed by fault- and non-fault fixes. A fault-fix is a source code change where a fault or problem is fixed (as identified by a commit message) while a non-fault fix is a source code change where a fault or problem is not fixed, like a feature addition. The initial weight for an alert type is zero. At each fault-fix the weight increases by an amount, α. For each non-fault-fix, the weight increases by 1-
prioritization technique considers all alert sharing the same type in aggregate, which assumes that all alerts sharing the same type are homogeneous in their classification. The prioritization fails for alerts generated in later runs of ASA if the alert type never appears in earlier versions of the code.
The fix-change prioritization suggested by Kim and Ernst [27] was evaluated by training the model using the first (n/2)-1 revisions and then testing the model on the latter half of the revisions. The precision of the tool’s alert prioritization with the prioritization of alerts based on the project’s history were compared. The best precision for the three subject programs (Columba, Lucene, and Scarab) is 17%, 25%, and 67%, respectively when using HWP as
compared to 3%, 12%, and 8%, respectively when prioritizing the alerts by the tool’s severity or priority measure. Additionally, when only considering the top 30 alerts, the precision of the fix-based prioritization is almost doubled, and in some cases tripled, from the tool’s ordering of alerts.
2.3.6 Kong, et al.,2007
Kong, et al. [29] compare the prioritization of alerts when using data fusion of three tools with each of the tools individually. All of the subject programs, wuftpd7, Net-tools8, and Pure-ftpd9, have known vulnerabilities. The results show that ISA has a lower rate of false positives and false negatives than the individual ASA for two of the three subject programs. Additionally, ISA is found to be more efficient (defined as the likelihood of finding a vulnerability when inspecting the alerts) than the individual static analysis tools.
2.3.7 Yi, et al., 2007
Yi et al. [51] compare the prioritization of actionable and unactionable alerts for several machine learning algorithms. The static analysis tool AIRAC, finds potential buffer overrun
vulnerabilities in C code. Three types of symptoms or artifact characteristics may be predictive of actionable alerts: syntactic, semantic, and information about the buffer uncovered by static analysis. Yi et al. did not consider attribute subset selection techniques to identify uncorrelated symptoms except when building linear regression.
Yi et al. [51] utilize eight machine learning techniques to prioritize static analysis alerts into actionable and unactionable groups. The symptoms about the alerts are the independent variables and the classification of the alert is the dependent variable. The alerts are divided into a training and test set using an approximately two-thirds one-third split. The
7 wu-ftpd is ftp software for Unix systems.
8 Net-tools are network security tools: http://users.telenet.be/ahmadi/nettools.htm. 9
test cycle is repeated 100 times. The results are summed over all 100 models. The open-source statistical program R10 was used to train and test the models.
Yi et al. evaluated their alert classification models on 36 files and 22 programs, the details of which are not provided. Overall, there were 332 alerts generated for all of the sample programs. The different machine learning techniques were evaluated by comparing the ACU of ROC curves were compared. The closer the area is to 1, the better the performance of the model. The AUC for the ROC curves varied from 0.8745-0.9290. Additionally, only 0.32% of the unactionable alerts were identified before the first 50% of the actionable alerts. Also, 22.58% of the actionable alerts were inspected before the first unactionable alert was inspected.
2.3.8 Boogerd and Moonen, 2008a
Boogerd and Moonen [8] prioritize alerts by execution likelihood [6] and by execution frequency [8] using graph theory. Execution likelihood is defined as “the probability that a given program point will be executed at least once in an arbitrary program run” [8]. Execution frequency is defined as “the average frequency of [program point] v over all possible distinct runs of [program] p” [8]. Alerts with the same execution likelihood are prioritized the same, but may actually have varying importance in the program. Execution frequency solves the limitation of execution likelihood by providing a value of how often the code will be executed [8].
10
Prediction of the branches taken when calculating the execution likelihood and frequency are important to the Execution Likelihood ANalysis (ELAN) and Execution Frequency
ANalysis (EFAN) techniques introduced by Boogerd and Moonen [8]. The ELAN AAIT (introduced in [6]) traverses the system dependence graph of the program under analysis and generates the execution likelihood of an alert’s location and heuristics are used for branch prediction. There are two variations of the EFAN AAIT: one uses heuristics for branch prediction based on literature in branch prediction (EFANH) and the other uses value range
propagation (EFANV). Value range propagation estimates the values of variables from
information in the source code.
Five open source programs (Antiword, Chktex, Lame, Link, and Uni2Ascii) were used in the case study to compare ELAN and EFAN. Boogerd and Moonen [6, 8] compare the effectiveness of their prioritization technique with actual execution data, gathered by automated regression test runs, and not with the actual actionability of ASA alerts.
Boogerd and Moonen [8] use Wall’s unweighted matching method [47] to compare the prioritized list of alerts with the list of alerts ordered by the actual execution data. The ELAN
AAIT had an average correlation of 0.39 with the actual execution values for the top 10% of alerts, which outperformed the EFANH and EFANV with correlations of 0.28 and 0.17,
2.3.9 Meng, et al., 2008
Meng et al. [33] propose a data fusion approach that merges alerts that are common across multiple static analysis tools run on the same source code. The combined alerts are first prioritized by the severity of the alert and are then prioritized by the number of tools that identify the alerts. A map associates alerts for a specific tool to a general alert type. Meng et al.’s [33] technique has the same limitations as Kong et al. [29].
Meng et al. [33] evaluate their data fusion technique on a small, unnamed, sample program. They run FindBugs, PMD, and JLint on the subject program. Meng et al. [33] report four of the alerts generated for the small subject program, one of which was reported by two tools.
2.3.10 Ruthruff, et al., 2008
Ruthruff et al. [41] considered two types of models: one for predicting unactionable alerts and the other for predicting actionable alerts. For the actionable alerts model, two specific models were built: one considered only alerts identified as actionable and the second considered all alerts.
Ruthruff et al. [41] evaluate their prioritization technique by comparing their models with a modified model from related work in fault identification and a model built using all of the suggested artifact characteristics. The related work models use complexity metrics to predict faults and come from the work by Bell, Ostrand, and Weyuker [4, 37]. Ruthruff et al. [41] adapt the models, which they call BOW and BOW+, for alert prioritization. The BOW model is
directly from the work by Bell, et al. The BOW+ models include two static analysis metrics, the bug type and the alert priority, in addition to the complexity metrics. The model generated by identifying the most important artifacts characteristics is also compared to a model built using all of the artifact characteristics.
3
FAULTBENCH
Several open questions in software engineering involve evaluating processes and techniques that potentially improve aspects of the software development lifecycle. Empirical analysis of research theories are a component for acceptance of the theory within a research community [43]. Benchmarks provide an experimental basis for evaluating software engineering theories, represented by software engineering techniques, in an objective and repeatable manner [43]. A benchmark is defined as “a procedure, problem, or test that can be used to compare systems or components to each other or to a standard” [23]. Benchmarks represent the research problems of interest and solutions of importance in a research area through definition of the motivating comparison, task sample, and evaluation measures [42]. The task sample can contain programs, tests, and other artifacts dependent on the benchmark’s motivating comparison. A benchmark controls the task sample reducing result variability, increasing repeatability, and providing a basis for comparison [42]. Additionally, successful benchmarks promote collaboration within a research community [42].
detection problem: how to identify which alerts generated by static analysis tools are program anomalies.
FAULTBENCH provides a basis for comparison of AAITs and contributes subject programs; an analysis procedure; and evaluation metrics. The current version of
FAULTBENCH, v0.3, contains three, open-source subject programs written in Java. We describe how we created FAULTBENCH, and present the process of evaluating and comparing FP mitigation techniques.
3.1 Related Work
There are several benchmarks in the realm of software anomaly detection. The SIEMENS [22] benchmark was created by researchers at Siemens Corporate Research and contains multiple versions of small C programs each containing a single anomaly and a suite of test cases. The benchmarks were created to evaluate control- and data-flow test adequacy criteria and were later used by Rothermel et al. [40] to evaluate regression test case prioritization.
BUGBENCH [32] is a benchmark containing seventeen buggy, open source, C/C++ applications ranging from seven thousand lines of code (KLOC) to 1028 KLOC in various domains. A Java benchmark for evaluation of the CHORD race condition detection static
analysis tool [35] contains twelve concurrent programs ranging from 2.5 KLOC to 650 KLOC. PROMISE [5] is a repository for data sets from empirical research in predictive
modeling, and half of the 60 data sets are for anomaly prediction. However, most of the
PROMISE data sets provide metrics without the project source, and some data sets refer to
analysis researchers [26, 27, 30, 48] have used large open source projects (e.g. Apache’s httpd11, Wine12, Sun’s JDK 1.6.013, Columba14) or commercial programs to evaluate AAITs. While large open-source programs provide confidence and scale, the size of the sample evaluated (one to three programs) is a threat to external validity (e.g. the generalization of the results). Additional studies and subjects increase the generalization of experimental results [40]. Commercial examples show scalability of the technique in an industrial setting at the cost of repeatability and comparison.
These current benchmarks were insufficient for evaluating AAITs for several reasons. First, current benchmarks were lacking a detailed, repeatable process for use and evaluation of AAITs. Additionally, the current benchmarks were mostly for the C/C++ programming languages. Finally, alert classification and prioritization research, especially adaptive AAITs, requires the removal of anomalies by a researcher unfamiliar with the program, which is costly for large projects with a large number of alerts. Therefore, we want to create a benchmark of relatively small, real, and anomalous Java programs from a variety of domains.
11 http://httpd.apache.org/ 12 http://www.winehq.org/ 13 http://java.sun.com/javase/ 14
3.2
FAULTBENCHProcess
The goal of FAULTBENCH is to create a (1) suite of subject programs and alert oracles and (2) repeatable procedures for evaluation of actionable alert identification techniques. The
FAULTBENCH process consists of two steps: 1) data collection for each subject and 2) evaluation of AAITs. There are four steps of data collection required to gather all of the defined artifact characteristics: 1) generate the subject revision history; 2) the subject build process; 3) alert classification; and 4) artifact characteristic generation. The evaluation metrics (Section 3.3.3) are used in model evaluation (Section 3.2.5). The FAULTBENCH V0.3
process is automated via batch scripts and Java programs. These programs are available at http://agile.csc.ncsu.edu/faultbench.
3.2.1 Generate Subject Revision History
Large software projects typically record software changes in a source code repository, like CVS15 or SVN16. Mining a subject’s history through a source code repository or previous releases provides data for predicting actionable and unactionable alerts [19, 26, 27, 41, 48]. The data of interest are the sets of changes made to the source code and the reasons for those changes. A group of source code files that changed together is called a revision, and each revision in the history of the project should be evaluated to understand how alerts have changed over time. For projects with a large revision history, using a subset of revisions can reduce the analysis time.
15 CVS stands for concurrent versions system: http://www.nongnu.org/cvs/. 16
3.2.2. Subject Build Process
For each revision in the full or subset revision history, we checked out and built the subject program. Building a subject program may require additional projects and libraries. If the subject program does not build, we move on to the next revision. Subjects that do not build provide inconsistent static analysis data. After building the project(s), we gather size and complexity metrics and static analysis alerts using tools appropriate to the programming language and environment.
3.2.3. Alert Oracle Creation
An alert’s actual classification from the alert history provides an oracle for AAIT. The alert history is the set of all alerts reported by ASA over the entire history of the project. The alert history for a project is built by comparing alerts between two subsequent revisions [19]. An alert is identified by the project name, package name, file name, method signature, alert type, and one of either an ASA generated unique identifier or the line number of the alert. An alert is closed and a new alert is opened if both the unique identifier and the line number change. If an alert does not have a unique identifier generated by the ASA tool, then the alert is tracked by the line number. If the line number changes, then the alert is closed and a new alert is opened. Alerts sharing the same identifying details within the same revision are considered as the same alert within the revision.
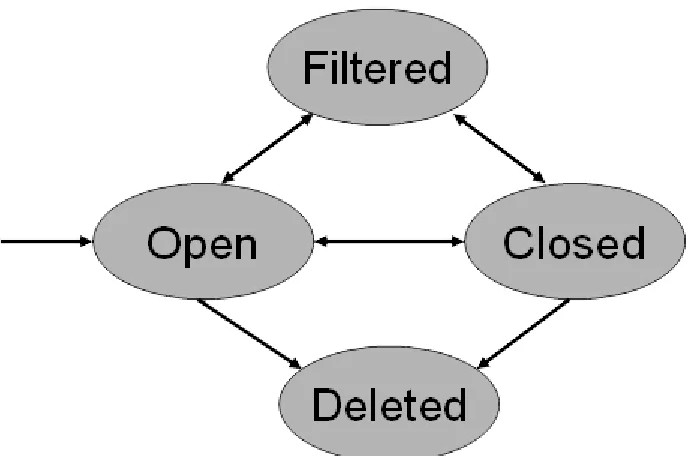
closure occurs when the alert was in a prior revision, but is not reported in a later revision [18, 19]. An alert is reopened if the alert was closed in a prior revision and is reported in a later revision. An alert is suppressed by identifying the alert in a filter file or through a code annotation. An alert is in the deleted state when the alert was in a file that was deleted. We do not want to consider alerts in deleted files because the alert closures are not associated with fixing the alerts.
Figure 3.1. An alert’s lifecycle. An alert is in the open state when first created. The alert is closed when the alert is no longer reported by ASA. If the alert is later reported by ASA, then the alert is reopened. An alert associated with a filter file or a suppression annotation in the source code is filtered. An alert in a file deleted during a revision is in the deleted state.
developer inspect some or all of the open alerts and determine if the alert is actionable or unactionable. By inspecting all of the alerts there is a full oracle. The other option is to classify all of the open alerts as unactionable. The reasoning is that if developers have not fixed the anomaly associated with the alert during the history of the project, the alert may not be important.
3.2.4 Artifact Characteristic Generation
Artifact characteristics are information about the alerts and the surrounding source code that may be predictive of actionable and unactionable alerts [19]. Because we consider each distinct alert individually, the artifact characteristics are specific to that alert. However, similar alerts may have the same values for an artifact characteristic (e.g. alerts opened during the same revision will have the same alerts for revision value). The details about the artifact characteristics included in FAULTBENCH are presented in Chapter 5.
3.2.5 AAIT Evaluation Process
and evaluates the model on all of the alerts. For AAIT that incorporate randomness into the model building process, cross-fold validation or multiple runs of the AAIT can increase confidence in the generated AAIT.
3.3 Definition of
FAULTBENCHWe define FAULTBENCH in terms of the three components presented by Sim et al. [42]:
motivating comparison, task sample, and evaluation measures.
3.3.1 Motivating Comparison
The motivating comparison advocated by Sim et al. [42] describes why the results of comparing two tools or techniques are important for furthering the research surrounding the comparison. The motivating comparison of FAULTBENCH is to evaluate and compare AAITs.
Specifically, we can use FAULTBENCH to answer the following research questions:
• RQ1: How accurately does an AAIT predict actionable and unactionable alerts? • RQ2: What is the rate of anomaly detection for an AAIT?
• RQ3: How does an AAIT compare with other AAITs?
3.3.2 Task Sample
The task sample is a representative sample of tests that AAITs should solve [42]. For
of the FAULTBENCH V0.3 task sample for the three subject programs are available on the
FAULTBENCH website17.
The subject programs in the benchmark must meet the following criteria: open source; small (less than 20 KLOC), of various domains, written in Java; and compliable with Java 1.4.2 and Java 1.5. Information about the subject programs used in the comparative study are in Table 3.1. Every 25th revision including the first revision and the last revision were sampled to reduce the time required for the revision-by-revision analysis.
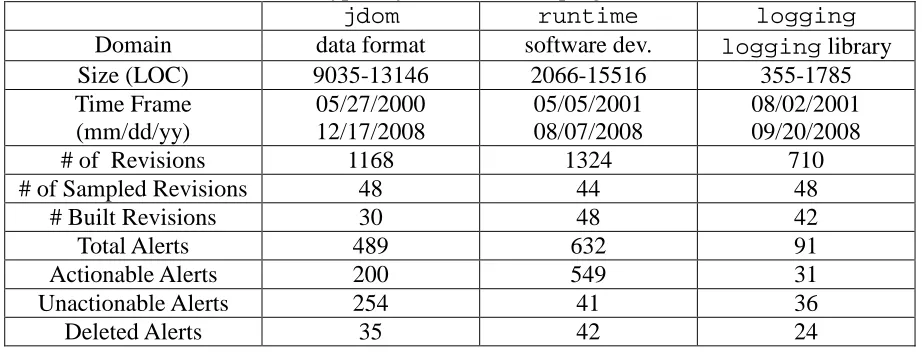
Table 3.1. FAULTBENCH V0.3 subject programs. The FAULTBENCH subject programs and the descriptive information. The size range for each subject program is provided across the revision history from the sampled revisions. The provided sizes do not correspond to the earliest and latest revisions, but typically, the size of the program increased over time.
jdom runtime logging
Domain data format software dev. logging library
Size (LOC) 9035-13146 2066-15516 355-1785
Time Frame (mm/dd/yy)
05/27/2000 12/17/2008
05/05/2001 08/07/2008
08/02/2001 09/20/2008
# of Revisions 1168 1324 710
# of Sampled Revisions 48 44 48
# Built Revisions 30 48 42
Total Alerts 489 632 91
Actionable Alerts 200 549 31
Unactionable Alerts 254 41 36
Deleted Alerts 35 42 24
17
First, the subject programs were compiled with Java 1.5 revision 17. If the programs built correctly, an open source metrics tool, JavaNCSS18, and FINDBUGS [21] were run on the
subject program. Next, the subject was recompiled with Java 1.4.2 revision 18 because
CHECK ‘N’ CRASH [12] requires that the subject programs are compiled using Java 1.4.2. CHECK ‘N’ CRASH was then run on the subject program.
JavaNCSS is an open source tool for generating source code metrics, specifically the KLOC count in non-commented source statements (NCSS), method and class counts, and cyclomatic complexity. FINDBUGS [21] is an open source ASA tool that generates alerts that match bug patterns. CHECK ‘N’ CRASH [12] generates JUnit test cases from the alerts
generated by the ASA tool ESC/JAVA [14] and reports those test cases that fail to the developer. A later implementation of CHECK ‘N’ CRASH, DSD-CRASHER, which considers an invariant generation step before running ASA was not considered for the comparative evaluation. The metrics and FINDBUGS alerts were recorded in .xml files. The alerts generated by ESC/JAVA and the failing test cases for CHECK ‘N’ CRASH were recorded in text
files. These files are parsed, the data are stored in a local database, and an alert history is created for each ASA. Generation of artifact characteristics for each alert finishes the
FAULTBENCH data collection step. AAIT may be applied to the alert data and evaluation
follows using the evaluation metrics listed in Section 3.3.3. The remainder of this section describes specific information about each of the FAULTBENCH subjects.
18
3.3.2.1 jdom
The subject program jdom19 is an open source library for XML. The jdom code is kept in a CVS source code repository. The jdom project consists of three sub-projects, all of which were considered for the comparative evaluation: jdom, jdom-contrib, and jdom-test. For the remainder of this dissertation, the three projects will be referred to collectively as, jdom. All projects are built using ant20.
3.3.2.2 runtime
The subject program runtime is a core plug-in of the Eclipse21 integrated development environment. Runtime has a CVS repository and up to 12 other plug-ins are required to build runtime. Only alerts generated for the runtime plug-in were considered in the analysis. The build step consists of a headless Eclipse build. CHECK ‘N’ CRASH was not run on runtime due to inconsistent library usage throughout the revision history.
3.3.2.3 logging
The subject program logging is a Java logging library that is part of the Apache commons22. The logging program is maintained in a SVN source code repository. All
19
jdom may be found at: http://www.jdom.org/.
20 Ant is a build library for Java programs: http://ant.apache.org/.
libraries required to build the logging program were obtained through Maven23 for each build and the project was built using ant.
3.3.3 Evaluation Measures
FAULTBENCH evaluates AAITs. The key metrics associated with alert classification are below:
• True positive classification (TP): classifying an alert as actionable when the alert is
actionable.
• True negative classification (TN): classifying an alert as unactionable when the alert is
unactionable.
• False positive classification (FP): classifying an alert as actionable when the alert is
actually unactionable.
• False negative classification (FN): classifying an alert as unactionable when the alert is
actually actionable.
We are focusing on the classification of alerts identified by the static analysis tool; therefore, we are not considering software anomalies not found by static analysis tools. Figure 3.2 is a classification table.
23
Anomalies are observed Actionable Unactionable
Actionable True positive (TP) False positive (FP) M o d el p re d ic ts a le rt s Unactionable False negative (FN) True negative (TN)
Figure 3.2. Classification table (adapted from Zimmerman et al. [52]). The rows contain the predicted classification and the columns contain the observed classification. The cells shaded in grey are the TP and TN classifications that we want to obtain.
The following metrics [27, 48, 49, 52] are used to evaluate the classification of static analysis alerts:
• Precision [49]: the proportion of correctly classified anomalies (TP) out of all alerts
predicted as anomalies (TP + FP). The precision calculation is presented in Equation 1.
FP
TP
TP
precision
+
=
(1)• Recall (also called True Positive Rate or Sensitivity) [49]: the proportion of correctly
classified anomalies (TP) out of all possible anomalies (TP + FN). The recall calculation is presented in Equation 2.
FN
TP
TP
recall
+
=
(2)• Accuracy [49]: the proportion of correct classifications (TP + TN) out of all
evaluation is used. The test set of alerts is considered to have a Bernoulli distribution [49].
FN FP TN TP
TN TP accuracy
+ + +
+
= (3)
Alert prioritization AAITs can be evaluated using classification metrics, discussed above, if a threshold is specified that divides the alerts into actionable and unactionable sets. The following performance measures are used to evaluate AAITs in FAULTBENCH.
• Area Under the Curve (AUC): a measure of the area under the graph of the number or
![Figure 3.2. Classification table (adapted from Zimmerman et al. [52]). The rows contain the predicted classification and the columns contain the observed classification](https://thumb-us.123doks.com/thumbv2/123dok_us/1743767.1223226/55.612.154.480.72.186/figure-classification-adapted-zimmerman-predicted-classification-observed-classification.webp)