J.N.Sharma1, Raj Shailesh Kanakiya2, Dr.S.K.Singh3
Superintendent Engineer, J&K pollution Control Board, J&K, India
Research Scholar, Department of Environmental Engineering, Delhi Technological University, Delhi, India
Professor & Head, Department of Environmental Engineering, Delhi Technological University, Delhi, India
ABSTRACT: Water quality is a general term that refers to a general description about the properties of a water body.
Lakes that have a high water quality possess properties that make it a high valued resource to society and nature.Temporal analysis is done for and correlationanalysis iscarried out between physico-chemical characteristics for determining water of the Dal lake. The organic and inorganic pollutant load in the Dal have accelerated the macrophytic growth which in turn has reduced the water quality and biological oxygen demand (BOD) of the lake and hence have reduced the recreational and aesthetic appeal of the lake. The condition of Dal Lake has reached a critical stage from the ecological angles and if proper conservation measures are not taken in future, the lake will likely deteriorate further and willsoon turn into eutrophic condition.
KEYWORDS: Dal Lake, Physico chemical characteristics, Common Physical Indicator
I.INTRODUCTION
All life on this planet totally depends on the ‘Water’ which exist in nature in various forms such as Ocean, river, lakes, clouds, rain and snow etc. As far as Lakes are concerned, they are the most fertile, diverse, productive and interactive ecosystem in the world. The word “Lake” is used loosely to describe many types of water bodies – natural, manmade and ephemeral including wetlands(2).Lakes are traditionally under-valued resources to human society. They provide a multitude of uses and are prime regions for human settlement and habitation. Uses include drinking and municipal water supply; industrial and cooling water supply; power generation; navigation; commercial and recreational fisheries; body contact recreation, boating, and other aesthetic recreational uses(3)
Dal lake is a warm monomictic lake occur in temperate latitudes in subtropical mountains and in areas strongly influenced by oceanic climates. In the same way as their cold water counterparts,they mix only once during the year with temperatures that never fall below4°C.(4)
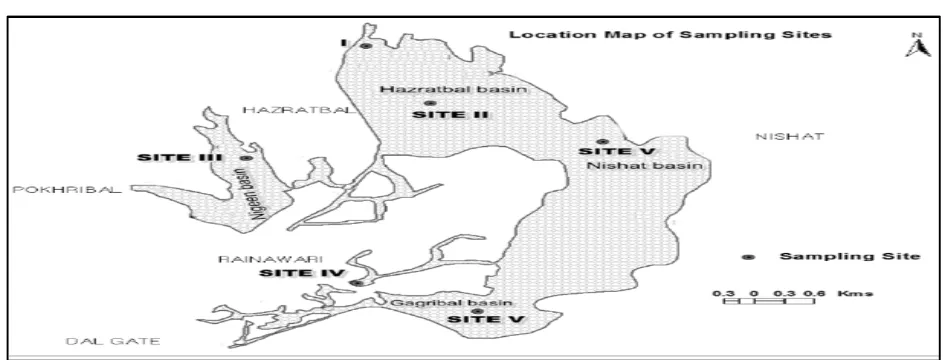
Fig. 1 :Sampling Sites in Dal Lake
The sampling of lakes for the purpose of assessing water quality is a complex process,as is the interpretation of the data obtained. Consequently, these activities must bebased on a relatively complete understanding of basic limnology. The strategies employed for sampling and data interpretation are also controlled by lake use, the issue or lake problem being addressed, and the availability of resources for undertaking an assessment programme(6).
It is important to analyse water to determine its suitability for drinking, domestic use industrial use, agricultural use etc. It is also important in water quality studies to know the amount of organic matter present in the system and the quantity of oxygen required for stabilization of the water. The impact of organic pollutants on water quality in this work is expressed in terms of the Biochemical Oxygen Demand (BOD) and Chemical Oxygen Demand (COD).Biological Oxygen Demand BOD ,Calcium, Magnesium, Iron ,Chloride, Ammonical Nitrogenand Total Dissolved Solids (TDS). The Dal lake can be subdivided into four parts as per its basins .The Water Quality Index is calculated for four sites Char Chinar,NageenCentral,HazratbalSTP,i.e, are 102.66,120.33,109.35,101.3 respectively. Which is high with respect to the limits and hence is unfit for consumption.(2)
An ecological study of the Dal lake wasconducted during 2005 – 2007 so as to gain insight into the flaws of the conservation endeavors. It wasrevealed that ecologically unsound management practices are the major cause for the plight of the lake. Inresponse to the inshore dredging, skimming of free floating macrophytes and unplanned mechanicaldeweeding undertaken during the past several years, some previously sparsely distributed aquatic plants inthe lake have reached nuisance levels, while hitherto unknown invasive Azollapinnatahas got widelydistributed throughout the water body. A thorough study encompassing all environmental aspects, includingsocioeconomics, needs to be undertaken so as to frame an ecologically well balanced conservation strategyfor this important aquatic ecosystem of the region(6).
Table.No 1- Colourused as Indicator Assessing Water Quality
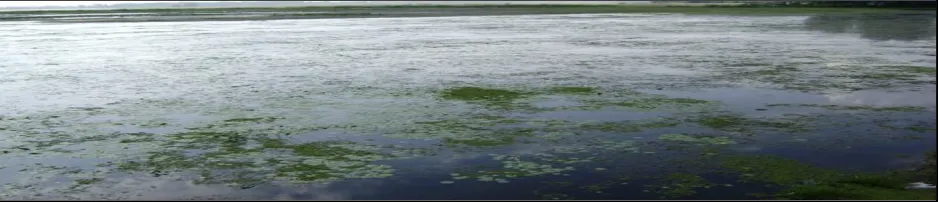
The Colour of Dal lake is more inclined towards Blue-Green which indicates a plankton bloom (Key indicator of a plankton bloom, elevated DO and pH) .This Water colour is due to dominant plankton type present.
Table No.2 Odour used as Indicator Assessing Water Quality
The Odour of Dal Lake is dominated by Hydrogen Sulphide indicating the presence of Raw Sewage,Nageen area of Dal Lake had a more of Musty odour implying presence of raw or partially treated sewage, livestock waste or algae.
Table No.3 Surface Scumused as Indicator Assessing Water Quality
Nearby the House-boat area ,Foam was been found to be White in colour indicating presence of soap and Rainbow film was found near Hazratbal basin.
II.METHODOLOGY
Data of water quality of Dal lake for 4 sites were collected fromDal Lake development authority .It comprises of 3 years data in year 2010, 2011, 2012.The method used by them are for analysis pH (Digital pH meter DPH 504), Electrical conductivity (EC) (Digital EC meter DEM900). Total dissolved solid (TDS) was determined by oven dry method. Biological Oxygen Demand (BOD) was estimated by Azide modification of Winkler method. Total Alkalinity (TA) as HCO3-, Calcium (Ca2+), Magnesium (Mg2+) total hardness (TH), Chloride (Cl), was estimated by standard titrimetry. Sulphate (SO42-) by turbidometry, Nitrate (NO32-) by Brucine method all using HITACHI UV-VIS spectrophotometer.
III.RESULTS & DISCUSSION
Various parameters of water quality of Dal lake at four locations Hazaratbal are given in table1 (a) Nishat Garden are given in table 1(b) ,Grand Palace are given in table1(c) ,Nishat Garden are given in table 1 (d) respectively. Various characteristics are as below
Table 4 (a): Water Quality of Dal Lake at Hazratbal
Year pH EC T.D.S COD BOD Phosphate NH3-N Iron S Hardness Ca Mg Alk Cl K
2010 7.5 298 165 24.9 2 0.057 0.604 0.421 35.7 180 40 19.4 26 16 2
2011 7.9 311 184 24.58 7 0.232 0.124 0.17 77.2 366 76.15 42.7 42 20 5
2012 8.2 254 115 72.7 4 0.75 0.66 0.471 25.7 220 64.9 17.1 158 17 3
Table 4 (c) Water Quality of Dal Lake at Grand Palace
Year pH EC T.D.S COD BOD Phosphate NH3-N Iron S Hardness Ca Mg Alk Cl K
2010 7.2 155 85 24.9 2 0.064 0.252 0.87 12.5 120 24 14.5 55 12 2
2011 7.9 138 92 40 2 0.14 0.13 0.15 13.65 76 18.4 7.2 72 17 2
2012 8.1 230 110 35.4 3 0.3 0.62 0.51 18.5 176 42.5 19.9 94 26 3
Table 4 (d) Water Quality of Dal Lake at Nehru Park
Year pH EC T.D.S COD BOD Phosphate NH3-N Iron S Hardness Ca Mg Alk Cl K
2010 7.2 299 128 16.6 1 0.175 0.46 0.43 9.8 124 30.46 11.6 60 12 1.2
2011 8 128 85 40 2 0.13 0.51 0.09 11.7 82 22.4 6.3 76 16 2
2012 8 286 110 48.8 4 0.75 0.64 0.52 19.5 176 40.9 20.9 98 17 3
Table 5 : Statistical Analysis of Water Quality Characteristics of Dal lake
pH EC T.D.S COD BOD P NH3-N Iron S H Ca Mg Alk Cl K
Max 8.6 701.0 456.0 72.7 7.0 1.0 6.0 0.9 96.3 366.0 108.2 42.8 181.0 26 6.0
Min 7.2 128.0 85.0 16.6 1.0 0.1 0.1 0.1 9.8 76.0 18.4 6.3 26.0 12.0 1.0
Avg 7.9 261.5 148.7 36.0 2.9 0.3 0.9 0.4 28.5 170.8 43.8 18.3 82.5 17.5 2.7
Physico-chemical Characteristics of Dal lake
1. pH
pH is an important parameter which determines the suitability of water for various purposes. Range of pH is range of 7.2 to 8.6 and the average being 7.886,which is within drinking water limits as per (7).
2. Conductivity
Low Conductivity (0 to 200 μmho/cm) is an indicator of pristine or background conditions. Midrange conductivity (200 to 1000 μmho/cm) is the normal background for most major freshwater lakes. Conductivity outside this range could indicate that the water is not suitable for certain species of fish orbugs. High conductivity (1000 to 10,000 μmho/cm) is an indicator of saline conditions. Waters that have been heavily impacted by industry can fall into this range Average being in the second range for the Dal lake.(8)
3. TDS
TDS values in lakes and streams are typically found to be in the range of 50 to 250 mg/L. In areas of especially hard water or high salinity, TDS values may be as high as 500 mg/L. Drinking water will tend to be 25 to 500 mg/L TDS. BIS Water Standards include a recommendation that TDS in drinking water should not exceed 500 mg/L TDS(9). Maximum TDS of the study period is 456mg/l so it is well below the BIS limits.
4. Ammonical Nitrogen
5. BOD
Average BOD for Dal lake is 2.916 mg/l which is below the established standard limit .If BOD exceeds 3 mg/l , it affects coagulation and rapid sand filtration processes ,conventional plants require expensive advance water treatments.
6. COD
COD is an indicator of inorganic pollution average is 36mg/l whish is greater than the standard BIS limit. Possible cause of this high valueof could be the illegal untreated discharge of sewage into Dal lake.
7. Hardness
Hardness in Dal Lake is higher than permissible Hardness concentration of freshwater bodies of Kashmir Valley has been associated with thick population of plankton, especially Cyanophyceae(12).
8. Total Alkalinity
According to BIS(13) the maximum permissible limit is 120 mg/L. The observed average value of total alkalinity was in greater in range of 26- 160mg/l. Total alkalinity values in the study indicates that the water was very hard. Higher values of alkalinity registered during summer might be due to the presence of excess of free CO2 product as a result of decomposition process coupled with the mixing of sewage and domestic waste.
9. Calcium and Magnesium
The observed average value of calcium was in range of 18 to 108 mg/l, which when standard permissible limit of 75 mg/l prescribed by BIS is above at certain region and below at certain with average being 43.66 mg/l . The quantities of calcium in natural water due to prevalence of lime rocks in the catchment.The observed average value of magnesium was in range of 6 to 42 mg/l.
10. Chloride
Chloride, a component of salt, is one of the common anions found in freshwater and thus chloride levels are directly related to conductivity. Chloride levels in Dal lake have ranged from 12.0 mg/l to 26 mg/l with an average of 17.5 mg/l.
11. Potassium
Reason for Excesspotassium in the lake can be either from soap used as softener or fertilizer The average potassium is 2.7 mg/l which is well below the limits as per WHO guidelines(19)
IV.CONCLUSION
The limnological study is very useful to get fairly accurate idea of quality of the ground water by determining a few parameters experimentally.The control of lake water quality is based on sound management practice in relation to the required water uses and a reasonable, preferably detailed, knowledge of the limnological characteristics and processes of the water body of interest.An effective monitoring mechanism for monitoring the Dal lake conservation Programme which should comprise of eminent Limnologists, researchers, experts who have been associated closely with Dal lake studies during the Lake execution Programme to some international agency/organization well – known for Lake Conservation and management practices
REFERENCES
1.Krantz, D.&Kifferstein, B. (2010) Water Pollution and Society. Retrieved February 26, 2010, from University of Michigan website:
http://www.umich.edu/~gs265/society/waterpollution.htm.
2.Raj Shailesh Kanakiya,S.K.Singh,J.N.Sharma(2014)Determining the Water Quality Index of an Urban Water Body Dal Lake, Kashmir, India -IOSR Journal of Environmental Science, Toxicology and Food Technology (-IOSR-JESTFT)Volume 8, Issue 12 Ver. III (Dec. 2014), pp 64-71 3..Deborah Chapman Water Quality Assessments - A Guide to Use of Biota, Sediments and Water in Environmental Monitoring - Second Edition © 1992, 1996 UNESCO/WHO/UNEP
4.Wetzel, R.G. 1975 Limnology. Saunders, Philadelphia, pp 743 .
5..Ishaq M and Kaul V (1988) Distribution of minerals in Himalayan lake. Trop. Ecol. 29, pp 41–49.
14.Patil, V. T., and Patil, P. R. (2011) “Groundwater quality of open wels and tube wels around Amalner town of Jalgaon, district, Maharashtra, India”, Electronic Journal of Chemistry, 8(1), pp 5378.
17.Axel Lehmann and Michael Rode(2001)Long-Term Behaviour And Cross-CorrelationWater Quality Analysis Of The River Elbe, Germany Wat. Res. Vol. 35, No. 9, Elsevier Science Ltd pp. 2153–2160
18.F.Jorgensen, S.E. and Vollenweider, R.A.(1989) Guidelines of Lake Management. Volume 1 Principles of Lake Management.International Lake Environment Committee Foundation, Otsu, Japan and United Nations Environment Programme, Nairobi, 199 pp.
19.WHO/HSE/WSH/09.01/7 Potassium in drinking-water Background document for development of WHO Guidelines for Drinking-water Quality 9. http://www.ostrowskiness.com/sections/downloads/envirolabs/Test_12_TDS.html
11.http://www.emecs.or.jp/01cd-rom/section_3_e/sec3_a_ro_b_6_e.html