Letter to
the
Editor
Differentiating Between Selection
and
Mutation Bias
Adam
EyreWaker
Centre for the Study of Evolution and Department of Biological Sciences, University of Sussex, Brighton BNl 9QG, United Kingdom
Manuscript received December 21, 1996 Accepted for publication July 21, 1997
I
T is often difficult to differentiate the effects of selec- tion from mutation biases. For instance it is unclear whether the G+C rich parts of the mammalian genome, the so called G+C rich isochores, are maintained by mutation biases or selection (BERNARDI 1989; FILIPSKI 1990 ).
BALLARD and KREITMAN ( 1994) and AKASHI( 1995) have recently suggested a variation of the Mac- Donald-Kreitman ( MACDONALD and K R E I T M 1991 )
test, which itself a variation of the HKA test (HUDSON
et aZ. 1987), which can be used to test whether mutation biases are solely responsible for compositional biases in a sequence. The test involves comparing the pattern of substitution to the pattern of polymorphism. The bases at each site are first divided into two groups; these groups could be the G / C and A/T nucleotides, com- mon and rare synonymous codons, or any other division of the four nucleotides at each site. Let us call the two groups of nucleotides preferred and unpreferred, for reasons that will become apparent. To conduct the test one tabulates the number of unpreferred to preferred, and preferred to unpreferred substitutions ( sp and s,, respectively), and the number of preferred mutations segregating at sites that were unpreferred ancestrally, and the number of unpreferred mutations segregating at sites which were ancestrally preferred ( mp and mu
respectively) ; i.e., mp is the number of preferred muta- tions segregating in the population and sp is the number of preferred mutations that have been fixed. Under neutrality -HI ( 1995), and BALLARD and KREITMAN
( 1994) suggest that the ratios sp/ s, and mp/ mu should be equal, a hypothesis that can be easily tested. This is clearly true if the system is stationary ( i.e., there is no overall change in the relative frequency of the two groups) ; when the system is stationary, the number of substitutions between the two groups must be equal
(whether the sequence is under selection or not) , and under neutrality the pattern of mutation must reflect the pattern of substitution; i.e., both ratios are expected to be one. However the ratios are not expected to be equal if the system is not (or has not been) stationary, because as the base composition changes through time
Author email: [email protected]
Genetics 147: 1989-1987 (December, 1997)
so the pattern of mutation changes. Furthermore, un- der neutrality the mutation pattern must have changed if the sequences are not stationary; if the change oc- curred after the time from which we are observing sub- stitutions, then the pattern of sqbstitution reflects two different mutation processes. N r example imagine a segment of DNA that has recently gone through an increase in G+C content because of a change in the mutation pattern, but which is now stationary. There will be an excess of A T 4 G C substitutions but equal numbers of G C and A T mutations segregating in the population. Although AKASHI ( 1995 ) appreciated that there are problems if sequences are changing in compo- sition, the problems were not explicitly stated. Here I illustrate the problem with a simple example and sug- gest approaches to identlfy and deal with datasets that are not stationary.
There are three possible outcomes of the test: the proportion of substitutions that are preferred can be equal to, greater than, or less than the proportion of mutations that are preferred. Let us define the pre- ferred group to be the most frequent in the sequence that we are considering; these are the nucleotides pre- ferred by either mutation or selection. For example, in a G+Grich sequence the preferred group is the G and
C nucleotides. In this case -HI ( 1995) has shown that under weak directional selection the proportion of substitutions that are preferred should be greater than the proportion of mutations that are preferred ( i.e., sp/
s,
>
mp/m,) (when the system is stationary). This is likely to be true for other models of selection, such as stabilizing selection. I will also note here that gene conversion is indistinguishable from weak directional selection in these terms. In the following it is shown thatsp/ s,, is often greater than mp/ mu when the mutation pattern changes and that selection can be incorrectly inferred from the test.
the preferred nucleotides, f, can be modeled by the differential equation:
-
d T d f = -fi+ ( 1 - f ) v
from which it follows that the frequency of the pre- ferred nucleotides is
f(t) = w
+
(fo-
w ) e - ' ,( 2 )
time units after the population was at a frequency fo,
w h e r e w = v / ( u + v ) a n d t = ( u + v ) T . T h e n u m b e r s
of preferred and unpreferred mutations segregating are therefore
m
m p ( t ) =
CCl
- f < t - i))& i=Om
% ( t ) =
E m -
i)uki ( 3 )i=O
where
k,
is the probability that a mutation that occurredi generations ago is still segregating in the population. In practical terms one will only have a sample of se- quences; in this case
k
is the probability that one sam- ples a mutation that occurred i generations in the past. For simplicity we will assume that the time between substitutions is long compared to the time mutations exist in a population; this is reasonable since N ( u+
v )appears to be less than one for most organisms that have been studied except for RNA viruses [ ie., the time for which each mutation segregates, generally less than Ngenerations, is much less than the time between the fixation of different mutations, 1
/
( u+
v ) genera- tions]. Under this assumption the composition does not change during the period in which mutations accu- mulate so we can simplify Equations 3 towhere
m
K =
ck,.
i=O
The proportion of segregating mutations which are pre- ferred is then
where w is the strength of the mutation bias,
fo
is the initial frequency of preferred nucleotides, and t is the time in units of ( u+
v ).
Let us also assume that h a t i o n is instantaneous; again this is likely to be a good approx- imation when N ( u+
v ) Q 1 since the time to fixation is of the order of 4Ngenerations. The numbers of pre- ferred and unpreferred substitutions aref
1
0.50
0.0 0.2 0.4 0.6 0.8 1 .o
0.50 r
0.40 .
0.10 1
0.0 0.2 0.4 0.6 0.8 1.0 Divergence
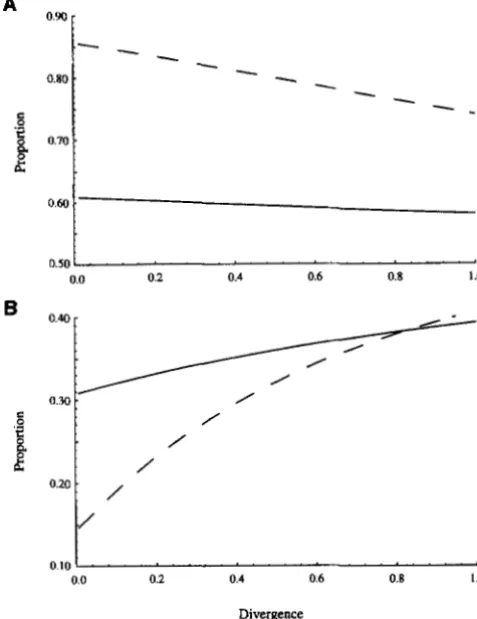
FIGURE 1.-The proportion of substitutions (
-
) and the proportion of segregating mutations (- - -
) that are preferred nucleotides plotted against the overall proportion of sites that have changed. In part a the mutation bias haschanged such that the preferred group is increasing (fo =
0.6, w = 0.9), whereas in part b the preferred group nucleo- tides are decreasing in frequency (fo = 0.9, w = 0.6).
which simplify to
~ p ( t ) = w { ( l
-
w ) t - ( f o - w ) ( 1 - e - ' ) ) )s u ( t ) = ( 1
-
w ) ( w t + (fo-
w ) ( l-
e-')],( 7 )
expressions in w ,
fo
and t .The proportion of substitutions that are preferred,
sp/ ( sp
+
su),
and the proportion of mutations segregat- ing in the population that are preferred,mp/
( m p+
Letter to the Editor
ferred nucleotides is declining. In this case sp/ s, is less than mp/ mu; there is no simple selective explanation, although the result would not be consistent with naive neutral expectations. In both cases sp/ su f m p / mu be-
cause the mutation pattern is changing as the composi- tion of the sequence changes. The mutation pattern reflects the current mutation pattern while the substitu- tion pattern reflects a changing process.
In both of these examples the change in the mutation pattern was assumed to have occurred at the point from which we are considering the pattern of substitution (the dynamics are similar if the change occurred before this point). This may not be the case, the pattern of mutation may have changed at some point more re- cently. Let us assume that the system was stationary prior to some time, a t , at which point the mutation bias changed instantly to a new value, w. Let the fre- quency of the preferred nucleotides prior to the change be f o . If t time units have occurred since the change in the bias then
s p * ( t ) = f o ( l - & ) a t + s p ( t )
s z ( t ) - & ) a t + su(Q ( 8 )
mp and m, remain unchanged. The quantities
SF/(
SF
+
s z ) and mp/ ( mp+
mu) are plotted in Figure 2 for the case where the change in the mutation bias occurs two thirds of the way along the branch leading to the sequence being considered ( i.e., a = 2 ).
The dynamics are more complicated than when the change in the mutation bias occurred at or prior to the ancestral node. When the mutation bias changes along a branch such that the frequency of the preferred nucleotides increases, the proportion of substitutions that are pre- ferred is less than the proportion o f mutations that are preferred initially ( i.e., s$ / s z<
mp/ mu) (Figure 2a) ;although it may take some considerable time, eventually this inequality is reversed ( ;.e.,
SF
/sz>
mp/ mu). In contrast if the mutation bias changes such that the fre- quency of the preferred nucleotides starts to decline, the proportion of substitutions that are preferred is less greater than the proportion of segregating mutations that are preferred initially ( i.e., sf / s z>
mp/ mu) (Fig- ure 2b). In this case s$ / s z and mp/ mu are different because the substitution pattern reflects two mutation patterns; a stationary pattern and a new nonstationary pattern.The pattern shown in Figure 2b is the situation most likely to lead to incorrect inferences about selection. In the other examples, the differences between sp/ s, ( o r
sp* /sz ) and mp/mu are relatively small and in the exam- ples shown in Figures l b and 2b the difference between the ratios is in a direction not expected under weak directional or stabilizing selection models unless there are strong mutation biases in operation as well. In con- trast the differences between the ratios in Figure 2b is in the correct direction to be consistent with directional
0.90 [
-
0.80
.
0.70
“
o - i _ . 0.50 0.0 0.2 0.4 0.6 0.8 1 .o
0.40 -
0.30
.
/
/ /
0.20 . / ./
0.10
0.0 0.2 0.4 0.6 0.8 I .o
Divergence
FIGURE Z.-The proportion of substitutions (-) and
the proportion of segregating mutations (
- -
- ) that are preferred nucleotides plotted against the overall proportionof sites that have changed, for the case where the mutation bias changes two thirds of the way along the lineage. In part a the mutation bias has changed such that the preferred
group is increasing (fo = 0.6, w = 0.9) , whereas in part b the
preferred group nucleotides are decreasing in frequency (fo
= 0.9, w = 0.6).
and stabilizing selection and can be made as extreme as required the more recently the mutation bias has changed, the greater the difference between the sub- stitution pattern ( s $ / s z ) and the mutation pattern
In general one should therefore be cautious about applying the ABK test unless the system appears to be stationary. It is important to appreciate that since the test is designed to differentiate between selection and mutation, a change in the mutation bias is an equally parsimonious explanation of why the sequences are not stationary as a change in the strength or direction of selection.
There are three solutions to the “stationary” prob- lem; the first is to test whether the system is stationary; the second is to use an alternative test based on the frequency distribution of segregating mutations, and the third is to determine what change in the mutation pattern would be required to explain the data. Whether the sequences are stationary can be tested using the substitution data. Ideally we would like to be able to test
whether the number of preferred substitutions along a lineage is equal to the number of unpreferred substitu- tions since sp = s, when the sequences are stationary. Unfortunately this is not straightfonvard since the re- construction of ancestral states using parsimony is prob- lematic in sequences of biased composition (COLLINS
et al. 1994; PEKNA and KOCHER 1995
1.
Problems arise because the rate of preferred to unpreferred substitu- tions (per site) is lower than the rate of unpreferred to preferred substitutions when a sequence is stationary; this means that sites that were ancestrally unpreferred change to sites that are preferred in two of three taxa much more rapidly than the reverse process; i.e., the rate of UUU + PUP is greater than PPP + UPU. Analternative test is to use a single outgroup and compare the number of sites that are fixed for a preferred nucle- otide in the ingroup and an unpreferred nucleotide in outgroup ( dpu) and vice versa ( d u p ) . If the sequences are stationary these are expected to be equal even if one of the lineages evolves faster than the other and there are multiple substitutions (EYRE-WALKER
1994).
The ABK test is therefore best split into two compo- nents: a test of whether the system is stationaly using the substitution data (i.e., dui, = &), and a test for selection using the polymorphism data (Le., mp = mu).
This will a more powerful test if the system is stationary since there is only one source of sampling error in the test of selection; however the test of whether the sequences are stationary may not be very powerful so caution should always be exercised when interpreting the results.
An alternative is to test the frequency distributions of preferred and unpreferred mutations against one another (SAWYER et al. 1987; k & H I and SCHAEFFER
1997; R. UIMAN, personal communication). Under
neutrality, if the sequences are stationary, then the fre- quency distributions of preferred and unpreferred mu- tations should be the same. Furthermore this will be true if the sequences are not stationary so long as the mutation pattern has not changed within the last -4N
generations. In contrast the ABK test is sensitive to changes in the mutation pattern within
-
1 / ( u+
v )generations, Since 4 N ( u
+
v ) Q 1 in most organisms,the ABK test is more sensitive to changes in the muta- tion pattern than the frequency distribution test.
Whether or not there is evidence that the sequences are stationary, it may be useful to estimate the change in the mutation pattern required to explain the data; if the change is extreme one may doubt a mutational explanation, especially if a simple selection model is consistent with the data. The change in the mutation pattern can be estimated in the following way; the origi- nal mutation bias is estimated from the present fre- quency of preferred nucleotides: i.e., w* = f. This is a conservative estimate. The new mutation bias is then
-3.0
..
..
..
.
.*
..
, .0.6 0.7 0.8 0.9 1 .o
W
FIGURE 3.-Likelihood surface for the new mutation bias,
w , for the Drosophila cytochrome b data of BALLARD and
KREITMAN ( 1994). 100,000 sets of parameter values ( y i ) were
generated and the likelihood was summed over intervals of
0.005.
estimated from the level of bias and the pattern of poly- morphism by rearranging Equation 5:
fi
1 - 2 - f + 2 f i ’
W =
An unbiased estimate of w and its confidence intervals can be obtained by bootstrapping, unless there are no preferred mutations segregating ( i e . , z = 0 ) , or by maximum likelihood. There are four types of site in the analysis, preferred and unpreferred sites without (unpreferred and preferred respectively) mutations segregating, and preferred sites with unpreferred muta- tions segregating, and unpreferred sites with preferred mutations segregating. These are multinomially distrib- uted. Let the observed numbers of the four types of site be x,, Q
- -
etc.; e.g., = mu. The likelihood of observing xi given that the true proportions of the four types of site are y j isThus by randomly generating yi between 0 and 1 such that
zyi
= 1, and substituting the values yi into Equation9, it is possible to construct the likelihood surface for
w . In practice I have found that generating values of yi
within four standard errors of their observed values gives a good approximation to the likelihood surface.
95% confidence intervals can then be inferred from a decline in the log likelihood of two units.
BALLARD and KREITMAN (1994) and AKASHI (1995)
mutation can be determined from the frequencies of the segregating alleles; sites at which the preferred al-
lele is in a minority are inferred to be a preferred muta- tion segregating at an unpreferred site, and vice versa. This will be unbiased under the null hypothesis if the change in mutation pattern occurred more than -4N
generations ago since the frequency distributions of preferred and unpreferred mutations are expected to be the same if the composition of the sequence is solely determined by mutation biases. If the change in the mutation pattern occurred within -4N generations of the present the estimate will be conservative.
To illustrate the principles laid out here, let us recon- sider whether synonymous codon bias has been main- tained by mutation in the mitochondrial cytochrome b gene of Drosophila. BALLARD and KREITMAN (1994)
presented sequence data from 17 lines of Drosophila mlanogaster, 18 lines of Drosophila simulans and 14 lines of Drosophila yakuba; for the purposes of this analysis I have followed BALLARD and KREITMAN and ignored the single s I D . simulans line since this appears to be quite distinct from other simulans lines. The cytochrome b gene is very AT rich at synonymous sites. Of the 15
G C A T synonymous site polymorphisms segregating in the three species, 11 have GC segregating at a fre- quency of
<
0.5, so we infer that 11 of the polymor- phisms arose via A T-
G C mutations, 4 by G:C-
A T mutations; the difference is nearly significant ( P<
0.10 in a one-tail binomial test).
There is no evidence that the sequences are changing in composition- there are 13 GCmel:ATsim to 21 ATmel :GCSim, 20 GCmel :ATyak to 21 ATmel : G G k , a n d 25 GCSim:AT$ to22 ATsim:G& fixed differences-so the results are consistent with selection acting in favor of AT. However if we calculate the change in the mutation pattern re- quired to explain the data, it turns out to be small. The average AT content at synonymous sites in the cyto- chrome b gene is 94%, so the original mutation bias prior to the change, w * , must have been at least 0.940
with 95% CIS of 0.916 to 0.964. The maximum likeli- hood estimate for the new mutation pattern is -0.88
(Figure 3 ) ; this is the G+C content that we would ex- pect when the sequences are stationary. The 95% CIS are -0.72 to -0.95. There is therefore little evidence of selection upon synonymous codon use in the Dm- sophila cytochrome b gene.
The ABK procedure tests whether a compositional bias is due to mutation alone; it is therefore likely to be useful in detecting selection that causes composi- tional bias and selection in sequences subject to a muta- tion bias. Since compositional biases are widespread, the test may have broad application; the compositional biases must be due to selection or mutation; in either case the ABK test may be able to detect the action of selection. Like the test of MACDONALD and K R E I T W
(1991) the ABK test makes few assumptions; because
preferred and unpreferred sites are interspersed along the sequence it does not assume that the sites are inde- pendent or that population sizes have been constant. Furthermore, departures from neutrality can be attrib- uted directly to selection acting upon the sites under consideration, rather than selection at linked loci.
I am very grateful to RICH KLIMAN, HIROSHI AKASHI, BRANDON GAUT, JOHN WAKEFIELD, JODY HEY, ANDY CLARK and two anonymous referees for helpful discussion and comments on this manuscript.
LITERATURE CITED
AKASHI, H., 1995 Inferring weak selection from patterns of polymor- phism and divergence at “silent” sites in Drosophila DNA. Ge-
netics 1 3 9 1067-1076.
AKASHI, A,, and S. W. SCHAEFFER, 1997 Natural selection and the frequency distributions of “silent” DNA polymorphism in Dro- sophila. Genetics 146: 295-307.
B W ,J. W. O., and M. KREITMAN, 1994 Unraveling selection in the mitochondrial genome of Drosophila. Genetics 138 757-
772.
BERNARDI, G., 1989 The isochore organization of the human ge- nome. Annu. Rev. Genet. 2 3 637-661.
tional bias, character state bias and character state reconstruction using parsimony. Syst. Biol. 4 3 482-496.
EYRE-WALKER, A., 1994 DNA mismatch repair and synonymous c e don evolution in mammals. Mol. Biol. Evol. 11: 88-98.
FILIPSKI, J., 1990 Evolution of DNA sequence. Contributions of mu- tational bias and selection to the origins of chromosomal com- partments, pp. 1-54 in Advances in M u t a p e s i s , Vol. 2, edited by G. OBE
.
Springer-Verlag, New York.HUDSON, R. R., M. KREWand M. AGUADE, 1987 A test of neutral molecular evolution based on nucleotide data. Genetics 116:
MACDONALD, J. H., and M. KREITMAN, 1991 Adaptive protein evolu- tion at the Adh locus in Drosophila. Nature 351: 652-654.
PERNA, N. T., and T. D. KOCHER, 1995 Unequal base frequencies and the estimation of substitution rates. Mol. Biol. Evol. 1 2 359- 361.
SAWYER, S., D. E. DYKHUIZEN and D. L. HARTL, 1987 Confidence interval for the number of selectively neutral amino acid poly- morphisms. Proc. Natl. Acad. Sci. USA 84: 6225-6228.
COLLINS,T. M.,P. H.WIMBERGERandG.J. P.NAYLOR, 1994 Composi-
153-159.