EVALUATION OF STRENGTH OF CONCRETE IN STRUCTURES
SUBJECTED TO SUSTAINED ELEVATED TEMPERATURES
Kaoru Inaba1, Toshinobu Maenaka2, Yoshitaka Ichihara3, Hideo Kasami4, Takafumi Tayama5, and Hironobu Nishi6
1
Chief Researcher, Research & Development Institute, Takenaka Corporation, Japan 2
Manager, Power Facilities, Engineering Department, Takenaka Corporation, Japan 3
Engineer, Power Facilities, Engineering Department, Takenaka Corporation, Japan 4
Technical adviser, Japan Association for Building Research Promotion, Tokyo, Japan 5
Manager, Hachioji Building Material Inspection Center, Japan Center for Building Research Promotion, Tokyo, Japan
6
Senior Researcher, Concrete Laboratory, FLOWRIC Co. Ltd., Ibaraki, Japan
ABSTRACT
Technical data has been obtained on the strength of massive concrete structures subjected to elevated temperature such as shielding walls in nuclear power plants. In such structures, concrete structures are subjected to temperature rises caused by hydration heat during construction and gradient-elevated temperature during their use, and these may both cause a non-uniform strength distribution.
This paper presents an investigation on concrete strength in massive concrete structures subjected
to sustained high temperatures or gradient-elevated temperatures. Based on the authors’ past papers, the
effects of moisture in specimens on their compressive strength under normal conditions and after being exposed to elevated temperatures, the effects of diameter/length ratio on core strength affected by moisture and loading direction with regards to concrete placement, and estimates of moisture and strength distribution in a massive shielding wall were investigated.
The strength of concrete dried at an elevated temperature was found to be lower with regards to wet strength than with regards to dry strength, indicating a ratio of 0.8 for compressive strength and 0.9
for tensile strength, while Young’s modulus showed no change. The L/D correction factors were found to
be affected by moisture in the core and the direction of loading to concrete placing. Compressive strength after elevated-temperature exposure did not decline with temperature and the term of exposure, showing a reduction by 10% in a dry test and 20% in a wet test at 50°C and at 80–110°C with a 5% and 25% reduction respectively. Reductions in tensile, shear and bond strengths were greater.
In conclusion, sustained exposure to elevated temperatures without any seal may cause a significant strength reduction especially in tensile, shear and bond strengths. Estimates of strength distribution in a shielding wall suggested a strength reduction at the liner and open side and an increase in strength in the middle zone, and this could cause difficulty in determining concrete strength with core tests.
1. INTRODUCTION
In the shield design of nuclear power plant facilities in Japan, it is confirmed during construction that the desired values in shield design are satisfied by using the dry weight per unit volume of concrete. However, because it takes an extremely long time before the entire massive shielding concrete member of a nuclear power plant becomes dry, the shielding design in the dry unit weight is used as a safe-side evaluation.
23rd Conference on Structural Mechanics in Reactor Technology Manchester, United Kingdom - August 10-14, 2015 Division I
associated with a temperature gradient caused by long-time heating, an increase in voids associated with moisture transfer, and a strength change due to re-hydration during use.
If the required shielding performance changes due to equipment replacement, it is important in terms of design to grasp the actual shielding performance of concrete after a time-related change and in terms of maintenance to predict future shielding performance in consideration of the moisture in concrete and time-related moisture transfer.
The authors created a predictive model of heat transfer and moisture transfer in concrete subject to heating, performed a predictive simulation of long-term moisture transfer and estimated variations in strength distribution in concrete due to variations in moisture distribution (Kasami et al.(2013), Ichihara et al.(2013)). It was confirmed that the calculation result is generally adequate and proper, and the variation in moisture distribution and strength distribution caused by heating temperature was evaluated
quantitatively. However, there are some unresolved issues such as how to evaluate models using measured values and how to evaluate the impact of rehydration and decomposition.
For example, the model was evaluated for adequacy by using the simulation results in studies conducted by England and Ross(1972), England(1971), Chapman and England(1972) as shown in Fig. 1(a), but no comparison was made with the test result shown in Fig. 1(b). It was intended to confirm the accuracy of the simulation and check whether the model can yield the same result under the same conditions as the known analysis conditions but comparison should be made with the test result in checking for consistency with actual phenomena.
(a) Simulation Results (b) Experimental Results
Figure 1 England et al.’s Simulation and Experimental Results (adapted from England (1971))
Weight Loss Residual Compressive
Strength vs. Weight Loss
Residual Compressive Strength Case B 90˚C 0.0 0.3 0.6 0.9 1.2 1.5 1.8 -0.5 0.0 0.5 1.0 1.5 2.0 2.5 3.0 D is ta n ce fro m Bo tt o m L in in g S u rfa ce (m )
Weight Loss (%)
20 30 40 50 60 70 80 90 100 110 120 130
0 2 4 6 8
Re si dua l Ra ti o (%)
Weight Loss (%)
0.0 0.3 0.6 0.9 1.2 1.5 1.8
80 90 100 110 120
D is ta nc e from Bot tom L ini ng S urfa ce (m )
Residual Ratio (%)
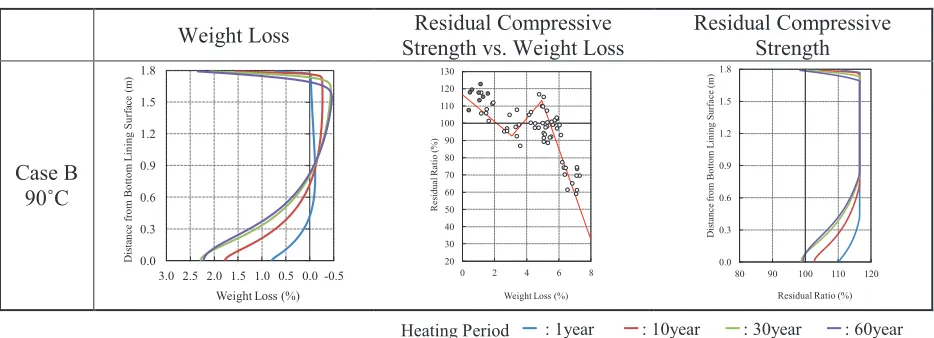
Figure 2 Calculated Weight Loss and Estimation of Compressive Strength Distribution (adapted from Kasami et al.(2013) and Ichihara et al.(2013))
There is a possibility that the strength in the mass gain region was underestimated because no consideration was given to the progress of rehydration in the region where moisture transfer causes a mass increase. Figure 2 shows the result of calculating the mass reduction rate, the relationship between the residual rate of compressive strength and mass reduction rate, and the estimated result of residual rate of compressive strength in the past thesis.
It is very important to evaluate the actual performance of an aging structure, but it is not easy to evaluate the shielding performance and strength of shielding concrete of a nuclear power plant because of density changes and strength changes induced by complex physical phenomena. In addition, it is difficult to collect samples using an actual machine because of the impact of radioactive rays or the like.
Thus, prediction by numerical simulation is an effective method but some issues are left unresolved as described earlier. In this study, additional evaluation was performed on the model to examine possible factors affecting heat/moisture transfer for the sake of future study. In addition, concrete strength distribution was re-examined using the moisture distribution prediction result obtained from simulation. In this document, the result and future issues are reported.
2. ESTABLISHMENT OF MOISTURE AND HEAT MIGRATION MODEL
(1) Outline
Several studies as follows : England and Ross (1972), England(1971), Chapman and England (1977), Shiire and Cheong(1988), Takeda et al. (1987), Kishitani et al.(1984), Harada and Terai (1995), Ichise, et al.(2013), and so on, have been conducted regarding moisture transfer in concrete subject to heating. There are several study reports, for example Abe(1987), Maruyama et al.(2006), regarding the modeling of heat/moisture transfer in the dry shrinkage process but non-stationary change of vapor pressure due to moisture evaporation was not included in the dry shrinkage model. The authors developed a multiphase flow model coupled with thermal hydraulics including non-stationary moisture evaporation to predict the moisture state in concrete subject to prolonged heating.
(2) Establishment of Estimation Method of Moisture and Heat Migration
This examination is intended to upgrade the model of moisture transfer in concrete subject to heating without consideration given to rehydration or decomposition. The physical mechanism of moisture transfer in concrete subject to heating is as follows.
- Temperature rise in heated surface
- Increase of atmospheric pressure in void induced by temperature rise - Evaporation of liquid water and increase in vapor pressure
- Occurrence of pressure gradient
- Occurrence of fluid flux to the release surface opposite to the heated surface
For the fluid flow in the void, Darcy’s law is generally used. The flux of water of one-dimensional flow (vw) is expressed by a generalized form of Darcy’s law (Wycof et al.(1934)) as follows.
x P KK
v w
w rw w
¶ ¶ -=
h (1)
where K is absolute permeability, Krw is relative permeability of water phase, hw is water viscosity and Pw is water pressure. The impact of gravity is ignored here. hw is a function of temperature. The relationship between the water pressure and air pressure is expressed as follows:
C a
w P P
23rd Conference on Structural Mechanics in Reactor Technology Manchester, United Kingdom - August 10-14, 2015 Division I
where Pc is capillarity pressure. Krw and Pc (hereinafter referred to as unsaturated properties) are functions of degree of water saturation.
The material balance by multiphase one-dimensional flow of wet air a, water vapor v and liquid
water w in concrete is expressed using a generalized form of Darcy’s law as follows.
Ev x P KK x t m w w rw w w -÷÷ ø ö çç è æ ¶ ¶ ¶ ¶ -= ¶ ¶ h r (3) Ev x P KK x t m a a ra a a + ÷÷ ø ö çç è æ ¶ ¶ ¶ ¶ -= ¶ ¶ h r (4) ÷ ø ö ç è æ ¶ ¶ + + ÷÷ ø ö çç è æ ¶ ¶ ¶ ¶ -= ¶ ¶ x h D Ev x P KK x t m v a a ra v v h r (5)
where m is mass per unit volume, ρ is density, Ev is evaporation flux of liquid water, h is humidity, Dv is water vapor diffusion coefficient, x is position coordinate, t is time, subscript w is liquid water, a is wet air and v is water vapor.
Energy balance is expressed as follows:
( ) ( ) Ev
x T x E v x E v x t U a a w
w l ÷-i
ø ö ç è æ ¶ ¶ ¶ ¶ -¶ ¶ + ¶ ¶ = ¶ ¶ (6)
where U is internal energy, v is flux, E is enthalpy, λ is thermal conductivity, T is temperature and
ι is latent heat of vaporization of water.
It is assumed that the evaporation flux is expressed in the equation as follows:
(e e)
Ev=k SAT- (7)
where κ represents coefficient, eSAT is saturated vapor pressure and e is vapor pressure.
κ is obtained by fitting with the existing study. By forming the following assumption, expressions
(3) to (6) can be solved numerically and continuously using the degree of water saturation Sw, wet air pressure Pa, steam density ρv and temperature T as variables.
(a) Impact of hydration and decomposition is ignorable
(b) The sum of degree of air saturation and degree of water saturation is 1 (c) Liquid water is incompressible
(d) Air and water vapor are ideal gases
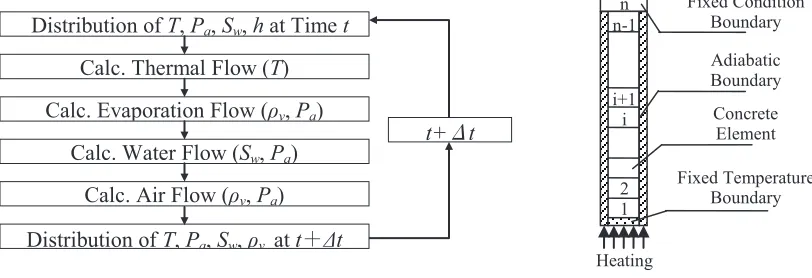
Figure 3 Calculation Flow of Moisture Migration Figure 4 Analysis Model
However, in this study, the variables are solved explicitly in accordance with the flow chart shown in Fig. 2 in consideration of the impact of nonlinearity. The conceptual diagram of the analysis model is shown in Fig. 4. The diffusion of water vapor and advection of heat are ignored in this study because they have a relatively small impact. It is assumed that no moisture evaporation occurs from the heated surface to the outside when a steel liner is used.
Distribution of T, Pa, Sw, h at Time t
Calc. Thermal Flow (T)
Calc. Evaporation Flow (ρv, Pa)
Calc. Water Flow (Sw, Pa)
Calc. Air Flow (ρv, Pa)
Distribution of T, Pa, Sw, ρv at t㸩Δt
t+Ǽt
(3) Fitting to Experimental Results and Parameter Studies
A parameter study was conducted by comparing the test results of England (1971). with the calculation result of the constructed model. An overview of the test conducted by England et al. is shown in Figure 5. The test result is shown in Figure 1(b).
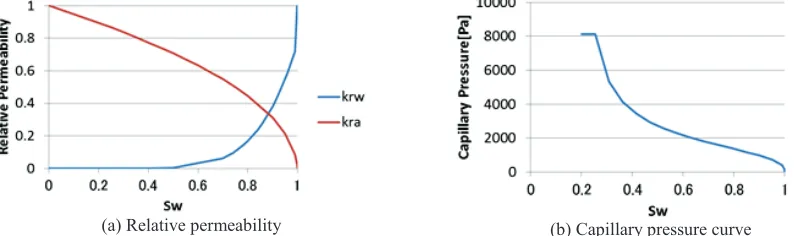
In addition, the model of van Genuchten(1980) (hereinafter referred to as the VG model) was used to represent unsaturated properties. The VG model represents the curve of relative permeability and capillarity pressure with two parameters (referred to as VG parameters). Lenhard and Parker (1987) indicated the relative permeability of wet air can be similarly represented with the VG model, a fitting operation was performed using VG parameters.
Observation results obtained 50 days and 200 days after the start of heating were used for fitting. The fitting results are shown in Figure 6. Unsaturated properties obtained by fitting are shown in Figure 7.
The VG parameters are shown in Table 1. In addition, the absolute permeability K, void ratio f and
evaporation speed coefficient κ are as follows: K: 3.0×10⁻¹⁷ m2 f: 0.119 κ: 5.2×10⁻⁹ kg/m2/s
Because there is consistency for the most part in moisture distribution and decrease in moisture on a heated surface, proper parameters are set.
Figure 5 Overview of Experimental System (England 1971) Figure 6 Fitting Result (based on England (1971))
Figure 7 Relative Permeability and Capillary Pressure Curves Obtained from Fitting
Table 1 VG Parameters in the Fitting Case
α [cm-1] n
Krw: Relative permeability of water — 5
Kra: Relative permeability of wet air — 1.05
Pc: Capillary pressure 6 x 10⁻⁴ 2.7
23rd Conference on Structural Mechanics in Reactor Technology Manchester, United Kingdom - August 10-14, 2015 Division I (4) Simulation Case Settings and Estimation Results of Moisture Distribution
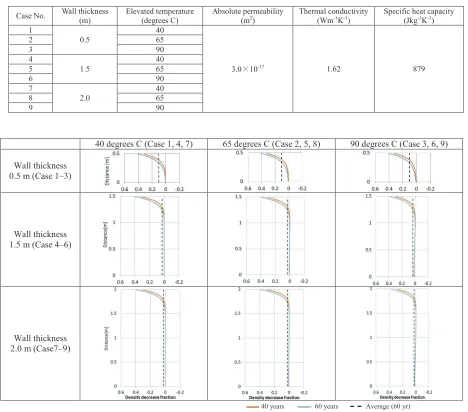
Because the heat environment and shielding thickness or the like of a nuclear power plant will vary depending on the nuclear reactor type and equipment operation conditions, multiple cases where the wall thickness and the temperature of heated surface are fluctuation factors are set in this examination in reference to the existing documents as follows: AIJ(1985,2004a,2004b), JSME(2003), Fukuhara et al.(1997), Ynagi et al.(2001). Simulation case conditions are shown in Table 2. For the physical properties of concrete such as permeability, the examination results of the preceding section were applied
correspondingly.
It was set as an initial condition that the temperature in the wall was 20°C. The boundary grid of
release surface was set as the fixed boundary grid at a temperature of 20°C, a pressure of 1 atmosphere
and a humidity of 10%.
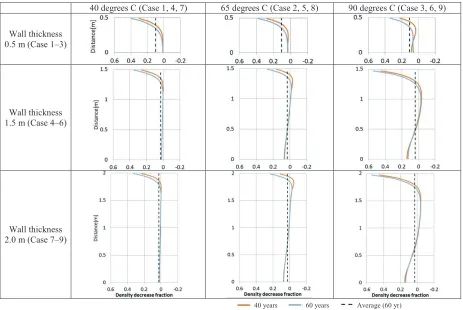
The calculation results of density reduction rate 40 years and 60 years after the heating was started in each case are shown in Figure 8.
Table 2 Simulation Cases
Case No. Wall thickness (m)
Elevated temperature (degrees C)
Absolute permeability (m2)
Thermal conductivity (Wm-1K-1)
Specific heat capacity (Jkg-1K-1)
1
0.5
40
3.010-17 1.62 879
2 65
3 90
4
1.5
40
5 65
6 90
7
2.0
40
8 65
9 90
40 degrees C (Case 1, 4, 7) 65 degrees C (Case 2, 5, 8) 90 degrees C (Case 3, 6, 9)
Wall thickness
0.5 m (Case 1–3)
Wall thickness
1.5 m (Case 4–6)
Wall thickness
2.0 m (Case7–9)
(5) Estimation Influences of Parameter Settings
It is found that unsaturated properties such as relative permeability and capillarity pressure cause a significant impact in the process of the parameter study. For example, when only the relative
permeability of air is changed as shown in Figure 9, the calculation result of the density reduction rate in the concrete is as shown in Figure 10.
Because there are interactions between moisture transfer and air transfer in concrete, it is of significant importance to set unsaturated properties properly.
Figure 9 Revised Relative Permeability of Wet Air
40 degrees C (Case 1, 4, 7) 65 degrees C (Case 2, 5, 8) 90 degrees C (Case 3, 6, 9)
Wall thickness
0.5 m (Case 1–3)
Wall thickness
1.5 m (Case 4–6)
Wall thickness
2.0 m (Case 7–9)
Figure 10 Simulation Result using Revised Relative Permeability Curve 40 years 60 years Average (60 yr)
23 Conference on Structural Mechanics in Reactor Technology Manchester, United Kingdom - August 10-14, 2015 Division I
3. ESTIMATION OF CHANGES IN STRENGTH DISTRIBUTOIN
(1) Modeling of Correlation between Weight Loss and Compressive Strength
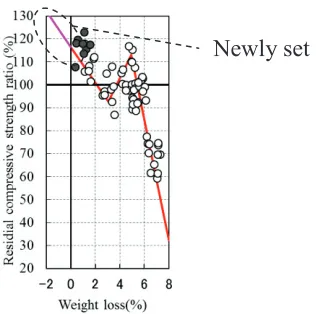
The correlation between mass reduction rate and residual rate of compressive strength of concrete has been determined in past studies of Kasami et al.(2013) and Ichihara et al.(2013). The residual rate of compressive strength in the region where the mass increases was newly added by extrapolation. The correlation newly set is shown in Figure 11.
The mass reduction rate was calculated and the residual rate of compressive strength was evaluated using the correlation. As an example, the residual rate of compressive strength distribution of case 9 is shown in Figure 12.
Figure 11 Correlation between Weight Loss and Residual Compressive Strength Ratio of NP
Cement Concrete Made in 1979
Figure 12 Calculated Weight Loss Distribution in Case 9
(2)Estimated Compressive Strength Distribution Based on the Experiment in 1979
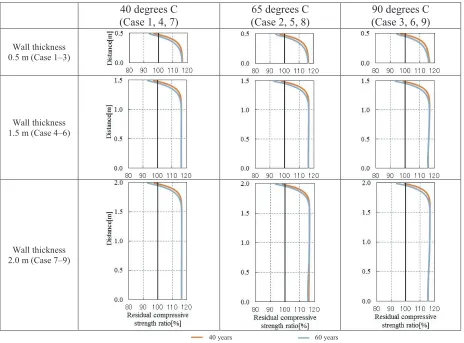
In this section, on the assumption that the shielding concrete of a nuclear power plant constructed in the 1970s has deteriorated with time, the compressive strength after undergoing time-related change for 40 years and 60 years is evaluated in accordance with the correlation between residual compressive strength and mass reduction rate. The evaluation result is shown in Figure 13.
4. DISCUSSIONS
Some problems remain unsolved. Major issues for future investigation are as follows:
1) It is necessary to perform a further comparison between the observation result and simulation to check the adequacy under various conditions.
2) Consideration has not been given yet to hydration and decomposition. These phenomena have an effect on unsaturated properties. They must be taken into consideration in order to perform a long-term
prediction with accuracy.
3) Although there are several study reports regarding flow properties [such as 20) and 21)], it is necessary to collect and evaluate more observation results.
4) Because the heating conditions vary due to regular inspections in a nuclear power plant, heating must be taken into consideration repeatedly.
5) It is necessary to collect more data on structural changes such as compressive strength in regions where the mass increases due to moisture transfer.
In performing the simulation of moisture transfer in massive shielding concrete subject to heating, it is necessary to set unsaturated properties properly. Therefore, further examination is necessary to improve the reliability of the model and establish a general-purpose evaluation method for time-related aging of concrete.
5. CONCLUSION
The following preliminary conclusions were obtained as results of present investigations concerning estimation of compressive strength in a massive wall subjected to gradient-elevated temperatures.
1) Parameter studies with test results were conducted. It is found that moisture transfer phenomena that are consistent with actual phenomena can be simulated by setting proper parameters.
2) In the prediction results of a simulation model, the density decrease of the entire wall is about 0.05 to 0.1% and the wall has a maximum density decrease of about 0.6% around the release surface.
3) The wall has a minimum residual rate of compressive strength of about 85 to 90% around the release surface.
4) Flow properties have an effect on time-related change of concrete. However, its effect on the average of density and compressive strength is small.
5) When the required shielding performance changes due to equipment replacement, the shielding design in the density around the release surface has reasonablility that it can be used as a safe-side evaluation.
40 degrees C (Case 1, 4, 7)
65 degrees C (Case 2, 5, 8)
90 degrees C (Case 3, 6, 9)
Wall thickness
0.5 m (Case 1–3)
Wall thickness
1.5 m (Case 4–6)
Wall thickness
2.0 m (Case 7–9)
Figure 13 Estimated Distribution of Residual Compressive Strength of Concrete in 1979 60 years
23rd Conference on Structural Mechanics in Reactor Technology Manchester, United Kingdom - August 10-14, 2015 Division I REFERENCES
Abe, T.(1987). “A Mathmatical Model of Heat and Moisture Transfer in Concrete”, Hukui national
college technology study bulletin, Natural science engineering, No. 21, Japan, (in Japanese)
AIJ. (1985). Symposium, thermal stress design method for nuclear concrete structure, AIJ, Japan, (in Japanese)
AIJ. (2004a). Japan architectural standard specification for reinforced concrete work in nuclear power
plants (JASS 5N), AIJ, Japan, (in Japanese)
AIJ. (2004b). Recommendations for durability design and construction practice of reinforced concrete, AIJ, Japan, (in Japanese)
Chapman, D. A. and England, G. L.(1977). "Effects of Moisture Migration on Shrinkage, Pore Pressures and other Concrete Properties", Trans. Int. Conf. SMiRT 4th, Vol. H, USA
England, G. L.(1971). "Migration of Moisture and Pore Pressures in Heated Concrete", Trans. Int. Conf. SMiRT, 3rd, Vol. H, USA.
England, G. L., Ross, A. D. (1972). "Shrinkage, Moisture and Pore Pressures in Heated Concrete", Concrete for nuclear reactors, American Concrete Institute, SP34-42, Detroit, USA
Fukuhara, T. et al. (1997). “Capillary infiltration and Estimation of Unsaturated Hydraulic Conductivity of
Concrete by The Unsteady Method”, Journal of Materials, Concrete Structures and Pavements, 564,V-35,
89-96, (in Japanese).
van Genuchten, M. Th.(1980). "A Closed-form Equation for Predicting the Hydraulic Conductivity of Unsaturated Soils", Soil Sci. Soc. Am. J., Vol. 44
Harada, K., Terai, T.(1995). “A model of heat and mass transfer in concrete during fire”, Journal of structural and construction engineering, Transactions of AIJ, No. 477, pp.185-190, (in Japanese) Ichihara, Y., Maenaka, T., Inaba, K. and Kasami, H.(2013)." Estimation of Long-Term Concrete Strength
in Massive Shielding Wall Subjected to Gradient Elevated Temperature in BWR Type Nuclear Power Plant", Division I, Transactions, SMiRT-22, San Francisco, California, USA.
Ichise, K. et al. (2013). “Physical properties of massive concrete exposure to long-term heating (part5) Physical
properties of massive member after on year heating”, Summaries of Annual Meeting of AIJ, ,
pp.1331-332 ,Japan (in Japanese)
JSME (Japan Society of Mechanical Engineers).(2003), “Standards for Nuclear Power Generation
Equipment: Concrete Reactor Containment Vessel”, JSME S NE1-2003.
Kasami, H., Nishi, H., Tamura, M., Ichihara, Y. and Maenaka, T.(2013). "Evaluation of Temperature, Moisture Evaporation and Strength of Concrete Subjected to Sustained Elevated Temperatures up
to 300 ˚C", Division I, Transactions, SMiRT-22,San Francisco, California, USA..
Kishitani, K., Kasami, H., et al. (1984). “Experimental study on the properties of concrete exposed to
sustained elevated temperature”, Cement & Concrete, No. 444, Cement Association, Japan, (in
Japanese)
Lenhard, R. J. and Parker, J.C. (1987). “A model for hysteretic constitutive relation governing multiphase flow 2. Permeability-saturation relations”, Water Resources Research, 23, 12, 2197-2206.
Maruyama, I., Noguchi, T., Sato, R.(2006). “Prediction of temperature and moisture distribution in
high-strength mass concrete based on heat and moisture transport model”, Journal of structural and
construction engineering, Transactions of AIJ, No.70, vol.600, pp.1-8, Japan, (in Japanese)
Shiire, T., Cheong, S.(1988). "Experimental study on strength characteristics of massive concrete structures
subjected to high temperature from one side”, Journal of structural and construction engineering, Transactions of AIJ , 387, 8-14, Japan, (in Japanese)
Takeda, T. et al. (1987). "Experimental Studies on Characteristics of Concrete Members Subjected to High Temperatures", Vol. H. Trans. of 9th Int. Conf. on St. Mech. in Reactor Technology, USA
Wycof, R.D. et al. (1934). “Measurement of permeability of porous media”, Bulletin of the American Association of Petroleum Geologists, 18, 161-190.
Yanagi, H. et al. (2001). “Effects of The Water-Cement Ratio on Moisture Absorption in Unsaturated Concretes”,