Page 1 of 13 Original Article
Integrated analysis identifying long non-coding RNAs (lncRNAs)
for competing endogenous RNAs (ceRNAs) network-regulated
palatal shelf fusion in the development of mouse cleft palate
Xuan Shu, Zejun Dong, Mingjun Zhang, Shenyou Shu
The Cleft Lip and Palate Treatment Center, Second Affiliated Hospital of Shantou University Medical College, Shantou 515041, China
Contributions: (I) Conception and design: S Shu; (II) Administrative support: X Shu; (III) Provision of study materials or patients: S Shu; (IV) Collection and assembly of data: Z Dong; (V) Data analysis and interpretation: M Zhang; (VI) Manuscript writing: All authors; (VII) Final approval of manuscript: All authors.
Correspondence to: Dr. Shenyou Shu. The Cleft Lip and Palate Treatment Center, Second Affiliated Hospital of Shantou University Medical College, No. 69, Dongxia North Road, Jinping District, Shantou 515041, China. Email: [email protected].
Background: Cleft palate results from the defective palatal fusion of the medial-edge epithelium after cells undergo epithelial-mesenchymal transition, a process that involves regulation by microRNAs (miRNAs). However, in palatal shelf fusion, miRNA regulation by long non-coding RNAs (lncRNAs) when acting as competing endogenous RNAs (ceRNAs) or miRNA sponges, remains unclear.
Methods: We systematically analyzed the correlation between lncRNAs, miRNAs, and mRNAs from RNA sequencing profiling in embryonic gestation day 14.5 (E14.5) mouse embryos from control (n=3) and all-trans retinoic acid (ATRA)-treated (n=3) mice. We then constructed a lncRNA-associated ceRNA network. The expression profiles of mRNA, lncRNA, and miRNA were verified by quantitative polymerase chain reaction (qPCR).
Results: In total, 18 aberrantly expressed miRNAs, 861 mRNAs, and 583 lncRNAs were identified from palate samples of control and ATRA-treated samples. Bioinformatics data and integrative analysis identified 69 lncRNAs, 18 miRNAs, and 78 mRNAs that were aberrantly expressed, and a ceRNA network was then constructed. Finally, we identified a NONMMUT004850.2/NONMMUT024276.2-miR-741-3p/miR-465b-5p-Prkar1α ceRNA network associated with palatal shelf fusion at E14.5. The qPCR results showed that NONMMUT004850.2 (P=5E−05), NONMMUT024276.2 (P=0.0012), and Prkar1α (P=3E−05) were up-regulated, whereas miR-741-3p (P=0.006) and miR-465b-5p (P=1E−04) were down-regulated in ATRA-treated mice compared to the control samples. The qPCR results were in concordance with the RNA sequencing profiling.
Conclusions: Our study demonstrated that NONMMUT004850.2/NONMMUT024276.2-miR-741-3p/ miR-465b-5p-Prkar1α could potentially serve as an important regulatory mechanism of palatal fusion in the development of the cleft palate.
Keywords: Cleft palate (CP); competing endogenous RNA (ceRNA); epithelial-mesenchymal transition (EMT); microRNA (miRNA); long non-coding RNA (lncRNA)
Submitted Jul 28, 2019. Accepted for publication Nov 05, 2019. doi: 10.21037/atm.2019.11.93
Introduction
Cleft palate (CP) results from failure of embryonic palate shelf apposition and fusion at the midline during embryogenesis (1) and is considered to be caused by the individual and combined effects of genetic and environmental factors (2,3). Epithelial-mesenchymal transition (EMT) of the medial-edge epithelium/midline epithelial seam (MEE/MES) is a crucial process of palatal shelf fusion during palatogenesis (4,5). Thus, any imbalance in MEE/MES cell proliferation and apoptosis, or dysfunction of EMT, may lead to CP formation during palatal shelf fusion (6). In mice, the embryonic palatal shelf first grows vertically in the oral cavity from embryonic gestation day 12.5 (E12.5) to E14; then, at E14.5, the palatal shelves are elevated to the horizontal position and contact each other to complete initial palatal fusion (6). However, the detailed mechanisms regulating palatogenesis remain unclear. Although microRNAs (miRNAs) and/or long non-coding RNAs (lncRNAs) are increasingly being recognized as playing important roles in the development and pathogenesis of several diseases, the regulatory mechanisms by which miRNAs and/or lncRNAs directly or indirectly interact during palatal shelf fusion remain elusive.
Salmena’s research group recently proposed the competing endogenous RNA (ceRNA) hypothesis, which suggests that lncRNAs can “sponge” miRNAs to impair their activity by using shared miRNA response elements (MREs), resulting in the upregulated expression of target genes (7). Subsequent studies have also demonstrated that lncRNAs contain MREs and can act as ceRNAs to compete with mRNAs for the same binding sites on miRNA, consequently influencing multiple biological processes. For example, lncRNA H19 acts as a ceRNA for miR-138 and miR-200a to modulate the expression of multiple genes involved in the EMT (8). Liu et al. (9) further showed that the AEG-1 3'-untranslated region (UTR) functions as a ceRNA to induce EMT in human non-small cell lung cancer cells through the regulation of miR-30a activity. Nevertheless, how lncRNAs, when acting as ceRNAs or miRNA sponges, regulate miRNA in palatal fusion remains unknown.
To clarify this issue, the current study conducted high-throughput sequencing on RNAs and small RNAs obtained from CP embryos of pregnant C57BL/6J mice treated with all-trans retinoic acid (ATRA) (10), which were then compared to control embryos. We analyzed the aberrantly expressed RNA sequencing profiles for the ceRNA
hypothesis to identify a new ceRNA network associated with the development of CP.
Methods
Animals and treatment
The flow chart for the experimental design is displayed in Figure 1. C57BL/6J mice (20–28 g body weight and 8–10 weeks of age; Beijing Vital River Laboratory Animal Technology, Beijing, China) were fed in the Translational Medicine Laboratory of the Second Affiliated Hospital of Shantou University Medical College (Shantou, China). Pregnant females at E10.5 were randomly divided into two groups: a control group and an ATRA-treated group. At E14.5, mice were euthanized, and palatal shelves were dissected using microbiological instruments. Palatal shelf tissues were stored as reported previously (10).
Histomorphology analysis
After palatal shelf tissues of the ATRA-untreated and ATRA-treated embryos (E14.5) were harvested, they were immediately photographed using a Leica M8 digital imaging system camera for morphological observation. The palatal shelf tissues were then embedded in paraffin and sectioned in either the coronal plane. After this, 4 µm paraffin sections were stained with hematoxylin and eosin (H&E) for morphological analysis.
Small RNA-seq and aberrantly expressed RNA profile analysis
For the primary analysis, these RNAs were aligned and then subjected to a BLAST (11) search against Rfam v.10.1 (http://www.sanger.ac.uk/software/Rfam) (12) and GenBank databases (http://www.ncbi.nlm.nih.gov/genbank/). The known miRNAs were identified by aligning against the miRBase v.21 (http://www.mirbase.org/) (13). Based on the hairpin structure of a pre-miRNA and miRBase database, the corresponding miRNA star sequence was also identified. Aberrantly expressed miRNAs were identified (P<0.05) and predicted using miRanda software (14), under the following parameters: S ≥150 ΔG ≤−30 kcal/mol and strict demand
strict 5' seed pairing.
RNA-seq and differential expression profile analysis
Total RNA in the embryonic palatal shelf tissue (n=6, 3 ATRA-treated samples vs. 3 control samples) was isolated with TRIzol® reagent (Invitrogen, Carlsbad, CA, USA) following the manufacturer’s instructions. Libraries were constructed using TruSeq Stranded Total RNA with Ribo-Zero Gold (Illumina Inc., San Diego, CA, USA) according to the manufacturer’s protocol. Raw sequencing read data was stored in FastQC (v0.11.4). After removing the reads that contained the adapter contamination (i.e., low-quality bases and undetermined bases), the high-quality paired-end reads for each sample were mapped to the mouse Construction C57BL/6J cleft
palate model
RNA sequencing
Differentially expressed mRNAs
Differentially expressed miRNAs
Differentially expressed IncRNAs
miRNA-mRNA target sites prediction/miRanda
miRNA-IncRNA target sites prediction/miRanda miRNA-mRNA correlation miRNA-lncRNA correlation
Filtered miRNA-mRNA Filtered miRNA-lncRNA
Filtered IncRNA-miRNA-mRNA
ceRNA score
[image:3.595.126.473.81.464.2]ceRNA network GO/KEGG analysis qPCR validation IncRNA-mRNA correlation prediction Small RNA sequencing
Figure 1 Flow chart for the experimental design. miRNAs, microRNAs; lncRNAs, long non-coding RNAs; ceRNA, competing endogenous
reference genome (ftp://ftp.ensembl.org/pub/release-84/ fasta/mus_musculus/cdna/Mus_musculus.GRCm38.cdna. all.fa.gz) using Bowtie2 (v.2.2.6)/TopHat2 (v.2.1.0) software. Uniquely mapped reads were normalized to mRNA or lncRNA expression as fragments per kb per million reads (FPKM) using Cufflinks (v. 2.2.1) software. The average sequencing depths of the mRNAs/lncRNAs in each sample are listed in Table S1, while the distribution statistics of transcript abundance (FPKM) are shown in Table S2. Differentially expressed mRNAs and lncRNAs were identified using DESeq software (http://bioconductor.org/ packages/release/bioc/html/DESeq.html). Cuffdiff was used to calculate the fold change for every mRNA and lncRNA, while the P value was determined by the false discovery rate (FDR) with multiple hypothesis test corrections (15). Differentially expressed genes (DEGs) were defined when the q-value was <0.05, and the fold change of FPKM was ≥2.0. The lncRNA and mRNA expression level in both the ATRA-treated group and the control group was assessed in the 3 biological and 3 technical replicates.
Correlation analysis
To compare the expression level of a gene across different samples (n=6, 3 ATRA-treated samples vs. 3 control samples), read counts obtained from the RNA‐seq data were normalized as FPKM. For each RNA, we calculated the Pearson correlation coefficient of its expression level for that of each differentiated miRNA/lncRNA/mRNA. A correlation coefficient between miRNA and lncRNA/ miRNA and mRNA/lncRNA and mRNA smaller than 0.05 with an absolute value of correlation greater than 0.7 was considered to have potential relevance.
miRNA target prediction
The miRNA target prediction process was as follows. First, the miRNA-target relationship pair prediction was performed with the base sequence using miRanda (14) to identify the miRNA-binding sites, including the position on the miRNA and DNA sequence, and the free energy of MREs (14,16). In addition, the related lncRNA-mRNA pairs were identified to predict the miRNA-lncRNA/ miRNA-mRNA pairs, and pairs that shared the same miRNA were identified as candidate lncRNA-miRNA-mRNA competing for interactions. Second, related miRNA-target pairs were predicted using co-expression values. The miRNA-lncRNA/miRNA-mRNA pairs were
calculated, and the negative correlations of miRNA-target expression were screened out. Third, the overlapping miRNA-target pairs based on the results of intersection that were obtained from the first step (the miRNA-target relationship pair prediction using miRanda) and the second step (the related miRNA-target pairs using co-expression values) were filtered to improve the reliability of the miRNA-target pairs. The regulatory miRNA-target pairs were used for the subsequent prediction of ceRNAs.
Prediction of ceRNAs
If lncRNA can regulate miRNA and the miRNA can regulate an mRNA, the lncRNA may act as a ceRNA. According to the miRNA-target pair prediction, the prediction of the ceRNAs process was as follows. First, ceRNAs were predicted using ceRNA scores, which were calculated as reported previously (17,18). Second, ceRNAs were predicted using expression levels. We selected the ceRNA-related pairs according to the expression levels of the lncRNA-mRNA and miRNA-target pairs (19). Third, the results of the ceRNA score and expression levels were integrated to predict the ceRNA.
Functional prediction
In order to predict the ceRNA candidate genes involved in biological processes and signaling pathways, we performed Gene Ontology (GO) and Kyoto Encyclopedia of Genes and Genomes (KEGG) analyses to assess its functions. For the coding genes with a ceRNA relationship, the hypergeometric distribution test was used to calculate the significance of differential gene enrichment in each GO or KEGG term. The calculated result returned a P value of enrichment significance, and a P value <0.05 indicated that differential gene enrichment occurred in the GO or KEGG term.
Construction of the ceRNA network
According to the prediction of ceRNAs, shared miRNA numbers were sorted from high to low, and pairs with fewer than 3 shared miRNAs were filtered out (20). Then, ceRNA networks were constructed for embryo palatal shelves from both control and ATRA-treated mice.
Quantitative polymerase chain reaction (qPCR) validation
6 individual samples, 3 control, and 3 ATRA-treated. Each sample was subjected to 3 technical replications for qPCR. The qPCR primers used in this study are shown in Table 1. The miRNA, lncRNA, and mRNA expression levels were analyzed as described previously (21).
Statistical analysis
All statistical analyses were performed using SPSS 16.0 statistical software (SPSS, Chicago, IL, USA). The differential gene expression levels were assessed using the R package edgeR, as described previously (22). qPCR data were analyzed using Student’s t-test. Pearson correlation analysis was used in miRNA-target co-expression analyses.
Results
Histomorphology observations
In this study, 20 pregnant C57BL/6J mice were examined, and 142 embryos were collected, including 86 embryos
from the ATRA-treated group, and 56 embryos from the control group. Each pregnant mouse had multiple embryos. There was at least one CP embryo in each pregnant mouse in the ATRA-treated group, while there were no CP embryos in the control group. The incidence of CP in the treated group was 100%. At E14.5, the ATRA-treated palatal shelves remained separated without fusion (Figure S1A,B). At the same time, the palatal control shelves had contacted each other to complete initial palatal fusion (Figure S1C,D).
Data analysis
A total of 18 aberrantly expressed miRNAs (Table S3), 861 mRNAs (table online: http://fp.amegroups.cn/cms/7c8698 af7959c572ba3f4bce0b9c1a65/atm.2019.11.93-1.pdf), and 583 lncRNAs (table online: http://fp.amegroups.cn/cms/ aa6681b0fd4cd9036c06135d37d28842/atm.2019.11.93-2.pdf) were identified from the sequencing data. Among the aberrantly expressed lncRNAs, mRNAs, and miRNAs, NONMMUT004850.2 (P=0.01827, log2FC: 1.23),
NONMMUT024276.2 (P=0.00046, log2FC: 6.06), and
Prkar1α (P=0.00053, log2FC: 1.03) were up-regulated, respectively, whereas miR-741-3p (P=0.0055, log2FC: −2.57) and miR-465b-5p (P=0.021, log2FC: −1.98) were down-regulated (Table 2).
miRNA-target relationships predicted by correlation analysis
[image:5.595.43.554.96.246.2]According to the obtained sequences, we identified a total of 6,251 MREs for 18 miRNAs that target 859 mRNAs
Table 1 Primer sequences used in qPCR
Gene Primer
miR-465b-5p Forward: 5'-tAtttAGAAtGGtGCtGAtCtG-3'
miR-470-5p Forward: 5'-ttCttGGACtGGCACtGGtGAGt-3'
Prkar1α Forward: 5'-aagcacaatatccaggccct-3'
Reverse: 5'-cttgcctcctccttctccaa-3'
NONMMUT004850.2 Forward: 5'-CCATTCCACGTCCCACTTTG-3'
Reverse: 5'-ATAAACACCTCCCCTCTGGC-3'
NONMMUT024276.2 Forward: 5'-TTGCCACTGTGCCTTTTACC-3'
Reverse: 5'-GTGGTCTAAGTGGTCCTGCT-3' qPCR, quantitative polymerase chain reaction.
Table 2 RNA-seq data of aberrantly expressed lncRNA, mRNA,
and miRNA
Gene log2FC P value Up/down
miR-741-3p −2.57 0.0055 Down
miR-465b-5p −1.98 0.021 Down
Prkar1α 1.03 0.00053 Up
NONMMUT004850.2 1.23 0.01827 Up
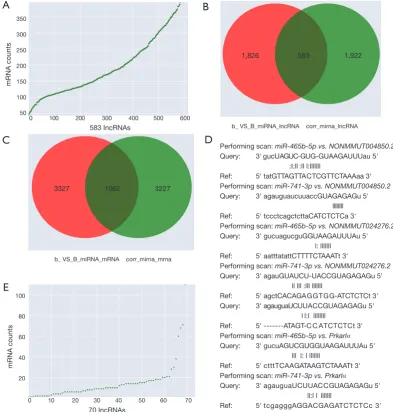
[image:5.595.44.287.307.406.2](Figure 2A, table online: http://fp.amegroups.cn/cms/aa65 7847352490aa1cebb75a80959d00/atm.2019.11.93-3.pdf), and 3,312 MREs for 18 miRNAs that target 536 lncRNAs (Figure 2B, table online: http://fp.amegroups.cn/cms/84c 11d0428a3f0234943a75cf2c5402c/atm.2019.11.93-4.pdf). Moreover, we identified a total of 4,839 interactions of 18 miRNAs with 861 mRNAs according to the co-expression values (Figure 2C). There were 2,505 interactions of 18 miRNAs with 519 lncRNAs (Figure 2D) and 109,834 interactions of 583 lncRNAs, with 395 of the identified mRNAs (Figure 3A).
The correlation analysis of NONMMUT004850.2/ NONMMUT024276.2-miR-741-3p/miR-465b-5p-Prkar1α
Pearson’s correlation coefficient showed that Prkar1α
vs. NONMMUT004850.2/NONMMUT024276.2 is a positive correlation, and miR-741-3p/miR-465b-5p vs.
NONMMUT004850.2/NONMMUT024276.2/Prkar1α
is a negative correlation (Table 3). Pearson’s correlation coefficient’s absolute value >0.8 with a P value <0.05 was considered statistically significant. Furthermore, using miRanda, we obtained 583 interactions of 2,409
miRNA-lncRNA target pairs with 2,505 miRNA-miRNA-lncRNA co-expression profiles (Figure 3B, table online: http:// fp.amegroups.cn/cms/514ebd18cdb42cb898b8b78417f8e5 bb/atm.2019.11.93-5.pdf), and 1,062 interactions of 4,389 miRNA-mRNA target pairs with 4,289 miRNA-mRNA co-expression profiles (Figure 3C, table online: http:// fp.amegroups.cn/cms/152d8707844d0b419baf806cf32aa 70c/atm.2019.11.93-6.pdf). Among the miRNA-target-binding sites, miR-741-3p/miR-465b-5p-target miRNA-target-binding NONMMUT024276.2/NONMMUT004850.2 and the Prkar1α 3'-UTR are shown in Figure 3D.
Constructing the ceRNA network
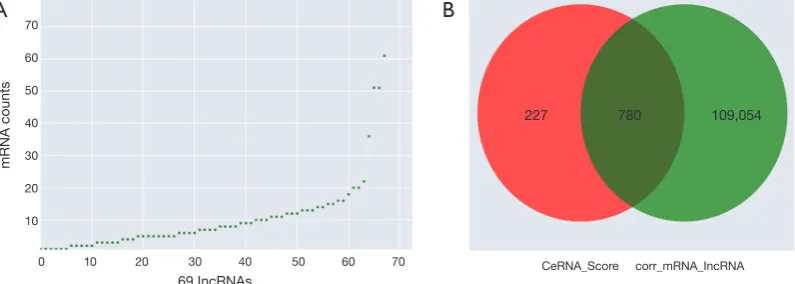
According to the ceRNA scores, we obtained 1,007 ceRNAs (lncRNA-miRNA-mRNA) for 70 lncRNAs with 112 mRNAs (Figure 3E, table online: http://cdn. amegroups.cn/static/application/7a591ed630a25eef64f4 ba47aa81d058/atm.2019.11.93-7.pdf). Based on the co-expression values, 799 ceRNAs (lncRNA-miRNA-mRNA) of 69 lncRNAs with 78 mRNAs (Figure 4A, table online:
Figure 2 Prediction of ceRNAs. (A) MRE numbers of filtered mRNAs based on miRanda; (B) MRE numbers of filtered lncRNAs based on
miRanda; (C) miRNA-mRNA correction; (D) miRNA-lncRNA correction. ceRNAs, competing endogenous RNAs; MRE, miRNA response element; lncRNAs, long non-coding RNAs.
MREs counts
miRNA counts miRNA counts
MREs counts
859 mRNAs
861 mRNAs
536 IncRNAs
519 IncRNAs
70
60
50
40
30
20
10
16
14
12
10
8
6
4
2
16
14
12
10
8
6
4
2 60
50
40
30
20
10
0 200 400 600 800
0 200 400 600 800
0 100 200 300 400 500
0 100 200 300 400 500
A
B
Figure 3 Prediction of ceRNAs and miR-741-3p/miR-465b-5p-target binding sites predicted by correlation analysis in control and
ATRA-treated embryos. (A) LncRNA-mRNA correction; (B) interactions of miRNA-lncRNA target pairs with miRNA-lncRNA co-expression values; (C) interactions of miRNA-mRNA target pairs with miRNA-mRNA co-expression values; (D) miR-741-3p/miR-465b-5p-target binding sites predicted by correlation analysis in control and ATRA-treated embryos; (E) ceRNA score of lncRNA-miRNA-mRNA. LncRNAs, long non-coding RNAs; ceRNAs, competing endogenous RNAs; ATRA, all-trans retinoic acid.
mRNA counts
70 IncRNAs
100
80
60
40
20
0 10 20 30 40 50 60 70
E
1,826 583 1,922
b_ VS_B_miRNA_lncRNA corr_mirna_lncRNA
B
3327 1062 3227
b_ VS_B_miRNA_mRNA corr_mirna_mrna
C
mRNA counts
583 IncRNAs
350
300
250
200
150
100
50
0 100 200 300 400 500 600
A
Performing scan: miR-465b-5p vs. NONMMUT004850.2 Query: 3' gucUAGUC-GUG-GUAAGAUUUau 5' :I:ll :ll l:lllllll
Ref: 5' tatGTTAGTTACTCGTTCTAAAaa 3' Performing scan: miR-741-3p vs. NONMMUT004850.2 Query: 3' agauguaucuuaccGUAGAGAGu 5' llllllll Ref: 5' tccctcagctcttaCATCTCTCa 3'
Performing scan: miR-465b-5p vs. NONMMUT024276.2 Query: 3' gucuagucguGGUAAGAUUUAu 5' l: lllllll
Ref: 5' aatttatattCTTTTCTAAATt 3'
Performing scan: miR-741-3p vs. NONMMUT024276.2 Query: 3' agauGUAUCU-UACCGUAGAGAGu 5' ll lll :lll lllllll
Ref: 5' agctCACAGAGGTGG-ATCTCTCt 3' Query: 3' agauguaUCUUACCGUAGAGAGu 5' l l:l llllllll
Ref: 5' ---ATAGT-C C ATCTCTCt 3' Performing scan: miR-465b-5p vs. Prkarlα Query: 3' gucuAGUCGUGGUAAGAUUUAu 5' lll l: l lllllll
Ref: 5' ctttTCAAGATAAGTCTAAATt 3' Performing scan: miR-741-3p vs. Prkarlα
Query: 3' agauguaUCUUACCGUAGAGAGu 5' ll:l l lllllll
Ref: 5' tcgagggAGGACGAGATCTCTCc 3'
D
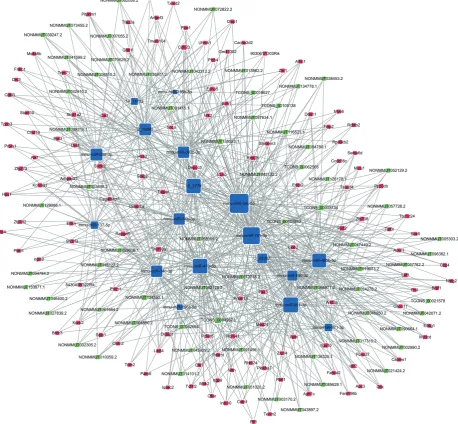
http://cdn.amegroups.cn/static/application/eb89017efa 20b79eb35fa935024c91a2/atm.2019.11.93-8.pdf) were obtained. We then computed the results of the ceRNA scores and further percolated and excluded the overlapped ceRNA. In total, 780 ceRNAs between 1,007 ceRNA scores and 109,834 lncRNA-mRNA pairs were identified (Figure 4B). The ceRNA network was then constructed based on 69 lncRNAs, 18 miRNAs, and 78 mRNAs using
Cytoscape 3.5.1 (23) (Figure 5).
GO and KEGG analysis
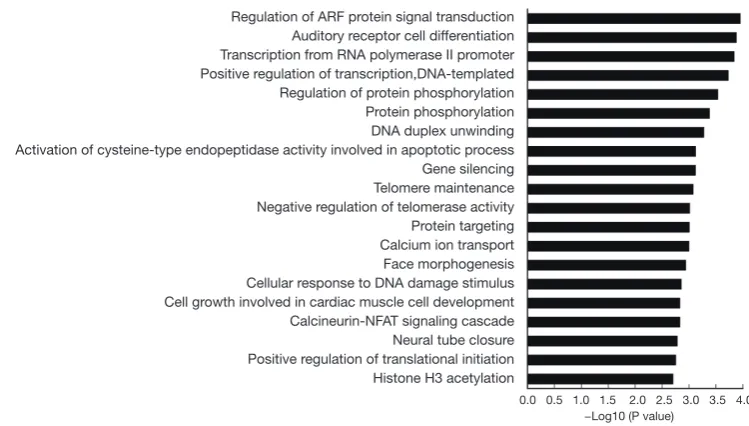
morphogenesis”, and “neural tube closure” (Figure 6). Prkar1α was found to be involved in “regulation of protein kinase activity” and “negative regulation of cyclic AMP (cAMP)-dependent protein kinase activity” (table online: http://fp.amegroups.cn/cms/0a8ef22d1452ed151a738bcb6 faf482c/atm.2019.11.93-9.pdf). Moreover, KEGG analyses showed that the ceRNA-associated genes were involved in “apoptosis”, “Wnt signaling pathway”, and “Focal adhesion” (Figure 7). The KEGG database showed an association of Prkar1α with “apoptosis” (table online: http:// fp.amegroups.cn/cms/b4e6f7b0a030c020405ad82e0a952 7d2/atm.2019.11.93-10.pdf) (P<0.05, fold enrichment >2).
qPCR validation
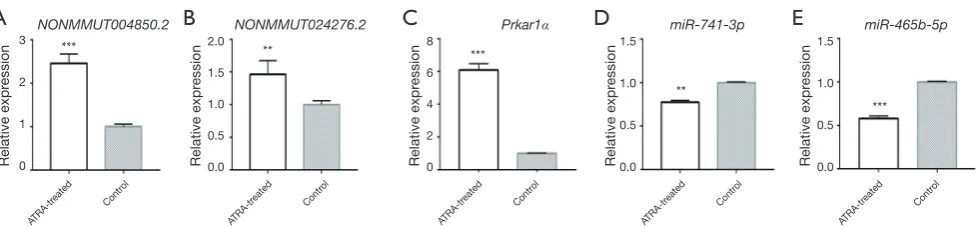
qPCR was performed to further validate NONMMUT004850.2, NONMMUT024276.2, Prkar1α, and
miR-741-3p/miR-465b-5p expression levels between the groups. The results showed that NONMMUT004850.2 (P=5E−05), NONMMUT024276.2 (P=0.0012), and Prkar1α (P=3E−05) were up-regulated, whereas miR-741-3p (P=0.006)/ miR-465b-5p (P=1E−04) was down-regulated (Figure 8). Therefore, the qPCR change trend was in concordance with the sequencing profiling.
Discussion
[image:8.595.45.550.106.254.2]The ceRNA hypothesis proposes a novel molecular, multiple-level gene regulation mechanism that figures significantly in pathological processes (7). However, our understanding of the molecular mechanisms that allow lncRNAs to act as ceRNAs in the palatogenesis of CP is still limited. In our study, we systematically analyzed sequencing data between E14.5 embryos
Figure 4Prediction of ceRNAs. (A) ceRNAs of filtered lncRNAs with mRNA co-expression values; (B) ceRNAs of filtered ceRNA scores
and mRNA-lncRNA correction. LncRNAs, long non-coding RNAs; ceRNAs, competing endogenous RNAs.
mRNA counts
69 IncRNAs
227 780 109,054
70
60
50
40
30
20
10
0 10 20 30 40 50 60 70 CeRNA_Score corr_mRNA_IncRNA
[image:8.595.99.497.288.430.2]A
B
Table 3 The correlation analysis of NONMMUT004850.2/NONMMUT024276.2-miR-741-3p/miR-465b-5p-Prkar1α (correlation: Pearson’s
correlation coefficient)
Right_name Left_name Correlation P value
Prkar1α NONMMUT024276.2 0.871333337 0.02376762
Prkar1α NONMMUT004850.2 0.857946067 0.028835704
miR-465b-5p Prkar1α −0.856875043 0.02926119
miR-741-3p Prkar1α −0.831011068 0.040422959
miR-465b-5p NONMMUT024276.2 −0.822844162 0.04429634
miR-741-3p NONMMUT024276.2 −0.866993668 0.02535954
miR-465b-5p NONMMUT004850.2 −0.821473289 0.044962697
Figure 5 ceRNA analyses indicating potential lncRNA/miRNA/mRNA interactions. The blue tetragon represents lncRNAs, the green
tetragon represents miRNAs, and the red tetragon represents mRNAs. Location of the NONMMUT004850.2/NONMMUT024276.2-miR-741-3p/miR-465b-5p-Prkar1α network in the ceRNA network hub. ceRNAs, competing endogenous RNAs; lncRNAs, long non-coding RNAs.
from control and ATRA-treated mice as a CP model. Bioinformatics analyses of the aberrantly expressed RNAs between the groups led us to speculate that the NONMMUT004850.2/NONMMUT024276.2-miR-741-3p/miR-465b-5p-Prkar1α ceRNA network may be associated with the development of CP.
Prkar1α is located at chromosome 17q24 and encodes a regulatory subunit of protein kinase A (PKA) that regulates
Regulation of ARF protein signal transduction Auditory receptor cell differentiation Transcription from RNA polymerase II promoter Positive regulation of transcription,DNA-templated Regulation of protein phosphorylation Protein phosphorylation DNA duplex unwinding Activation of cysteine-type endopeptidase activity involved in apoptotic process Gene silencing Telomere maintenance Negative regulation of telomerase activity Protein targeting Calcium ion transport Face morphogenesis Cellular response to DNA damage stimulus Cell growth involved in cardiac muscle cell development Calcineurin-NFAT signaling cascade Neural tube closure Positive regulation of translational initiation Histone H3 acetylation
0.0 0.5 1.0 1.5 2.0 2.5 3.0 3.5 4.0 −Log10 (P value)
Biological Process
Axon guidance Arrhythmogenic right ventricular cardiomyopathy (ARVC) Acute myeloid leukemia Apoptosis Wnt signaling pathway Oxytocin signaling pathway Alzheimer’s disease Renin secretion Salivary secretion Thyroid cancer Hypertrophic cardiomyopathy (HCM) Dilated cardiomyopathy cGMP-PKG signaling pathway Melanogenesis Calcium signaling pathway T cell receptor signaling pathway Glutamatergic synapse Thyroid hormone signaling pathway Focal adhesion Endometrial cancer
0 1 2 3 4 5
[image:10.595.94.469.92.305.2]−Log10 (P value) KEGG
Figure 6 GO analyses for the biological process of aberrantly expressed mRNAs involved in the ceRNA network. GO, gene ontology; ceRNA,
competing endogenous RNA.
Figure 7 KEGG pathway analysis of aberrantly expressed mRNAs involved in the ceRNA network. KEGG, Kyoto Encyclopedia of Genes and
Genomes; ceRNA, competing endogenous RNA.
prostaglandin and/or catecholamine, which depresses palatal cAMP levels (26,27). Previous studies show that cAMP levels increase before palatal fusion, which is coupled with increased PKA activation. In addition, PKA activity decreases to baseline after palatal fusion (26,27). In the
[image:10.595.131.463.364.580.2]miRNA-induced target gene silencing requires target gene recognition by the miloaded RNA-induced silencing complex (RISC); however, sequence complementarity between miRNAs and their targets is rare in animals (28). Instead, complementarity between the miRNA seed sequence and the target gene is sufficient for target recognition (29). Based on the ceRNA hypothesis, the NONMMUT004850.2/NONMMUT024276.2-miR-741-3p/miR-465b-5p-Prkar1α ceRNA networks are supported by the following evidence. First, the prediction of the 465b-5p-MREs showed that miR-741-3p/miR-465b-5p vs. NONMMUT024276.2/NONMMUT004850.2, and miR-741-3p/miR-465b-5p vs. Prkar1α have sufficient sequence complementarity (Figure 3D). Second, the ceRNA network was constructed by multiple filtration methods involving ceRNA-related lncRNAs, miRNAs, and mRNAs. Third, functional annotation indicated that Prkar1α is involved in “regulation of protein kinase activity”, “negative regulation of cAMP-dependent protein kinase activity”, and “apoptosis” pathways. Fourth, the NONMMUT004850.2/NONMMUT024276.2-miR-741-3p/miR-465b-5p-Prkar1α network is located at the ceRNA network hub (Figure 5). Finally, the qPCR results showed that NONMMUT004850.2, NONMMUT024276.2, miR-741-3p/miR-465b-5p, and Prkar1α change in concordance with the sequencing profiling.
Despite our findings, it should be noted that our study is still preliminary in nature, and thus further research is needed to completely elucidate the ceRNA-regulation relationship of gene alterations occurring during CP formation. In addition, our sample size is relatively small, and the palatal shelves have been obtained directly from embryonic tissues. Therefore, it is possible that the target tissue could have been contaminated with samples of
surrounding tissue. Another limitation is that we cannot exclude the effect of ATRA and its endogenous small molecule metabolites on the experimental results. We expect to integrate an analysis that identifies lncRNAs for a ceRNA network, which can help to further deepen our understanding of this level of lncRNA-dependent post-transcriptional regulation.
Conclusions
In summary, by constructing and functionally analyzing lncRNA-related networks based on the ceRNA hypothesis, we identified a NONMMUT004850.2/ NONMMUT024276.2-miR-741-3p/miR-465b-5p-Prkar1α ceRNA network that is potentially associated with palatogenesis and the formation of CP, and thus merits further study.
Acknowledgments
Funding: This research was funded by the National Natural Science Foundation of China (grant No. 81571920).
Footnote
Conflicts of Interest: The authors have no conflicts of interest to declare.
[image:11.595.54.544.82.196.2]Ethical Statement: The authors are accountable for all aspects of the work in ensuring that questions related to the accuracy or integrity of any part of the work are appropriately investigated and resolved. The guidelines and protocols for these experiments were approved by the Ethical Committee of the Medical College
Figure 8 qPCR validation for NONMMUT004850.2, NONMMUT024276.2, miR-741-3p/miR-465b-5p, and Prkar1α expression levels in
control and ATRA-treated embryos (**, P<0.01; ***, P<0.001). qPCR, quantitative polymerase chain reaction; ATRA, all-trans retinoic acid.
Relative expr ession Relative expr ession Relative expr ession Relative expr ession Relative expr ession NONMMUT004850.2 *** *** *** ** **
NONMMUT024276.2 Prkar1α miR-741-3p miR-465b-5p
ATRA-tr eated ATRA-tr eated ATRA-tr eated ATRA-tr eated ATRA-tr
eated Control Control Control Control Control
1.5 1.0 0.5 0.0 1.5 1.0 0.5 0.0 8 6 4 2 0 2.0 1.5 1.0 0.5 0.0 3 2 1 0
of Shantou University, Shantou, Guangdong, China (SUMC2015-106).
References
1. Rahimov F, Jugessur A, Murray J. Genetics of
nonsyndromic orofacial clefts. Cleft Palate Craniofac J 2012;49:73-91.
2. Dixon MJ, Marazita ML, Beaty TH, et al. Cleft lip and palate: understanding genetic and environmental influences. Nat Rev Genet 2011;12:167-78.
3. Watkins SE, Meyer RE, Strauss RP, et al. Classification, epidemiology, and genetics of orofacial clefts. Clin Plast Surg 2014;41:149-63.
4. Dudas M, Li W, Kim J, et al. Palatal fusion - where do the midline cells go? A review on cleft palate, a major human birth defect. Acta Histochem 2007;109:1-14.
5. Iordanskaia T, Nawshad A. Mechanisms of
transforming growth factor β induced cell cycle arrest in palate development. J Cell Physiol 2011;226:1415-24.
6. Nawshad A. Palatal seam disintegration: to die or not to die? that is no longer the question. Dev Dyn 2008;237:2643-56.
7. Salmena L, Poliseno L, Tay Y, et al. A ceRNA hypothesis: the Rosetta Stone of a hidden RNA language? Cell 2011;146:353-8.
8. Liang WC, Fu WM, Wong CW, et al. The lncRNA H19 promotes epithelial to mesenchymal transition by functioning as miRNA sponges in colorectal cancer. Oncotarget 2015;6:22513-25.
9. Liu K, Guo L, Guo Y, et al. AEG-1 3'-untranslated region functions as a ceRNA in inducing epithelial-mesenchymal transition of human non-small cell lung cancer by regulating miR-30a activity. Eur J Cell Biol 2015;94:22-31.
10. Shu X, Shu S, Cheng H, et al. Genome-Wide DNA Methylation Analysis During Palatal Fusion Reveals the Potential Mechanism of Enhancer Methylation Regulating Epithelial Mesenchyme Transformation. DNA Cell Biol 2018;37:560-73.
11. Altschul SF, Gish W, Miller W, et al. A basic local alignment search tool. 1990.
12. Sam GJ, Alex B, Mhairi M, et al. Rfam: an RNA family database. Nucleic Acids Research 2003;31:439-41.
13. Griffiths-Jones S, Saini HK, van Dongen S, et al.
miRBase: tools for microRNA genomics. Nucleic Acids Res 2008;36:D154-8.
14. Enright AJ, John B, Gaul U, et al. MicroRNA targets in Drosophila. Genome Biology 2003;5:R1.
15. Jones GN, Pringle DR, Yin Z, et al. Neural crest-specific loss of Prkar1a causes perinatal lethality resulting from defects in intramembranous ossification. Mol Endocrinol 2010;24:1559-68.
16. Liu K, Yan Z, Li Y, et al. Linc2GO: a human LincRNA function annotation resource based on ceRNA hypothesis. Bioinformatics 2013;29:2221-2.
17. Ala U, Karreth F, Bosia C, et al. Integrated transcriptional and competitive endogenous RNA networks are cross-regulated in permissive molecular environments. Proc Natl Acad Sci USA 2013;110:7154-9.
18. Das S, Ghosal S, Sen R, et al. lnCeDB: database of human long noncoding RNA acting as competing endogenous RNA. PLoS One 2014;9:e98965.
19. Zhang B, Horvath S. A general framework for weighted gene co-expression network analysis. Stat Appl Genet Mol Biol 2005;4:Article17.
20. Tay Y, Kats L, Salmena L, et al.
Coding-independent regulation of the tumor suppressor PTEN by competing endogenous mRNAs. Cell 2011;147:344-57.
21. Livak KJ, Schmittgen TD. Analysis of relative gene expression data using real-time quantitative PCR and the 2(-Delta Delta C(T)) Method. Methods 2001;25:402-8.
22. Robinson MD, McCarthy DJ, Smyth GK. edgeR: a Bioconductor package for differential expression analysis of digital gene expression data. Bioinformatics 2010;26:139-40.
23. Kohl M, Wiese S, Warscheid B. Cytoscape: software for visualization and analysis of biological networks. Methods Mol Biol 2011;696:291-303.
24. Marazita ML, Mooney MP. Current concepts in the embryology and genetics of cleft lip and cleft palate. Clin Plast Surg 2004;31:125-40.
25. Selleck MA, Bronner-Fraser M. Origins of the avian neural crest: the role of neural plate-epidermal interactions. Development 1995;121:525-38.
26. Greene RM, Pratt RM. Correlation between cyclic-AMP levels and cytochemical localization of adenylate cyclase during development of the secondary palate. J Histochem Cytochem 1979;27:924-31.
Cite this article as: Shu X, Dong Z, Zhang M, Shu S. Integrated analysis identifying long non-coding RNAs (lncRNAs) for competing endogenous RNAs (ceRNAs) network-regulated palatal shelf fusion in the development of mouse cleft palate. Ann Transl Med 2019;7(23):762. doi: 10.21037/atm.2019.11.93
1989;20:137-52.
28. Krol J, Loedige I, Filipowicz W. The widespread regulation of microRNA biogenesis, function and decay. Nat Rev Genet 2010;11:597-610.
Figure S1 Histomorphology observations of palate shelf tissues at E14.5 between ATRA-treated vs. control mice. (A,B) The ATRA-treated
palatal shelves remained separated without fusion; (C,D) at the same time, the palatal control shelves had contacted each other to complete initial palatal fusion. ATRA, all-trans retinoic acid; E14.5, embryonic gestation day 14.5; PS, palatal shelf; T, tongue; NS, nasal septum; H&E, hematoxylin and eosin. Magnification in (B,D): ×10. (from Shu X, Cheng L, Dong Z, et al. Identification of circular RNA-associated competing endogenous RNA network in the development of cleft palate. J Cell Biochem 2019;120:16062-74).
NS
NS PS T PS
PS PS
T
A
B
C
D
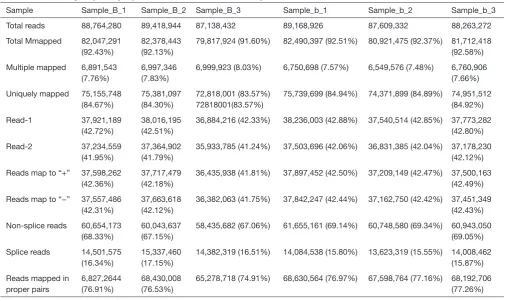
Table S1 The average sequencing depths of mRNAs/lncRNAs in each sample
Sample Sample_B_1 Sample_B_2 Sample_B_3 Sample_b_1 Sample_b_2 Sample_b_3 Total reads 88,764,280 89,418,944 87,138,432 89,168,926 87,609,332 88,263,272 Total Mmapped 82,047,291
(92.43%)
82,378,443 (92.13%)
79,817,924 (91.60%) 82,490,397 (92.51%) 80,921,475 (92.37%) 81,712,418 (92.58%) Multiple mapped 6,891,543
(7.76%)
6,997,346 (7.83%)
6,999,923 (8.03%) 6,750,698 (7.57%) 6,549,576 (7.48%) 6,760,906 (7.66%) Uniquely mapped 75,155,748
(84.67%)
75,381,097 (84.30%)
72,818,001 (83.57%) 72818001(83.57%)
75,739,699 (84.94%) 74,371,899 (84.89%) 74,951,512 (84.92%)
Read-1 37,921,189 (42.72%)
38,016,195 (42.51%)
36,884,216 (42.33%) 38,236,003 (42.88%) 37,540,514 (42.85%) 37,773,282 (42.80%) Read-2 37,234,559
(41.95%)
37,364,902 (41.79%)
35,933,785 (41.24%) 37,503,696 (42.06%) 36,831,385 (42.04%) 37,178,230 (42.12%) Reads map to “+” 37,598,262
(42.36%)
37,717,479 (42.18%)
36,435,938 (41.81%) 37,897,452 (42.50%) 37,209,149 (42.47%) 37,500,163 (42.49%) Reads map to “−” 37,557,486
(42.31%)
37,663,618 (42.12%)
36,382,063 (41.75%) 37,842,247 (42.44%) 37,162,750 (42.42%) 37,451,349 (42.43%) Non-splice reads 60,654,173
(68.33%)
60,043,637 (67.15%)
58,435,682 (67.06%) 61,655,161 (69.14%) 60,748,580 (69.34%) 60,943,050 (69.05%) Splice reads 14,501,575
(16.34%)
15,337,460 (17.15%)
14,382,319 (16.51%) 14,084,538 (15.80%) 13,623,319 (15.55%) 14,008,462 (15.87%) Reads mapped in
proper pairs
6,827,2644 (76.91%)
68,430,008 (76.53%)
[image:14.595.45.553.400.701.2]Sample Min 1 _Qu Median Mean 3 _Qu Max Sd. Sum
Sample_B_1 0 7.72E−10 0.494711 8.107306 3.80795 5,782.285 72.31569 415531.9
Sample_B_2 0 1.55E−05 0.569322 7.841769 4.060894 4,547.561 57.04688 401,922
Sample_B_3 0 2.52E−10 0.473681 8.152621 3.766464 5,249.7 70.47534 417,854.4
Sample_b_1 0 1.11E−11 0.463845 8.179792 3.818568 4,515.164 68.71741 419,247.1
Sample_b_2 0 5.62E−09 0.517495 7.937991 3.845185 4,253.932 60.69267 406,853.8
[image:15.595.44.557.96.211.2]Sample_b_3 0 1.01E−10 0.473085 7.893875 3.819828 4,347.026 61.67466 404,592.7 1st_Qu: the first quartile; 3rd_Qu: the third quartile. Sd., the standard deviation.
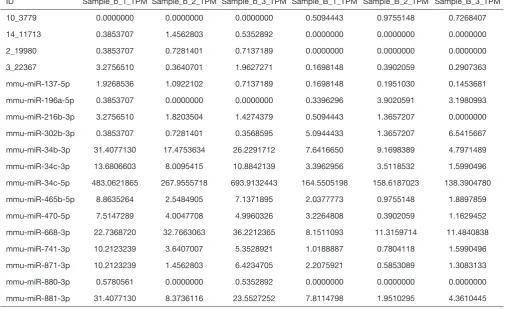
Table S3 b_vs._B_miRNA_normalized
ID Sample_b_1_TPM Sample_b_2_TPM Sample_b_3_TPM Sample_B_1_TPM Sample_B_2_TPM Sample_B_3_TPM
10_3779 0.0000000 0.0000000 0.0000000 0.5094443 0.9755148 0.7268407
14_11713 0.3853707 1.4562803 0.5352892 0.0000000 0.0000000 0.0000000
2_19980 0.3853707 0.7281401 0.7137189 0.0000000 0.0000000 0.0000000
3_22367 3.2756510 0.3640701 1.9627271 0.1698148 0.3902059 0.2907363
mmu-miR-137-5p 1.9268536 1.0922102 0.7137189 0.1698148 0.1951030 0.1453681
mmu-miR-196a-5p 0.3853707 0.0000000 0.0000000 0.3396296 3.9020591 3.1980993
mmu-miR-216b-3p 3.2756510 1.8203504 1.4274379 0.5094443 1.3657207 0.0000000
mmu-miR-302b-3p 0.3853707 0.7281401 0.3568595 5.0944433 1.3657207 6.5415667
mmu-miR-34b-3p 31.4077130 17.4753634 26.2291712 7.6416650 9.1698389 4.7971489
mmu-miR-34c-3p 13.6806603 8.0095415 10.8842139 3.3962956 3.5118532 1.5990496
mmu-miR-34c-5p 483.0621865 267.9555718 693.9132443 164.5505198 158.6187023 138.3904780
mmu-miR-465b-5p 8.8635264 2.5484905 7.1371895 2.0377773 0.9755148 1.8897859
mmu-miR-470-5p 7.5147289 4.0047708 4.9960326 3.2264808 0.3902059 1.1629452
mmu-miR-668-3p 22.7368720 32.7663063 36.2212365 8.1511093 11.3159714 11.4840838
mmu-miR-741-3p 10.2123239 3.6407007 5.3528921 1.0188887 0.7804118 1.5990496
mmu-miR-871-3p 10.2123239 1.4562803 6.4234705 2.2075921 0.5853089 1.3083133
mmu-miR-880-3p 0.5780561 0.0000000 0.5352892 0.0000000 0.0000000 0.0000000
[image:15.595.45.551.269.578.2]