ARTICLES
Mark J. Bolland, MBChB, PhD Alison Avenell, MBBS,
MD
Greg D. Gamble, MSc Andrew Grey, MD
Correspondence to Dr. Bolland:
Editorial, page 2388
Supplemental data at Neurology.org
Systematic review and statistical analysis of
the integrity of 33 randomized controlled
trials
ABSTRACT
Background:Statistical techniques can investigate data integrity in randomized controlled trials (RCTs). We systematically reviewed and analyzed all human RCTs undertaken by a group of re-searchers, about which concerns have been raised.
Methods: We compared observed distributions ofp values for between-groups differences in baseline variables, for standardized sample means for continuous baseline variables, and for differences in treatment group participant numbers with the expected distributions. We assessed productivity, recruitment rates, outcome data, textual consistency, and ethical oversight.
Results:The researchers were remarkably productive, publishing 33 RCTs over 15 years involv-ing large numbers of older patients with substantial comorbidity, recruited over very short peri-ods. Treatment groups were improbably similar. The distribution ofpvalues for differences in baseline characteristics differed markedly from the expected uniform distribution (p5 5.23 10282). The distribution of standardized sample means for baseline continuous variables and the differences between participant numbers in randomized groups also differed markedly from the expected distributions (p 5 4.3 3 1024, p 5 1.53 1025, respectively). Outcomes were remarkably positive, with very low mortality and study withdrawals despite substantial comor-bidity. There were very large reductions in hip fracture incidence, regardless of intervention (relative risk 0.22, 95% confidence interval 0.15–0.31, p , 0.0001, range of relative risk 0.10–0.33), that greatly exceed those reported in meta-analyses of other trials. There were multiple examples of inconsistencies between and within trials, errors in reported data, mislead-ing text, duplicated data and text, and uncertainties about ethical oversight.
Conclusions: A systematic approach using statistical techniques to assess randomization out-comes can evaluate data integrity, in this case suggesting these RCT results may be unreliable.
Neurology®2016;87:2391–2402
GLOSSARY
RCT5randomized controlled trial.
Investigating concerns about the integrity of data from biomedical research is difficult.
1One
approach is to use statistical techniques to compare the observed distributions of baseline variables
from a group of randomized controlled trials (RCTs) for which concerns about data integrity exist,
with the expected distributions that would arise if treatment allocation occurred by chance. This
approach was previously used to identify a case of fraudulent data involving at least 168 RCTs.
2Meta-analysts may identify concerns about data integrity during their careful review of large
numbers of publications. While undertaking systematic reviews in osteoporosis, we considered
RCTs by Yoshihiro Sato et al. (
“
the researchers
”
) for inclusion. This group of authors has
published a very large number of RCTs (appendix e-1, table e-1A, references A1
–
A33 at
Neurology.org) that collectively have substantially influenced relevant systematic reviews.
Dr. Sato is the first author on 79% of these trials and holds primary oversight of the majority
of these publications. Questions had been raised in journal correspondence regarding some of
these papers,
3–7and we had additional concerns about aspects of a number of papers identified
From the Department of Medicine (M.J.B., G.D.G., A.G.), University of Auckland, New Zealand; and Health Services Research Unit (A.A.), University of Aberdeen, Foresterhill, Scotland.
for our reviews. We wondered whether the
statistical techniques previously used for
com-paring distributions of baseline variables
2could be applied to a systematic review of
RCTs from the researchers that included 3
papers published in
Neurology
®(A9, A17,
A23, which have been retracted; for a full list
of papers in this study retracted to date, see
table e-1B.). In addition, we assessed some
other potentially relevant aspects of the body
of RCTs including the researchers
’
productiv-ity and recruitment rates, outcome data,
tex-tual consistency within and between RCTs,
and ethical oversight.
METHODS In November 2012, we searched MEDLINE and Embase for all RCTs with Y. Sato or Yoshihiro Sato listed as an author, published in English or Japanese. Two hundred fifty-three potentially relevant publications were identified. After excluding unrelated articles and articles by other individuals with the same name, we identified 33 RCTs in humans (table e-1A). For each report, we extracted data on study design, ethical approval, randomization, baseline characteristics, and outcomes, and identified inconsistencies in reporting of methods and results. Halbekath et al.6suggested that“baseline data indicate that
the study groups are strikingly well matched”in many RCTs reported by the researchers,6who responded that this occurred
“not by design but by chance.”Since allocation of participants in an RCT is random, comparisons between randomized groups for independent variables at baseline should produce a uniform dis-tribution ofpvalues; for example, there is an equal likelihood of apvalue of,0.1 and.0.9, of,0.2 and.0.8, etc. Baseline variables within an RCT are not always independent and may be correlated. However, this interdependence is unlikely to translate into substantial between-group similarities where simple random-ization is used. Clustering of thepvalues for differences between groups may not occur in the same direction or to the same degree in other trials. Since any differences between groups are attribut-able to chance, if there is consistent clustering of variattribut-ables in multiple trials, the distribution ofpvalues across multiple trials from a group of clustered variables should still be approximately uniform. Therefore, across a body of RCTs, clustering is unlikely to affect the distribution ofpvalues markedly. We compared the observed distribution ofpvalues in deciles for all baseline com-parisons with the expected distribution using thex2test (Excel
2007; Microsoft, Redmond, WA). We used reportedpvalues from the papers, and when these were not reported, we calculated
pvalues from the reported summary data (mean, SD, or percent-age) usingttests or 1-way analysis of variance for continuous variables and x2 or Fisher exact test for categorical variables
(OpenEpi version 2.3.1, www.OpenEpi.com).
We undertook a complementary analysis to assess the sam-pling distribution of continuous variables. The central limit the-orem states that if a population is repeatedly sampled, the means of these samples are approximately normally distributed. The mean of the sample means (x) approximates the population mean (m) and the SD of the sample means is the standard error of the mean (which is the population SD/On). Any normal distribution curve can be standardized to produce a curve with mean 0 and SD 1 using the formula (x2m)/SD. A randomized group in an RCT can be considered as a random sample from the entire trial
population. We calculated the trial population mean and SD for each baseline continuous variable from the summary data pre-sented in the trial report. We then selected the control group (or the first presented treatment group when only active treatments were compared) and standardized the sample mean ([x 2
m]/SEM). We tested whether the distribution of these standard-ized sample means differed from the expected distribution (stan-dardized SD of 1) using anFtest for the equality of variance (Excel 2007), in an approach similar to that used by Carlisle.2
We assembled a dataset of 13 RCTs8–20conducted by the
Auckland Bone and Joint Research Group (table e-2) as a matched control group of trials that were similarly sized to the RCTs of interest, conducted over a similar time frame, and also focus on the prevention or treatment of osteoporosis in older people. We compared the distributions ofpvalues and standardized sample means between this control dataset and the dataset of interest. Bootstrap resampling was used to account for ignorance of the dependence structure between differences in baseline variables and single group variance structures. We randomly selected between 350 and 450 baselinepvalues (with replacement) and between 250 and 350 baseline standardized sample means (with replacement) from both datasets, performed 2-sample Kolmogorov–Smirnov tests on these values (SAS v9.4; SAS Institute Inc., Cary, NC), and repeated this 1,000 times.
In a trial with simple randomization, the proportion of partic-ipants in each group is determined by chance, and thus the num-bers of participants in the randomized groups in a set of trials will be binomially distributed.21,22For a 2-arm trial with 2
partici-pants, the probability of equal number of participants in each group (i.e., one) is 50%, for 4 participants is 37.5%, for 10 participants is 25%, and for 50 participants is 11%. For block randomization, the number of participants in each trial arm is equal in each block. Thus, any differences between the size of randomized groups arise from the last block. If the block is filled, the groups will be equal in size. For a block size of 2 or 4 in a 2-arm trial, an odd number of total participants means the groups differ by one. For a block size of 4, 2 participants in the final block gives a 2/3 probability the groups are equal in size, and a 1/3 probability that they differ by 2 participants.22When block
ran-domization is stratified, the same principle applies for each stra-tum. We used the approach of Carlisle2to assess whether the
distribution of differences in numbers of participants between treatment groups in the trials conducted by the researchers is consistent with the binomial distribution.
Hip fracture was the most frequently reported fracture out-come, reported for 23 trials. Using random-effects models, we pooled these outcome data from trials by the researchers and com-pared the results to published contemporaneous meta-analyses of trials from other investigators. Statistical heterogeneity bet-ween trial-level summary data was assessed using the Cochran
Qstatistic (p,0.10) and theI2statistic (I2.50). Analyses
were performed using Comprehensive Meta-Analysis version 2 (Biostat, Englewood, NJ).
publication of RCTs suggests a very large well-funded research network, with access to a very large catchment of patients with substantial comorbidity who, nonetheless, are willing trial participants. Considering these practical requirements, it was surprising that there was no statement regarding funding for 30 of the 33 human RCTs. Furthermore, none of the RCTs contained a statement on trial registration,
although many trials were published before this became customary.
The human RCTs represent remarkable produc-tivity, particularly given the frailty of the participants in several of the trials. For example, in the 5 months between March 2003 and July 2003, the researchers recruited 500 ambulatory female patients older than 70 years with Alzheimer disease living in the
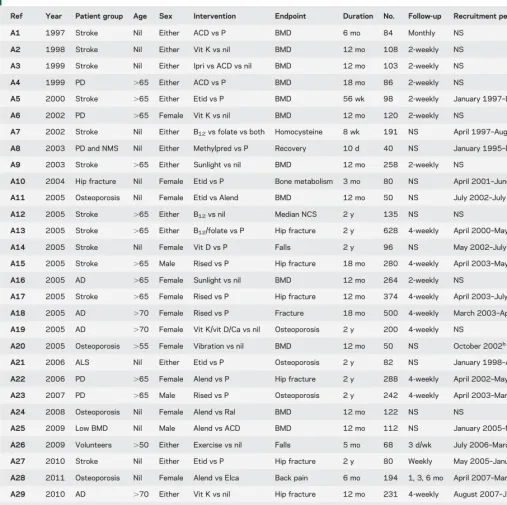
Table 1 Study design of 33 human randomized controlled trials by the researchers
Ref Year Patient group Age Sex Intervention Endpoint Duration No. Follow-up Recruitment period
A1 1997 Stroke Nil Either ACD vs P BMD 6 mo 84 Monthly NS
A2 1998 Stroke Nil Either Vit K vs nil BMD 12 mo 108 2-weekly NS
A3 1999 Stroke Nil Either Ipri vs ACD vs nil BMD 12 mo 103 2-weekly NS
A4 1999 PD .65 Either ACD vs P BMD 18 mo 86 2-weekly NS
A5 2000 Stroke .65 Either Etid vs P BMD 56 wk 98 2-weekly January 1997–December 1998
A6 2002 PD .65 Female Vit K vs nil BMD 12 mo 120 2-weekly NS
A7 2002 Stroke Nil Either B12vs folate vs both Homocysteine 8 wk 191 NS April 1997–August 2000
A8 2003 PD and NMS Nil Either Methylpred vs P Recovery 10 d 40 NS January 1995–December 1997
A9 2003 Stroke .65 Either Sunlight vs nil BMD 12 mo 258 2-weekly NS
A10 2004 Hip fracture Nil Female Etid vs P Bone metabolism 3 mo 80 NS April 2001–June 2002
A11 2005 Osteoporosis Nil Female Etid vs Alend BMD 12 mo 50 NS July 2002–July 2003a
A12 2005 Stroke .65 Either B12vs nil Median NCS 2 y 135 NS NS
A13 2005 Stroke .65 Either B12/folate vs P Hip fracture 2 y 628 4-weekly April 2000–May 2001b
A14 2005 Stroke Nil Female Vit D vs P Falls 2 y 96 NS May 2002–July 2002b
A15 2005 Stroke .65 Male Rised vs P Hip fracture 18 mo 280 4-weekly April 2003–May 2003a
A16 2005 AD .65 Female Sunlight vs nil BMD 12 mo 264 2-weekly NS
A17 2005 Stroke .65 Female Rised vs P Hip fracture 12 mo 374 4-weekly April 2003–July 2003a
A18 2005 AD .70 Female Rised vs P Fracture 18 mo 500 4-weekly March 2003–April 2003a
A19 2005 AD .70 Female Vit K/vit D/Ca vs nil Osteoporosis 2 y 200 4-weekly NS
A20 2005 Osteoporosis .55 Female Vibration vs nil BMD 12 mo 50 NS October 2002b
A21 2006 ALS Nil Either Etid vs P Osteoporosis 2 y 82 NS January 1998–August 2002
A22 2006 PD .65 Female Alend vs P Hip fracture 2 y 288 4-weekly April 2002–May 2002
A23 2007 PD .65 Male Rised vs P Osteoporosis 2 y 242 4-weekly April 2003–March 2004a
A24 2008 Osteoporosis Nil Female Alend vs Ral BMD 12 mo 122 NS NS
A25 2009 Low BMD Nil Male Alend vs ACD BMD 12 mo 112 NS January 2005–March 2007
A26 2009 Volunteers .50 Either Exercise vs nil Falls 5 mo 68 3 d/wk July 2006–March 2007
A27 2010 Stroke Nil Either Etid vs P Hip fracture 2 y 80 Weekly May 2005–January 2007
A28 2011 Osteoporosis Nil Female Alend vs Elca Back pain 6 mo 194 1, 3, 6 mo April 2007–March 2008
A29 2010 AD .70 Either Vit K vs nil Hip fracture 12 mo 231 4-weekly August 2007–July 2008
A30 2011 PD Nil Female Rised vs P Hip fracture 2 y 272 4-weekly January 2007–June 2007
A31 2011 PD .65 Either Sunlight vs nil Hip fracture 2 y 324 2-weekly NS
A32 2011 Stroke Nil Either Alend vs ACD Falls 12 mo 82 NS October 2007–December 2008
A33 2012 Osteoporosis .50 Female Vibration vs nil Physical function 6 mo 52 2 d/wk October 2009–September 2010
Abbreviations: ACD5alphacalcidiol; AD5Alzheimer disease; Age5age restriction; Alend5alendronate; ALS5amyotrophic lateral sclerosis; B125 vitamin B12; BMD5bone mineral density; Ca5calcium; Elca5elcatonin; Etid5etidronate; Ipri5ipriflavone; Methylpred5methylprednisolone; NCS5 nerve conduction studies; NMS5neuroleptic malignant syndrome; NS5not stated; P5placebo; PD5Parkinson disease; Ral5raloxifene; Ref5
reference; Rised5risedronate; Vit5vitamin.
community in 2 months (A18), 280 male patients older than 65 years with hemiplegic stroke in 2 months (A15), and 374 female patients older than 65 years with acute hemiplegic stroke in 4 months (A17). Compounding the workload of recruiting for these 3 trials, participants were also reviewed every 4 weeks, and during this period, there was also ongo-ing intensive follow-up in 3 trials involvongo-ing 774 par-ticipants (A13, A14, A20) and recruitment and intensive follow-up for 2 other trials involving 292 participants (A11, A23). Despite the high workload required to conduct clinical trials on such a scale, 4 of these 8 trials listed only the same 4 coauthors (A14, A15, A17, A18), and only one additional coau-thor was listed for 2 of these trials (A13, A23). How-ever, the recentJournal of Bone and Mineral Research retraction notice for one paper (A16) states that the coauthors of Dr. Sato“are named as such for honor-ary reasons and are not responsible for the content of the manuscript.”23Two of the 3 papers inNeurology
reported details on potential participant eligibility. In one,,10% of potential participants were ineligible despite very restrictive inclusion criteria (A9). In both, .85% of people approached were enrolled (A9, A23).
Neuroleptic malignant syndrome can rarely occur following reduction or withdrawal of levodopa the-rapy. The researchers identified 40 patients with Parkinson disease with this syndrome over 3 years in a single institution, Futase Social Insurance Hospi-tal, which has only 55 inpatient beds and 4 clinicians (http://futase-hp.jp/about/outline.php) (A8). A cor-respondent found this astonishing because clinicians at their institution, which has a special interest in Parkinson disease, could only“recall 2 such cases in living memory.”3Correspondents also expressed
dis-belief at the recruitment rate in the female stroke trial (A17) because, in their experience,,10% of stroke admissions would meet the eligibility criteria.4
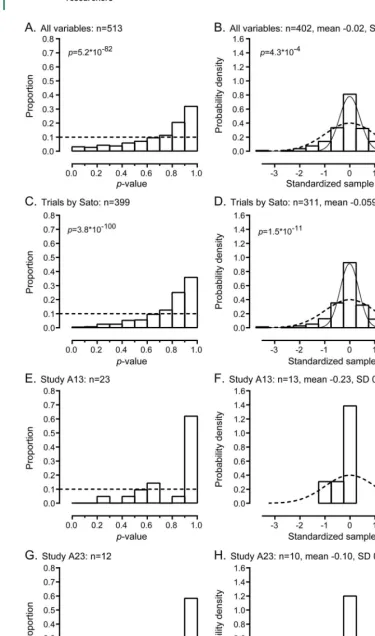
Improbably similar randomized treatment groups.In 32 human RCTs, baseline data for all participants in all randomized groups were presented for 513 variables; data were only presented for study completers in one RCT (A1). Figure 1A shows the distribution of p values for between-groups comparisons of these 513 variables. Of note, 52% ofpvalues were.0.8, while only 6%, 14%, and 27% ofpvalues were,0.2,
,0.4, and ,0.6, respectively. This distribution is highly unlikely to have arisen by chance (p55.23 10282). In the 25 RCTs with Y. Sato as the first
author, the distribution of p values differed significantly from the expected distribution (p 5 3.8 3 102100) (figure 1C). Figure 1B shows the
distribution of the standardized sample means for 402 baseline continuous variables. The SD of these
standardized sample means was 0.84, and the distribution differed markedly from the expected distribution (p 5 4.3 3 1024), with values
clustered more tightly around the mean than expected. Figure 1D shows that in the 25 RCTs with Y. Sato as the first author, the distribution of standardized sample means differed from the expected distribution with values clustered tightly around the mean (p51.5310211).
The distribution of p values from 918 baseline variables from 13 RCTs in the control dataset was consistent with the expected independent uniform distribution (p5 0.07, figure e-1), and the SD of the standardized sample means from 726 baseline variables was 1.02, also consistent with the expected distribution (p 5 0.78). However, comparison of baselinepvalues and standardized sample means from the RCTs of interest and the control RCTs using bootstrap resampling showed marked differences in distributions (baseline p values: p , 0.001 in all 1,000 comparisons; standardized sample means: medianpvalue 631024, 95% confidence interval
231027to 0.021).
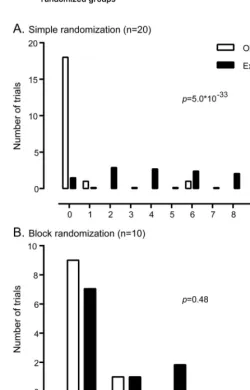
Table 2 shows that the numbers of participants in each treatment group were the same in 27 of 30 two-arm RCTs. For all 33 trials, randomization in blocks was stated specifically for 10 RCTs, using computer-generated random numbers for 13 RCTs, no details were reported for 9 RCTs, and one trial was pseudor-andomized using alternate allocation. Four trials that used block randomization were stratified by site, and for one trial, participant numbers by site were re-ported in correspondence about the paper (A18). For another 2 trials (A13, A15), stratified randomi-zation was not described, but multiple sites and par-ticipant numbers by site were reported in corrections or correspondence about the papers. We assumed randomization was stratified by site for these 2 trials. Figure 2 shows that the distribution of differences in participant numbers between the treatment groups differs from the expected distribution (p 5 5 3 10233) in 20 two-arm RCTs presumed to use simple
randomization (i.e., unless block randomization was stated). For the 10 RCTs that used block randomi-zation, the observed distribution of differences was consistent with the expected distribution (p 5 0.48). When all 30 two-arm trials were considered, the observed distribution of differences differed from the expected distribution (p51.531025). Finally,
Figure 1 Distribution ofpvalues and standardized sample means in 32 randomized controlled trials by the researchers
(A, C, E, G) The observed vs expected distribution ofpvalues by decile in 32 randomized controlled trials for all baseline variables (A), in 25 trials with Y. Sato as first author (C), and as illustrative examples, for all baseline variables in study A13,
distribution. The expected number of trials with equal participants is 22/30 and with a difference of 2 participants is 5/30, whereas the observed number of trials was 27 and 0, respectively (p50.04).
The results of these separate but complementary analyses strongly suggest there has been a systematic failure of randomization in these trials because the randomized groups are much more similar than would be expected by chance, if randomization had occurred successfully.
Remarkably positive outcomes.The outcomes reported by the researchers are generally extremely positive and inconsistent with contemporaneous literature. Despite studying frail elderly individuals with sub-stantial comorbidity, table 2 shows that participant withdrawals from the trials were few in number and very well matched between treatment groups. In fact, only 519 participants (8.8%) did not complete the trials, which is surprising because participants had very high rates of hip fracture (table 2) and substantial background comorbidity, both of which are associ-ated with high mortality.
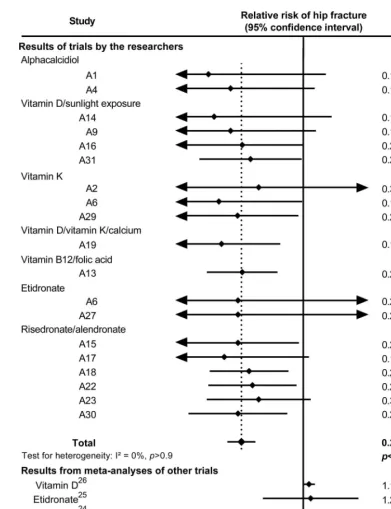
Figure 3 shows the observed reductions in hip fracture in RCTs with a control group that received either placebo or no treatment for the various treat-ments studied by the researchers. There were consis-tent and substantial reductions in hip fracture incidence regardless of the treatment studied (relative risk 0.22, 95% confidence interval 0.15–0.31, p, 0.0001, range of relative risk 0.10–0.33) with very little statistical heterogeneity between the results. This lack of heterogeneity is very surprising given the relatively large numbers of agents and the diver-sity of the populations studied. Furthermore, figure 3 also shows that the magnitude of these reductions is substantially greater than those observed in meta-analyses of other trials for these agents,24–26and the
confidence intervals around the pooled result for the researchers’trials do not overlap the confidence inter-vals around the pooled results for trials conducted by other investigators. Thus, the very positive results of the trials by the researchers are inconsistent with re-sults from other groups.
Logical and other inconsistencies.There are a number of inconsistent results between trials conducted by the researchers. For example, in a trial in Alzheimer disease (A29), the control group received risedronate
and calcium and had a hip fracture rate of 86/1,000 patient-years. Yet, the active treatment arm of another trial in patients with Alzheimer disease (A18) who received risedronate, calcium, and vitamin D had a hip fracture rate of 15/1,000 patient-years. Similarly, trials in Parkinson disease in which the control group received placebo plus vitamin D reported very high rates of hip fracture (49, 37, and 55/1,000 patient-years) (A22, A23, A30) but when sunlight exposure was used as the active treatment arm to improve vitamin D status, the hip fracture rate was only 9/1,000 patient-years (A31). Likewise, when vitamin D was used in the placebo arm of trials, bone density decreased substantially by 0.9% to 3.2% (A18, A22, A23, A30), whereas when sunlight exposure was studied as active treatment, bone mineral density increased by 2.7% to 3.8% (A16, A31).
There are also inconsistencies within trials. For example, in oneNeurologypaper (A9), the authors state that 109 participants were randomized to one group and 108 to the other. However, the partici-pant flow diagram shows 129 participartici-pants in each group with 109 and 108, respectively, completing the trial. In one study (A22) it is stated that random-ization was performed by one of the authors“(J.I.),” and in the same paragraph, it is stated that“ follow-up assessment of patient’s condition was performed by physicians (Y.S., J.I.) who did not participate in the initial randomization.”In one study (A29), it is stated that randomization was stratified by site, yet only one site was mentioned in the methods section. In another study (A15), participants were eligible for inclusion if they had sustained a stroke at least 3 months before the study began, but the mean dura-tion of illness at baseline in both randomized groups was 90 days, or slightly less than 3 months, which appears implausible.
There are also errors in the reported outcome data. In 14 RCTs, rates of hip fracture per 1,000 patient-years are reported (table 2). For 11 of these trials, the reported rates can simply be calculated with the equation: rate 5 number with hip frac-ture/(participants3 duration of trial). These rates are not correct because they do not account for loss to follow-up or censoring of participants who have sustained a hip fracture. Data on adverse events are also misreported. For example, in 2 of the 3
Figure 1 legend, continued:
the subject of the recent expression of concern from theJournal of the American Medical Association27(E), and study A23,
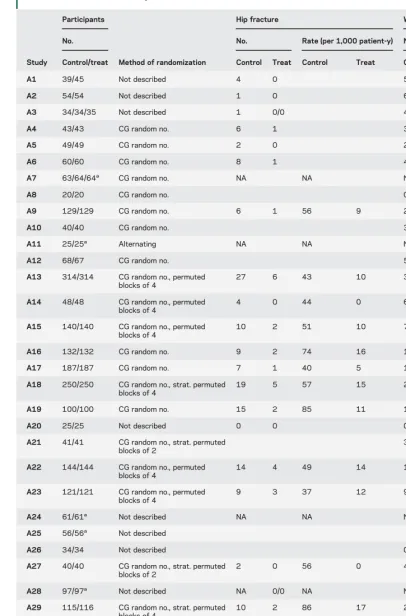
Table 2 Participant numbers, randomization methods, hip fractures, and withdrawals in 33 randomized controlled trials by the researchers
Study
Participants
Method of randomization
Hip fracture Withdrawals
No. No. Rate (per 1,000 patient-y) No.
Control/treat Control Treat Control Treat Control Treat
A1 39/45 Not described 4 0 5 15
A2 54/54 Not described 1 0 6 3
A3 34/34/35 Not described 1 0/0 4 3/2
A4 43/43 CG random no. 6 1 3 3
A5 49/49 CG random no. 2 0 2 3
A6 60/60 CG random no. 8 1 4 6
A7 63/64/64a CG random no. NA NA NA 0/0/0
A8 20/20 CG random no. 0 0
A9 129/129 CG random no. 6 1 56 9 21 20
A10 40/40 CG random no. 3 4
A11 25/25a Alternating NA NA NA 0/0
A12 68/67 CG random no. 5 6
A13 314/314 CG random no., permuted blocks of 4
27 6 43 10 36 33
A14 48/48 CG random no., permuted blocks of 4
4 0 44 0 6 5
A15 140/140 CG random no., permuted blocks of 4
10 2 51 10 7 6
A16 132/132 CG random no. 9 2 74 16 11 10
A17 187/187 CG random no. 7 1 40 5 14 15
A18 250/250 CG random no., strat. permuted blocks of 4
19 5 57 15 20 19
A19 100/100 CG random no. 15 2 85 11 12 10
A20 25/25 Not described 0 0 0 0
A21 41/41 CG random no., strat. permuted blocks of 2
3 4
A22 144/144 CG random no., permuted blocks of 4
14 4 49 14 15 13
A23 121/121 CG random no., permuted blocks of 4
9 3 37 12 9 10
A24 61/61a Not described NA NA NA 9/11
A25 56/56a Not described 14/11
A26 34/34 Not described 0 1
A27 40/40 CG random no., strat. permuted blocks of 2
2 0 56 0 4 3
A28 97/97a Not described NA 0/0 NA NA 1/0
A29 115/116 CG random no., strat. permuted blocks of 4
10 2 86 17 27 23
A30 136/136 CG random no., permuted blocks of 4
15 3 55 11 12 10
A31 162/162 CG random no. 11 3 34 9 8 6
A32 41/41a CG random no. NA 1/0 NA NA 1/2
A33 26/26 Not described 0 0
Abbreviations: CG5computer generated; NA5not applicable as there was no control group; strat.5stratified by site. Blanks indicate data not reported by the researchers.
Neurologypapers, it was stated that no adverse events (A17) or no serious adverse events (A23) occurred during the trial. However in A17, 10 participants withdrew because of death or intercurrent illness, 87 experienced at least one fall, and 8 had a hip fracture. Likewise, in A23, 7 participants withdrew because of death or intercurrent illness, 12 had a hip fracture, and there was an average of 1.5 falls per participant during the trial.
Misleading text.In one study (A13), the researchers claimed to have recruited 628 trial participants from a single site. In a later correction, they stated that there were 3 additional unnamed hospitals and that the originally stated site actually recruited only 53 of 628 participants, the smallest number by some degree. Similarly, in 2 studies (A15, A18), the re-searchers claimed to have recruited 280 male patients
with stroke and 500 patients with Alzheimer disease, respectively, from a single site. In a later correction, they stated that there were 2 additional unnamed hospitals. The researchers stated that the reason for this misinformation was that “these hospitals were reluctant to have their names in the article.” Given the large size and intensive nature of these trials, and the absence of statements regarding fund-ing, we presume the trials were effectively funded by the hospitals involved, with substantial trial input from other unnamed hospital staff. It is hard to understand why the hospital and its staff would not accept any recognition of their substantial contributions.
Duplicate data and text.There are examples of strik-ingly similar text in the reports, including duplicate outcome data. Table 3 shows that the reported mean and SD for fall rates were identical in 3 stud-ies (A4, A6, A9) for both the treatment and control groups, and another study (A19) had identical SD to the earlier studies but the mean differed by l unit for both the treatment and control groups. Later, these data were altered without explanation in cor-rections for 2 of these trials (A6, A9). Duplicated text is also apparent when logical errors arise. Table 3 shows an example of 2 studies with iden-tical exclusion criteria, but one criterion does not make sense for one trial because it only applies to women, but only men were eligible to participate in the trial. Some examples of duplicated text are extensive. The majority of the text in one article (A16) is identical or nearly identical to that of a later article (A31) (table e-3).
Ethical oversight.In the 33 RCTs, the ethics commit-tee that approved the research was usually listed as the institutional or local ethics committee (22 stud-ies). By using all the published information regard-ing the ethics committee approval and the location of the study, it appears that ethical approval was granted by the ethics committee of Futase Social Insurance Hospital in 11 RCTs, Mitate Hospital for 10 RCTs, Keiyu Orthopaedic Hospital for 5 RCTs, multiple hospital committees in 2 RCTs, and in 5 RCTs, the committee could not be identi-fied. We searched the internet for “ethics” and
“Mitate Hospital” or “Futase” and were unable to identify any studies performed by other groups approved by either of these ethics committees. With only 4 clinicians practicing at Futase Hospital, it seems likely that members of the Futase Hospital ethics committee had at least some clinical relation-ships with at least some of the coauthors of the papers by the researchers. In fact, in at least 6 studies (A9, A16, A17, A21, A27, A31), the chairperson of the ethics committee appeared to be involved with the
Figure 2 Distribution of differences in participant numbers between randomized groups
conduct of the study as this person is reported to have performed the randomization and allocation of par-ticipants to treatment groups.
DISCUSSION Our systematic review and application of established methods to examine data integrity to
the 33 human RCTs published by the researchers rai-ses serious concerns about the integrity and validity of the reported results. Objective evidence for these con-cerns is provided by the statistical analyses, which demonstrate a systematic failure of randomization, and the consistently outlying outcome data when
Figure 3 Relative risk of hip fracture in randomized controlled trials by the researchers
Meta-analysis showing a 78% reduction in relative risk (p,0.0001) of hip fracture in 19 randomized controlled trials by the researchers with a control group that received either a placebo or no treatment. For comparison, the results for agents in meta-analyses of other trials are shown.24–26There are insufficient data for hip fracture outcomes from trials of
alpha-calcidiol,26B
12/folate, or vitamin K by other investigators, but vitamin K is reported to have no effect on bone density29or vertebral fracture risk.30There was a statistically significant (p,0.05) interaction between the risk of hip fracture in the
compared to those from other researchers. Taken together with the implausible productivity of the group, internal inconsistencies for outcome data in their work, duplication of data, numerous misleading statements and errors, and concerns regarding ethical oversight, our analysis suggests that the results of at least some of these trials are not reliable. Recently, theJournal of the American Medical Association has issued an expression of concern about one trial (A13), and theJournal of Bone and Mineral Research an expression of concern followed by retraction of another trial (A16), both precipitated by our concerns.23,27,28
Two issues arise from our analyses of distribution ofpvalues and standardized sample means for con-sidering the success or failure of randomization. There will be differences inpvalues and standard-ized sample means calculated from published sum-mary data compared to values calculated from raw data because of rounding of variables. However, any differences would be small and could not explain the marked departure from the expected distributions that we found. A second issue is that some of the baseline variables may not be independent. For example, if by chance, one randomized group is old-er than the othold-er, this group may have similar diffold-er- differ-ences in variables correlated with age, such as bone mineral density. This could lead to clustering ofpvalues and standardized means within an indi-vidual RCT. However, clustering may not occur in the same direction or magnitude in other trials. Since any differences between groups are attributed to chance, consistent clustering of variables should still produce an approximately uniform distribution of p values of between-groups comparisons from a group of clustered baseline variables across multi-ple trials. Therefore, clustering of results from indi-vidual RCTs is unlikely to affect the analysis of
a body of RCTs markedly. However, results from individual RCTs or small differences from expected variations for a body of RCTs should be interpreted cautiously.
Previously, Carlisle analyzed the distribution of standardized sample means from 168 RCTs published by an individual author, the integrity of whose work had been questioned, along with data from 366 RCTs from other authors.2 He reported that the observed
distribution of standardized sample means for weight, height, and age from the 366 control RCTs were con-sistent with expected (range of standardized SD 0.93– 1.06), whereas the distributions of sample means from the 168 RCTs of interest were not (range SD 0.55– 0.62). Similarly, pooling all continuous variables pro-duced a distribution similar to expected for the 366 RCTs from other authors, whereas the distribution was markedly different to expected for the variables from the 168 RCTs of interest.2The results of our analyses
of the data from the researchers were similar to the results of Carlisle’s analysis, with observed distributions of sample means markedly different to expected. A limitation of this work, and the previous work by Carlisle, is that the statistical theory underpinning the methods used has not been fully developed.
In summary, statistical techniques, such as those used in this report and similar approaches used previ-ously by Carlisle,2 that involve comparisons of the
observed distributions of baselinepvalues or baseline variables in RCTs with the expected distributions may be useful when considering or investigating the integrity of a group of RCTs.
AUTHOR CONTRIBUTIONS
Mark Bolland: drafting/revising manuscript, study concept or design, analysis or interpretation of data, acquisition of data, statistical analysis. Alison Avenell: drafting/revising manuscript, study concept or design, analysis or interpretation of data. Greg Gamble: drafting/revising manu-script, study concept or design, analysis or interpretation of data,
Table 3 Examples of duplication of text in articles by the researchers
Article Text Article Comparative text Comment
A4 Falls rate (mean, SD): treatment group 1.3 (1.9), control group 1.4 (1.8)
A6, A9 Treatment group 1.3 (1.9), control group 1.4 (1.8)
A19 Treatment group 2.3 (1.9), control group 2.4 (1.8)
A22 Patients with impairment of renal, hepatic, cardiac, or thyroid function or those who had known causes of osteoporosis, such as primary hyperparathyroidism or renal osteodystrophy, were excluded from this study. Patients were excluded if they had been treated with corticosteroids,estrogens, calcitonin,
bisphosphonate, calcium, or vitamins D and K for 3 months or more during the 12 mo preceding the study; and those who had been administered these agents for even a brief period during the preceding 2 mo were also excluded.
A23 Patients with impairment of renal, hepatic, cardiac, or thyroid function or those who had known causes of osteoporosis, such as primary hyperparathyroidism or renal osteodystrophy, were excluded from this study. Patients were excluded if they had been treated with corticosteroids,estrogens, calcitonin,
bisphosphonate, calcium, or vitamins D and K for 3 mo or more during the 12 mo preceding the study; and those who had been administered these agents for even a brief period during the preceding 2 mo were also excluded.
Trial A23 was restricted to men. The exclusion criterion regarding estrogen treatment does not make sense in context of elderly males with Parkinson disease.
A16 A31 The highlighted text in A16 is identical or
statistical analysis. Andrew Grey: drafting/revising manuscript, study con-cept or design, analysis or interpretation of data. Dr. Bolland has full responsibility for the data, the analyses and interpretation, and the con-duct of the research, has full access to all of the data, and has the right to publish any and all data, separate and apart from the guidance of any sponsor.
ACKNOWLEDGMENT
The authors are grateful to Bill Gillespie (Hull York Medical School, UK), Lesley Gillespie (University of Otago, New Zealand), and David Torgerson (University of York, UK) for earlier discussions regarding these trials. The authors are also grateful for the assistance of Fiona Stewart (Information Specialist) and Mari Imamura (Research Fellow and native Japanese speaker) from the University of Aberdeen. The authors thank Doug Altman and anonymous referees for their comments on previous drafts of this report.
STUDY FUNDING
Funded by the Health Research Council of New Zealand. The Health Services Research Unit is core funded by the Chief Scientist Office of the Scottish Government Health and Social Care Director-ate. Role of the funding source: the sponsors of the study had no role in design and conduct of the study; collection, management, analysis, and interpretation of the data; and preparation, review, or approval of the manuscript.
DISCLOSURE
The authors report no disclosures relevant to the manuscript. Go to Neurology.org for full disclosures.
Received December 4, 2015. Accepted in final form August 24, 2016.
REFERENCES
1. Yentis SM. Lies, damn lies, and statistics. Anaesthesia 2012;67:455–456.
2. Carlisle JB. The analysis of 168 randomised controlled trials to test data integrity. Anaesthesia 2012;67:521–537. 3. Clarke CE. Efficacy of methyprednisolone pulse therapy on neuroleptic malignant syndrome in Parkinson’s disease. J Neurol Neurosurg Psychiatry 2004;75:510–511; author reply 511.
4. Poole KE, Warburton EA, Reeve J. Risedronate therapy for prevention of hip fracture after stroke in elderly women. Neurology 2005;65:1513–1514; author reply 1513–1514.
5. Caffrey N, Casey M, Walsh B. Substandard studies or substandard“standard-of-care.”J Bone Miner Res 2006; 21:491; author reply 492.
6. Halbekath JM, Schenk S, von Maxen A, Meyer G, Muhlhauser I. Risedronate for the prevention of hip frac-tures: concern about validity of trials. Arch Intern Med 2007;167:513–514; author reply 514–515.
7. Gotzsche PC, Hrobjartsson A, Maric K, Tendal B. Data extraction errors in meta-analyses that use standardized mean differences. JAMA 2007;298:430–437.
8. Reid IR, Ames RW, Evans MC, Gamble GD, Sharpe SJ. Effect of calcium supplementation on bone loss in post-menopausal women. N Engl J Med 1993;328:460–464. 9. Reid IR, Ames RW, Orr-Walker BJ, et al.
Hydrochloro-thiazide reduces loss of cortical bone in normal postmen-opausal women: a randomized controlled trial. Am J Med 2000;109:362–370.
10. Reid IR, Lucas J, Wattie D, et al. Effects of a beta-blocker on bone turnover in normal postmenopausal women: a randomized controlled trial. J Clin Endocrinol Metab 2005;90:5212–5216.
11. Reid IR, Mason B, Horne A, et al. Randomized controlled trial of calcium in healthy older women. Am J Med 2006; 119:777–785.
12. Bolland MJ, Grey AB, Horne AM, et al. Annual zoledro-nate increases bone density in highly active antiretroviral therapy-treated human immunodeficiency virus-infected men: a randomized controlled trial. J Clin Endocrinol Metab 2007;92:1283–1288.
13. Grey A, Bolland M, Gamble G, et al. The peroxisome proliferator-activated receptor-gamma agonist rosiglita-zone decreases bone formation and bone mineral den-sity in healthy postmenopausal women: a randomized, controlled trial. J Clin Endocrinol Metab 2007;92: 1305–1310.
14. Reid IR, Cundy T, Grey AB, et al. Addition of mono-fluorophosphate to estrogen therapy in postmenopausal osteoporosis: a randomized controlled trial. J Clin Endocrinol Metab 2007;92:2446–2452.
15. Reid IR, Ames R, Mason B, et al. Randomized controlled trial of calcium supplementation in healthy, nonosteopor-otic, older men. Arch Intern Med 2008;168:2276–2282. 16. Grey A, Bolland MJ, Wattie D, Horne A, Gamble G, Reid IR. The antiresorptive effects of a single dose of zoledro-nate persist for two years: a randomized, placebo-controlled trial in osteopenic postmenopausal women. J Clin Endocrinol Metab 2009;94:538–544.
17. Grey A, Bolland M, Wong S, Horne A, Gamble G, Reid IR. Low-dose zoledronate in osteopenic postmenopausal women: a randomized controlled trial. J Clin Endocrinol Metab 2012;97:286–292.
18. Bolland MJ, Wilsher ML, Grey A, et al. Randomised controlled trial of vitamin D supplementation in sarcoid-osis. BMJ Open 2013;3:e003562.
19. Grey A, Garg S, Dray M, et al. Low-dose fluoride in postmenopausal women: a randomized controlled trial. J Clin Endocrinol Metab 2013;98:2301–2307. 20. Grey A, Bolland M, Fenwick S, et al. The skeletal effects
of pioglitazone in type 2 diabetes or impaired glucose tolerance: a randomized controlled trial. Eur J Endocrinol 2014;170:257–264.
21. Altman DG, Dore CJ. Randomisation and baseline com-parisons in clinical trials. Lancet 1990;335:149–153. 22. Altman DG, Bland JM. How to randomise. BMJ 1999;
319:703–704.
23. Sato Y, Iwamoto J, Kanoko T, Satoh K. Retraction:“ ame-lioration of osteoporosis and hypovitaminosis D by sun-light exposure in hospitalized elderly women with Alzheimer’s disease: a randomized controlled trial.”J Bone Miner Res 2015;30:2328.
24. Stevenson M, Jones ML, De Nigris E, Brewer N, Davis S, Oakley J. A systematic review and economic evaluation of alendronate, etidronate, risedronate, raloxifene and teri-paratide for the prevention and treatment of postmeno-pausal osteoporosis. Health Technol Assess 2005;9:1–160. 25. Wells GA, Cranney A, Peterson J, et al. Etidronate for the primary and secondary prevention of osteoporotic fractures in postmenopausal women. Cochrane Database Syst Rev 2008:CD003376.
26. Avenell A, Gillespie WJ, Gillespie LD, O’Connell D. Vitamin D and vitamin D analogues for preventing fractures associated with involutional and post-menopausal osteopo-rosis. Cochrane Database Syst Rev 2009:CD000227. 27. Bauchner H, Fontanarosa PB. Expression of Concern:
fractures in patients with stroke: a randomized controlled trial. JAMA. 2005;293(9):1082–1088. JAMA 2015;313: 1914.
28. Sato Y, Iwamoto J, Kanoko T, Satoh K. Amelioration of osteoporosis and hypovitaminosis D by sunlight exposure in hospitalized elderly women with Alzheimer’s disease: a randomized controlled trial. J Bone Miner Res 2015; 30:1745.
29. Booth SL, Dallal G, Shea MK, Gundberg C, Peterson JW, Dawson-Hughes B. Effect of vitamin K supplementation on bone loss in elderly men and women. J Clin Endocrinol Metab 2008;93:1217–1223.
30. Stevenson M, Lloyd-Jones M, Papaioannou D. Vitamin K to prevent fractures in older women: systematic review and economic evaluation. Health Technol Assess 2009;13:iii– xi, 1–134.
Increasing the Value of YOUR AAN Membership
FREE MOC Benefits Starting January 1, 2015
You asked and we listened. As of January 1, 2015, your robust AAN membership package includes FREE* access to online learning programs designed specifically to help you take the necessary steps toward fulfilling your maintenance of certification (MOC) requirements as mandated by the ABPN:NeuroPISM,NeuroSAE®,NeuroLearnSM.
Learn more atAAN.com/view/MOC
*$0 purchase price excludes Student members and Nurse Practitioner/Physician Assistant members at the lower dues rate. Free access is limited to one course per program at a time.
This Week
’
s
Neurology
®Podcast
Systematic review and statistical analysis of the integrity of 33 randomized controlled trials (see p. 2391)
This podcast begins and closes with Dr. Robert Gross, Editor-in-Chief, briefly discussing highlighted articles from the December 6, 2016, issue ofNeurology. In the second segment, Dr. Ted Burns talks with Dr. Mark Bolland about his paper on the systematic review and statistical analysis of the integrity of 33 randomized controlled trials. Dr. Ted Burns interviews Dr. Neil Garrett about his Nature Neuroscience paper on dishonesty for our “What’s Trending”feature of the week. In the next part of the podcast, Dr. Ted Burns interviews Dr. Carlos Pardo about a Neurology Today® story on Zika virus and
Guillain-Barré syndrome detected in Colombia.
Disclosures can be found at Neurology.org.
At Neurology.org, click on “RSS” in the Neurology Podcast box to listen to the most recent podcast and subscribe to the RSS feed.
DOI 10.1212/WNL.0000000000003387
2016;87;2391-2402 Published Online before print November 9, 2016
Neurology
Mark J. Bolland, Alison Avenell, Greg D. Gamble, et al.
trials
Systematic review and statistical analysis of the integrity of 33 randomized controlled
This information is current as of November 9, 2016
rights reserved. Print ISSN: 0028-3878. Online ISSN: 1526-632X.
1951, it is now a weekly with 48 issues per year. Copyright © 2016 American Academy of Neurology. All ® is the official journal of the American Academy of Neurology. Published continuously since
Services
Updated Information &
http://n.neurology.org/content/87/23/2391.full including high resolution figures, can be found at:
Supplementary Material
387.DC3
http://n.neurology.org/content/suppl/2016/12/05/WNL.0000000000003 387.DC2
http://n.neurology.org/content/suppl/2016/11/09/WNL.0000000000003 387.DC1
http://n.neurology.org/content/suppl/2016/11/09/WNL.0000000000003 Supplementary material can be found at:
References
http://n.neurology.org/content/87/23/2391.full#ref-list-1
This article cites 28 articles, 3 of which you can access for free at:
Citations
http://n.neurology.org/content/87/23/2391.full##otherarticles This article has been cited by 4 HighWire-hosted articles:
Subspecialty Collections
http://n.neurology.org/cgi/collection/professional_conduct_and_ethics
Professional conduct and ethics
ues
http://n.neurology.org/cgi/collection/all_ethics_in_neurology_legal_iss
All Ethics in Neurology/Legal issues following collection(s):
This article, along with others on similar topics, appears in the
Permissions & Licensing
http://www.neurology.org/about/about_the_journal#permissions its entirety can be found online at:
Information about reproducing this article in parts (figures,tables) or in
Reprints
http://n.neurology.org/subscribers/advertise
Information about ordering reprints can be found online:
rights reserved. Print ISSN: 0028-3878. Online ISSN: 1526-632X.
1951, it is now a weekly with 48 issues per year. Copyright © 2016 American Academy of Neurology. All ® is the official journal of the American Academy of Neurology. Published continuously since