Studying baryon production using two-particle angular
cor-relations
Małgorzata AnnaJanik1,∗
1Faculty of Phyics, Warsaw University of Technology, ul. Koszykowa 75, 00-662 Warsaw, Poland
Abstract.
Latest measurements of∆η∆ϕcorrelations of identified particles show differ-ences in particle production between baryons and mesons. The correlation func-tions for mesons exhibit the expected peak dominated by effects of mini-jet frag-mentation and are reproduced well by general purpose Monte Carlo generators. For baryon pairs (where both particles have the same baryon number) a surpris-ing near-side anti-correlation structure is observed instead of a peak, implysurpris-ing that two such particles are rarely produced with similar momentum. These re-sults present a challenge to the contemporary models and there is no definite theoretical explanation of the observation. In this proceedings an overview of the latest baryon correlation measurements yielding startling results are pre-sented.
1 Introduction
Two-particle angular correlations are a robust tool that enable the exploration of the under-lying physics phenomena of particle production in collisions of both protons and heavy ions by studying the distributions of angles in∆η∆ϕspace (where∆ηis the pseudorapidity
dif-ference and∆ϕis the azimuthal angle difference between two particles). These correlations open up the possibility to study a number of mechanisms simultaneously. Many phenomena, including mini-jets, elliptic flow, Bose-Einstein correlations, resonance decays, conservation laws, etc. are sources of correlations. Each one produces a characteristic distribution in∆η∆ϕ
space and contributes to the final shape of the correlation function. As an example, the clear peak in (∆η,∆ϕ)=(0,0) for pairs of identical mesons originates from jets and Bose-Einstein correlations. Similar peaks observed for correlations of pairs of kaons with opposite charges is a result of resonances (primarilyφ→K+K−) and (also) jets.
The influence of jets on the shape of the correlation function, and hence, the peak in (∆η,∆ϕ)=(0,0) is expected for all particle pairs. It is indeed observed for all studied meson
pairs, as well as for baryon–antibaryon pairs. However, the experimental results [1, 2] show that this peak is not observed for pairs of identical baryons.
2 ALICE results
The studies performed by the ALICE Collaboration were performed on proton–proton col-lisions with energy of √s =7 TeV, as well as energy of √s = 13 TeV. They were carried out for pions, kaons, protons, andΛhyperons, separately for particle–particle and particle– antiparticle pairs. Particles selected for the analysis had pseudorapidity within|η|<0.8 and transverse momentumpT <2.5 GeV/c. The particle identification was performed using the TPC and TOF detectors, reaching 99% purity for pions and protons, and 96% purity for kaons. Λhyperons were reconstructed using their decay topologyΛ(Λ)→ pπ−(pπ+), with purity of more than 95% [1].
2.1 Definition of the correlation function
Experimental correlation function, as reported by ALICE, can be defined as
C(∆η,∆ϕ)= S(∆η,∆ϕ)
B(∆η,∆ϕ). (1)
S(∆η,∆ϕ) is a correlated pairs distribution, whileB(∆η,∆ϕ) is a reference distribution,
ob-tained using the event mixing technique. BothS as well asBare normalized to the number of pairs in each distribution, therefore reported correlation function is a ratio of probabilities (the chance of observation of two particles in respect to the chance of observation of each of those particles separately). The details of measurement are explained in [1].
2.2 Results
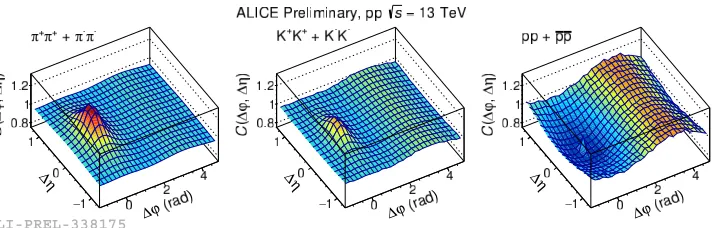
Figure 1 shows correlations for the like-sign pairs of pions, kaons, and protons obtained for √s
=13 TeV pp collisions1measured by the ALICE experiment.
ALI-PREL-338175
Figure 1.Correlation functions of like-sign pions, kaons, and protons from √s=13 TeV pp collisions measured by ALICE.
Results show clear distinct behavior between mesons and baryons: mesons (pions and kaons, left and middle panels) show characteristic near-side peak in (∆η,∆ϕ)=(0,0), while
2 ALICE results
The studies performed by the ALICE Collaboration were performed on proton–proton col-lisions with energy of √s = 7 TeV, as well as energy of √s= 13 TeV. They were carried out for pions, kaons, protons, andΛhyperons, separately for particle–particle and particle– antiparticle pairs. Particles selected for the analysis had pseudorapidity within|η|<0.8 and transverse momentumpT <2.5 GeV/c. The particle identification was performed using the TPC and TOF detectors, reaching 99% purity for pions and protons, and 96% purity for kaons. Λhyperons were reconstructed using their decay topologyΛ(Λ)→ pπ−(pπ+), with purity of more than 95% [1].
2.1 Definition of the correlation function
Experimental correlation function, as reported by ALICE, can be defined as
C(∆η,∆ϕ)= S(∆η,∆ϕ)
B(∆η,∆ϕ). (1)
S(∆η,∆ϕ) is a correlated pairs distribution, whileB(∆η,∆ϕ) is a reference distribution,
ob-tained using the event mixing technique. BothS as well asBare normalized to the number of pairs in each distribution, therefore reported correlation function is a ratio of probabilities (the chance of observation of two particles in respect to the chance of observation of each of those particles separately). The details of measurement are explained in [1].
2.2 Results
Figure 1 shows correlations for the like-sign pairs of pions, kaons, and protons obtained for √s
=13 TeV pp collisions1measured by the ALICE experiment.
ALI-PREL-338175
Figure 1.Correlation functions of like-sign pions, kaons, and protons from√s=13 TeV pp collisions measured by ALICE.
Results show clear distinct behavior between mesons and baryons: mesons (pions and kaons, left and middle panels) show characteristic near-side peak in (∆η,∆ϕ)=(0,0), while
for the pairs of identical protons (right panel) we can observe an anti-correlation. Moreover, in Figure 2∆ηintegrated projections of the two-dimensional correlation functions are shown for both unlike-sign (top row) and like-sign (bottom row) pairs of pions, kaons and protons, 1All results for√s=7 TeV pp collisions, including correlation functions for pairs ofΛhyperons, can be found in [1].
together with PYTHIA8 [3] model simulations. The majority of Monte Carlo generators2 do not describe the anti-correlation shape visible fo baryon–baryon pairs, as well as do not quantitatively describe baryon–antibaryon pairs. The most promising are results from the AMPT generator, see [4, 5].
ALI-PREL-338159
ALI-PREL-338139
Figure 2. ∆ηintegrated projection of correlation functions for pairs of pions, kaons, and protons ob-tained from pp collisions at √s = 13 TeV from ALICE as well as PYTHIA8 Monte Carlo model. Top panels show unlike-sign particles, while bottom panels – like-sign particles. Statistical (bars) and systematic (boxes) uncertainties are plotted.
3 STAR results
Measurements performed by the STAR experiment were done on Au−Au collisions at
√s
NN = 7.7–200 GeV. Analysis was performed for pions, kaons, and protons (separately
for different charge combinations) as well as for different centrality ranges.
3.1 Correlation function definition
Results of the STAR Collaboration were reported asR2quantity, which is defined as follows:
R2(∆y,∆ϕ)= n 2
n(n−1)
ρ2(∆y,∆ϕ)
ρ1(y1, ϕ1)ρ1(y2, ϕ2)−1, (2) where∆y = y1−y2is the difference between rapidity of two particles,nstands for multi-plicity of the given particle type in the collision, whileρ2andρ1are the multiplicity density distributions of pairs of particles of single particles, respectively, normalized to the number of events.
3.2 Results
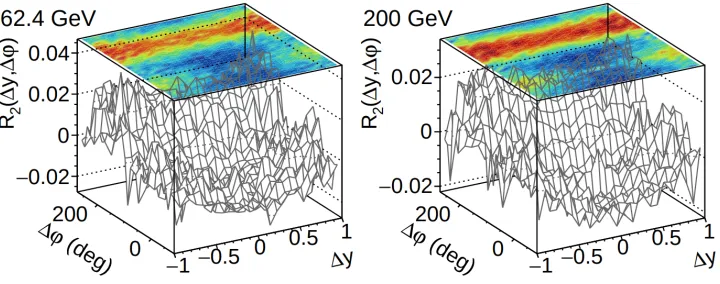
In Figure 3 distributions for the like-sign pairs of protons are presented for two collision energies: √sNN =62.4 GeV and √sNN =200 GeV (more results can be found in Ref. [2]). For both distributions previously discussed anti-correlation at (∆y,∆ϕ) = (0,0) is clearly
visible. The same distribution shape was observed for all studied energies.
Similar anti-correlation is visible also for baryon–antibaryon pairs [2] in heavy-ion col-lisions, however, of much smaller range; that anti-correlation comes from matter–antimatter annihilation and was observed also in the results of femtoscopy [6] measurements as well as Monte Carlo models [2].
3 STAR results
Measurements performed by the STAR experiment were done on Au−Au collisions at
√s
NN = 7.7–200 GeV. Analysis was performed for pions, kaons, and protons (separately
for different charge combinations) as well as for different centrality ranges.
3.1 Correlation function definition
Results of the STAR Collaboration were reported asR2quantity, which is defined as follows:
R2(∆y,∆ϕ)= n 2
n(n−1)
ρ2(∆y,∆ϕ)
ρ1(y1, ϕ1)ρ1(y2, ϕ2)−1, (2) where∆y = y1−y2is the difference between rapidity of two particles,nstands for multi-plicity of the given particle type in the collision, whileρ2andρ1are the multiplicity density distributions of pairs of particles of single particles, respectively, normalized to the number of events.
3.2 Results
In Figure 3 distributions for the like-sign pairs of protons are presented for two collision energies: √sNN =62.4 GeV and √sNN =200 GeV (more results can be found in Ref. [2]). For both distributions previously discussed anti-correlation at (∆y,∆ϕ) = (0,0) is clearly
visible. The same distribution shape was observed for all studied energies.
Similar anti-correlation is visible also for baryon–antibaryon pairs [2] in heavy-ion col-lisions, however, of much smaller range; that anti-correlation comes from matter–antimatter annihilation and was observed also in the results of femtoscopy [6] measurements as well as Monte Carlo models [2].
Figure 3. Correlation functions of like-sign protons from Au–Au collisions at √sNN =62.4 and 200 TeV measured by STAR experiment. Figure from [2].
4 Discussion
Different reasons for the observed shape correlation functions were studied. Possible physics effects that could influence baryon–baryon correlation functions were analyzed:
• The influence of the Coulomb interaction is negligible: the shape of the correlation func-tions is very similar for proton–proton and lambda–lambda (Λhyperons are neutral) pairs, regardless of the electric charge of particles [1].
• Fermi-Dirac quantum statistics effects cannot be the sole reason of the observed anti-correlation. The anti-correlation can be observed for pairs of pp,ΛΛ(identical particles), and pΛ(non-identical particle pairs, that are not influenced by quantum statistics effects) [1].
• The influence of the momentum of particles was studied; regardless of the momentum the anti-correlation was still observed [1].
• The dependence on the collision energy was studied as well: for both lower energies [2] as well as LHC energies (√s=7 TeV [1] and √s=13 TeV) anti-correlation is visible.
• The local conservation of baryon number is not the only reason of the anti-correlation: all studied Monte Carlo models included this effect in the calculations, however, they were unable to reproduce the experimental results [7].
5 Summary
Experimental results, which are not well reproduced by current theoretical models, suggest that the production mechanism of protons – one of the most common particles in the Universe – is not well understood. The surprising e√ ffect of anti-correlation was observed first for s=7 TeV pp collisions by ALICE, but now we know as well, that the same behavior of like-sign baryons is observed for higher, as well as lower energies, and also for different systems.
Acknowledgments
This work was supported by the Polish National Science Centre under decisions no. UMO-2016/22/M/ST2/00176, no. UMO-2017/27/B/ST2/01947 and Polish Ministry of Science and Higher Education.
References
[1] J. Adam et al. (ALICE), Eur. Phys. J.C77, 569 (2017),1612.08975 [2] J. Adam et al. (STAR) (2019),1906.09204
[3] P. Skands, S. Carrazza, J. Rojo, Eur. Phys. J.C74, 3024 (2014),1404.5630
[4] L.Y. Zhang, J.H. Chen, Z.W. Lin, Y.G. Ma, S. Zhang, Phys. Rev.C98, 034912 (2018), 1808.10641
[5] L.Y. Zhang, J.H. Chen, Z.W. Lin, Y.G. Ma, S. Zhang, Phys. Rev.C99, 054904 (2019), 1904.08603