Electronic Thesis and Dissertation Repository
12-11-2012 12:00 AM
Passive and Semi-Active Structure-Multiple Tuned Liquid Damper
Passive and Semi-Active Structure-Multiple Tuned Liquid Damper
Systems
Systems
Islam Soliman
The University of Western Ontario Supervisor
Dr. Ashraf El Damatty
The University of Western Ontario Joint Supervisor Dr. Michael Tait
The University of Western Ontario
Graduate Program in Civil and Environmental Engineering
A thesis submitted in partial fulfillment of the requirements for the degree in Doctor of Philosophy
© Islam Soliman 2012
Follow this and additional works at: https://ir.lib.uwo.ca/etd
Part of the Structural Engineering Commons
Recommended Citation Recommended Citation
Soliman, Islam, "Passive and Semi-Active Structure-Multiple Tuned Liquid Damper Systems" (2012). Electronic Thesis and Dissertation Repository. 1047.
https://ir.lib.uwo.ca/etd/1047
This Dissertation/Thesis is brought to you for free and open access by Scholarship@Western. It has been accepted for inclusion in Electronic Thesis and Dissertation Repository by an authorized administrator of
i
Passive and Semi-Active Structure-Multiple Tuned Liquid Damper Systems
(Spine title: Passive and Semi-Active Structure-MTLD Systems) (Thesis format: Integrated-Article)
By
Islam M. Soliman
Faculty of Engineering
Department of Civil and Environmental Engineering
A thesis submitted in partial fulfilment of the requirements for the degree of
Doctor of Philosophy
The School of Graduate and Postdoctoral Studies The University of Western Ontario
London, Ontario, Canada
ii
THE UNIVERSITY OF WESTERN ONTARIO
School of Graduate and Postdoctoral Studies
CERTIFICATE OF EXAMINATION
Supervisors
______________________________ Dr. Ashraf El Damatty
______________________________ Dr. Michael Tait
Supervisory Committee
______________________________ Dr.
______________________________ Dr.
Examiners
______________________________ Dr. Girma Bitsuamlak
______________________________ Dr. Hesham El Naggar
_____________________________ Dr. Samuel Asokanthan
______________________________ Dr. Sriram Narasimhan
The thesis by
Islam Mohamed Soliman
entitled:
Passive and Semi-Active Structure-Multiple Tuned Liquid Damper Systems
is accepted in partial fulfillment of the requirements for the degree of
Doctor of Philosophy
iii
Abstract
The resonant vibration motion of tall buildings due to dynamic loading, such as wind
storms and earthquakes, can be reduced by adding passive dynamic vibration absorbers
(DVAs). A single sway mode of vibration is usually considered, however, for certain
structures, multiple modes may need to be suppressed. Furthermore, the location of the TLD
on the floor plate is important for certain modes, such as the torsional mode. As a result, a
three dimensional finite element structure-TLD system model capable of dynamically
analyzing a 3D structure is developed and validated. Two different nonlinear TLD models
are considered. A full dynamic analysis of a 3D single-story structure-TLD system is carried
out utilizing the two TLD models and results under harmonic and random excitation are
compared with experimental values. The three dimensional finite element structure-tuned
liquid damper system model (3D-Structure-TLD) is expanded to include multiple tuned
liquid dampers (3D-Structure-MTLD) and employed to estimate the response of a full-scale
model of a 38-story multi-modal high-rise building subjected to wind tunnel loads recorded
at different locations along the building’s width and height.
To further improve TLD effectiveness, the nonlinear TLD fluid model is modified in
order to simulate the influence of inclined damping screens. The updated passive TLD model
is used to investigate the performance of both a single-story structure-TLD system and a
38-story structure-MTLD system with inclined damping screens over a range of structural
response amplitudes utilizing random excitation and wind tunnel loads, respectively. Thus,
the methodology to optimize the effective damping provided by the TLD over a range of
structural responses is addressed.
Finally, a control strategy based on gain scheduling scheme is developed, by actively
controlling the damping screen inclination angle. The updated nonlinear fluid model of a
TLD equipped with inclined damping screens is used to determine the resulting TLD base
shear force and free surface response of a novel semi-active (SA) TLD. The semi-active TLD
control technique is also expanded to include semi-active multiple TLDs
(3D-Structure-SA-MTLD) and employed to analyze a 38-story building over a range of wind angles and return
periods. The improved performance of a semi-active TLD system over a passive TLD system
iv
KEYWORDS: Dynamic Vibration Absorber (DVA), Structural Vibration, 3D Finite Element Model, Full-Scale Dynamic Analysis, Conventional Passive TLD, Nonlinear TLD
Models, Nonlinear TLD Response, 3D-Structure-MTLD System Model, Inclined Damping
Screens, Gain Scheduling Scheme, Semi-Active MTLD, Passive Control, Semi-Active
v
Co-Authorship
This thesis has been prepared in accordance with the regulations for an Integrated-Article
format thesis stipulated by the School of Graduate and Postdoctoral Studies at the University
of Western Ontario and has been co-authored as:
Chapter 2: Development and Validation of Finite Element Structure-Tuned Liquid Damper System Models
The numerical studies were conducted by I.M. Soliman under the supervision of Dr. A.A. El
Damatty and Dr. M.J. Tait, and modifications were done under the close supervision of Dr.
M.J. Tait and Dr. A.A. El Damatty. Drafts of Chapter 2 were written by I.M. Soliman, and
modifications were done under the close supervision of Dr. M.J. Tait and Dr. A.A. El
Damatty. Portions of this Chapter have been accepted to be presented at the 3rd International
Structural Specialty Conference in Edmonton, Alberta, Canada (June 2012), which is a part
of 125th Anniversary Conference of the Canadian Society for Civil Engineers. Portions of this
chapter have been presented at the 3rd International Structural Speciality Conference in
Edmonton, Alberta, Canada, June 2012.
Chapter 3: Three Dimensional Analysis of a High-Rise Building Equipped with Multiple Tuned Liquid Dampers Using Wind Tunnel Loads
The numerical studies were conducted by I.M. Soliman under the supervision of Dr. A.A. El
Damatty and Dr. M.J. Tait, and modifications were done under the close supervision of Dr.
M.J. Tait and Dr. A.A. El Damatty. Drafts of Chapter 3 were written by I.M. Soliman, and
modifications were done under the close supervision of Dr. M.J. Tait and Dr. A.A. El
Damatty.
Chapter 4: Finite Element Modelling of Structure-MTLD Systems with Inclined Damping Screens
The numerical studies were conducted by I.M. Soliman under the supervision of Dr. A.A. El
Damatty and Dr. M.J. Tait, and modifications were done under the close supervision of Dr.
M.J. Tait and Dr. A.A. El Damatty. Drafts of Chapter 4 were written by I.M. Soliman, and
modifications were done under the close supervision of Dr. M.J. Tait and Dr. A.A. El
vi
Chapter 5: Development and Validation of a Finite Element Structure Semi-Active Tuned Liquid Damper System Model
The numerical studies were conducted by I.M. Soliman under the supervision of Dr. A.A. El
Damatty and Dr. M.J. Tait, and modifications were done under the close supervision of Dr.
M.J. Tait and Dr. A.A. El Damatty. Drafts of Chapter 5 were written by I.M. Soliman, and
modifications were done under the close supervision of Dr. M.J. Tait and Dr. A.A. El
Damatty.
Chapter 6: Applications of Multiple Semi-Active TLDs for Structural Control of Three Dimensional High-Rise Buildings Using Wind Tunnel Loads
The numerical studies were conducted by I. M. Soliman under the supervision of Dr. A.A. El
Damatty and Dr. M.J. Tait, and modifications were done under the close supervision of Dr.
M.J. Tait and Dr. A.A. El Damatty. Drafts of Chapter 6 were written by I.M. Soliman, and
modifications were done under the close supervision of Dr. M.J. Tait and Dr. A.A. El
vii
viii
Acknowledgment
I would like to express my appreciation and sincere gratitude to my research supervisors,
Dr. Ashraf El Damatty and Dr. Michael Tait. Their guidance and patience were essential to
the development of this thesis.
I want to express my deep appreciation to my supervisor, Dr. Michael Tait, for his
endless support, understanding, discussions and continuous encouragement.
I would like to thank Dr. Eric Ho from the Boundary Layer Wind Tunnel Laboratory for
providing me the wind tunnel data and for his helpful discussions.
I would also like to extend my sincere thanks to all my colleagues and friends, who I
have worked beside and have had many interesting conversation with.
Special thanks are given to my parents, brothers, sister and parents-in-law who I owe a lot
for accepting my small family’s absence during my study period here in Canada. They have
been a constant source of patience and encouragements.
I wish to dedicate this thesis to my wife, Yara, for her love and patience over the time
that I have spent on this thesis. Her care and support have made it possible for me to
accomplish this work.
Last but not least, I would like to thank my son, Ahmed, for making my life happier and
ix
Table of Contents
Page
Abstract ... iii
Co-Authorship ... v
Acknoledgments ... viii
Table of Contents ... ix
List of Tables ... xv
List of Figures ... xvii
Nomenclator ... xxv
Chapter 1: Introduction 1.1. General Overview ... 1
1.2. Categorization of Structural Response Mitigation Systems ... 1
1.2.1 Active Control Systems ... 2
1.2.2 Passive Control Systems ... 2
1.2.3 Hybrid Control Systems ... 3
1.2.4 Semi-Active Control Systems ... 3
1.3. Passive/Active/Semi-Active TMD ... 4
1.4. Passive TLCD/TLD ... 6
1.5. TLD Modelling Techniques ... 7
1.5.1 Equivalent Mechanical Models ... 7
1.5.2 Fluid Models and Energy Dissipating Devices ... 8
1.5.2.1 TLD Modelling with No Screens ... 8
1.5.2.2 TLD Modelling with Screens ... 9
1.6. Advantages and Disadvantages of TLCD/TLD ... 10
1.7. Adjustable Inherent Absorber Damping Ratio... 12
1.8. Full-Scale Damper Applications ... 13
1.8.1 Example TMD Applications ... 13
1.8.2 Example HMD/AMD Applications ... 14
1.8.3 Example TLCD/TLD Applications... 16
1.9. Impetus of Study ... 17
1.10. Research Objectives ... 17
1.11. Organization of Thesis ... 18
x
Chapter 2: Development and Validation of Finite Element Structure-Tuned Liquid Damper System Models
2.1. Introduction ... 36
2.2. Description of the Finite Element Model ... 38
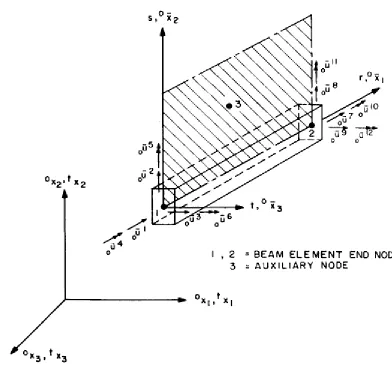
2.2.1 Three Dimensional Beam Element ... 38
2.2.2 Direct Integration Methods: Background ... 39
2.2.3 Explicit and Implicit Methods... 40
2.3. Validation of the Finite Element Model ... 40
2.4. 3D-Structure-TLD System Model ... 41
2.4.1 TLD/TMD Background ... 42
2.4.2 Tuned Liquid Damper Models ... 44
2.4.2.1 Nonlinear Shallow Water Fluid Model (TLD Model 1) ... 45
2.4.2.2 Equivalent Amplitude Dependent Tuned Mass Damper (EADTMD) Model (TLD Model 2) ... 47
2.5. Structure-TLD Interaction (Numerical Simulation) ... 50
2.5.1 Numerical Simulation Utilizing the Fluid Model (TLD Model 1) ... 53
2.5.2 Numerical Simulation Utilizing the EADTMD Model (TLD Model 2) ... 53
2.5.2.1 Velocity Dependent Method for EADTMD Model ... 54
2.6. Validation of 3D FE-Structure-TLD System Model ... 56
2.6.1 Validation Under Sinusoidal Excitation ... 56
2.6.2 Validation Under Random Excitation ... 56
2.7. Conclusions ... 57
2.8. References ... 58
Chapter 3: Three Dimensional Analysis of a High-Rise Building Equipped with Multiple Tuned Liquid Dampers Using Wind Tunnel Loads 3.1. Introduction ... 72
3.2. Details of the Wind Climate Used in the Study (BLWT-SS3-2007) ... 73
3.2.1 Meteorological Data ... 73
3.2.2 Statistical Wind Climate Model ... 74
3.3. The Modelling of the Site and the Wind ... 75
3.3.1 Overall Approach ... 75
3.3.2 Model Design... 75
xi
3.4. Response of the Indianapolis Building with No-TLDs ... 76
3.4.1 Validation of a 3D Finite Element Model ... 76
3.4.2 Response of a 3D-FE Model Utilizing Excitation from Wind Tunnel Data ... 77
3.5. TLD/TMD Background Information ... 78
3.6. TLD Design Procedure to Suppress the First Two Modes of the Indianapolis Building... 80
3.6.1 TLD Design Procedure ... 80
3.6.2 Modal Contribution Response Components (Modal Factors, 𝑀𝐹) ... 80
3.6.3 TLD Parameter Calculations ... 81
3.6.4 TLD Water Mass Calculations ... 83
3.7. Modelling and Response of the Indianapolis Building Equipped with Bi-Directional TLDs to Suppress the First Two Modes of Vibration ... 86
3.7.1 TLD Models ... 86
3.7.1.1 Fluid Model (TLD Model 1) ... 86
3.7.1.2 EADTMD Model (TLD Model 2) ... 88
3.7.2 Modelling of Structure-TLD Systems ... 90
3.7.3 Evaluation of Improved Performance Using TLDs (2 Modes) ... 92
3.7.4 Response Evaluation of the Indianapolis Building ... 93
3.7.5 Serviceability Check of the Indianapolis Building ... 95
3.8. Response of the Indianapolis Building Equipped with Uni/Bi-Directional TLDs to Suppress the First Three Modes of Vibration ... 96
3.8.1 TLD Design Procedure for the Third Mode of Vibration ... 96
3.8.2 Response Evaluation of the Indianapolis Building ... 98
3.8.3 Serviceability Check of the Indianapolis Building ... 99
3.9. Conclusions ... 100
3.10. References ... 101
Chapter 4: Finite Element Modelling of Structure-MTLD Systems with Inclined Damping Screens 4.1. Introduction ... 122
4.2. Damping Screens (Background) ... 123
4.2.1 Slat Screens ... 123
4.2.2 Smart Screens ... 125
4.3. Loss Coefficient for Damping Screens in a TLD ... 125
4.3.1 Pressure Loss Coefficient for Vertical Damping Screen (𝐶𝑙) ... 126
4.3.2 Pressure Loss Coefficient for Inclined Damping Screen (𝐶𝜃) ... 126
xii
4.4.1 Nonlinear Fluid Model of a TLD Equipped with Inclined Damping Screens ... 128
4.4.2 Nonlinear Simulation of a TLD Equipped with Inclined Damping Screens ... 131
4.4.2.1 Frequency Response Comparison ... 132
4.4.2.2 Time History Comparison ... 133
4.5. Performance of a 3D-Structure-TLD System Model Equipped with Inclined Damping Screens ... 133
4.5.1 Response/Efficiency of a 3D-Structure-TLD System Model ... 134
4.6. Investigation of a Single-Story Structure with TLD Equipped with Vertical/Inclined Damping Screens under Random Excitation ... 136
4.6.1 Efficiency of a Structure-TLD System Model Equipped with Vertical Damping Screens ... 136
4.6.2 Procedure to Estimate Damping Screen Angle for Improved TLD Efficiency ... 138
4.6.3 Improved Efficiency of a Structure-TLD System Model Equipped with Inclined Damping Screens ... 139
4.7. Response of a High-Rise Building-MTLD-System with Inclined Damping Screens at Various Serviceability Return Periods ... 140
4.7.1 Brief Description of the Indianapolis Building and Its Dynamic Characteristics ... 141
4.7.2 Response of the Indianapolis Building with No-TLDs ... 141
4.7.3 Placement Selection and Design of TLDs ... 141
4.7.3.1 TLD Design Procedure (50-Year Serviceability Return Period) ... 142
4.7.4 Response of the Indianapolis Building with TLDs to Suppress the First Three Modes .... 144
4.8. Response of a High-Rise Building-MTLD-System over a Range of Mixed Return Periods (Dual Design Approach) ... 145
4.8.1 Response of the Indianapolis Building with No-TLDs ... 146
4.8.2 Placement Selection and Design of TLDs ... 146
4.8.3 Response of the Indianapolis Building with TLDs to Suppress the First Three Modes Including the Design Level Wind Speed ... 146
4.9. Conclusions ... 147
4.10. References ... 148
Chapter 5: Development and Validation of a Finite Element Structure Semi-Active Tuned Liquid Damper System Model 5.1. Introduction ... 169
5.2. Response/Efficiency of a Structure-TLD System Model ... 172
5.3. Modelling of a Three Dimensional Finite Element Structure Semi-Active Tuned Liquid Damper System (3D-Structure-SA-TLD) ... 174
5.3.1 Gain Scheduling Method for Semi-Active TLD Mode of Control ... 174
xiii
5.3.2.1 Preliminary TLD Design Procedure to Estimate the Required Inclination Angle
of the Damping Screens for 100% TLD Efficiency ... 177
5.3.2.2 Construction of 100% TLD Efficiency Envelope Curves ... 178
5.3.2.3 Construction and Discussion of the Look-Up Tables ... 179
5.3.3 Averaging Time (𝐴𝑇), Updating Time (𝑈𝑇) and Initial Time (𝐼𝑇) Parameters for a 3D-Structure-SA-TLD System Model and Sensitivity Analysis of𝐴𝑇 and𝑈𝑇... 181
5.4. Influence of Excitation Amplitude on the Response of a 3D-Structure-SA-TLD System Model ... 183
5.5. Performance Semi-Active TLD Control System versus the Passive TLD Control System ... 184
5.6. Influence of Semi-Active Control on Fluid Response ... 186
5.7. Conclusions ... 186
5.8. References ... 188
Chapter 6: Applications of Multiple Semi-Active TLDs for Structural Control of Three Dimensional High-Rise Buildings Using Wind Tunnel Loads 6.1. Introduction ... 207
6.2. Brief Description of the High-Rise Building and Its Dynamic Characteristics ... 208
6.3. Response Evaluation High-Rise Building with No-TLDs ... 209
6.4. Implementation of an Alternative to Look-Up Tables for Semi-Active Control Strategy ... 210
6.4.1 Design Procedure and Damping Screen Loss Coefficient Range Selection for a Semi-Active TLD Control Strategy ... 212
6.4.1.1 Semi-Active TLD Design Procedure for the First Two Modes of Vibration ... 213
6.4.1.2 Semi-Active TLD Design Procedure for the Third Mode of Vibration ... 214
6.4.2 Sensitivity Analysis for Averaging Time (𝐴𝑇) and Updating Time (𝑈𝑇) and Damping Screen Loss Coefficient Range Selection Checks ... 215
6.5. Improved Responses of an Actual High-Rise Building Utilizing Multiple SA-TLDs Over a Range of Wind Loading Directions ... 216
6.5.1 Investigation of SA-TLDs Response History Over a Range of Wind Loading Directions ... 218
6.5.1.1 Response History of SA-TLDs for Mode 1 in the𝑥-Direction ... 219
6.5.1.2 Response History of SA-TLDs for Mode 2 in the 𝑦-Direction ... 220
6.5.1.3 Response History of SA-TLDs for Mode 3 in the 𝑥- and 𝑦-Directions ... 220
6.6. Improved Responses of an Actual High-Rise Building Utilizing Multiple SA-TLDs Over a Range of Mixed Return Periods ... 221
6.6.1 Response Evaluation with No-TLDs ... 222
xiv
6.6.3 Investigation of SA-TLDs Response History and Performance Comparison with
Passive TLDs ... 223
6.6.3.1 Response History of SA-TLDs for Different Return Periods ... 224
6.7. Conclusions ... 226
6.8. References ... 227
Chapter 7: Conclusions and Recommendations 7.1. Summary and Conclusions ... 246
7.1.1 Development and Validation of Finite Element Structure-Tuned Liquid Damper System Models ... 246
7.1.2 Three Dimensional Analysis of a High-Rise Building Equipped with Multiple Tuned Liquid Dampers Using Wind Tunnel Loads ... 247
7.1.3 Finite Element Modelling of Structure-MTLD Systems with Inclined Damping Screens ... 248
7.1.4 Development and Validation of a Finite Element Structure Semi-Active Tuned Liquid Damper System Model ... 249
7.1.5 Applications of Multiple Semi-Active TLDs for Structural Control of Three Dimensional High-Rise Buildings Using Wind Tunnel Loads ... 250
7.2. Recommendations for Future Study ... 251
Appendices Appendix-A ... 253
Appendix-B ... 264
Appendix-C ... 270
Appendix-D ... 273
xv
List of Tables
Table Discretion Page
Table 1.1. Structural Response Mitigation Systems (from Soong and Dargush 1997) ... 27
Table 2.1. Building Properties ... 62
Table 2.2. TLD Properties ... 62
Table 2.3. Fluid Model Excitation Amplitudes ... 62
Table 3.1. Modal Acceleration Response Components in the 𝑥-direction for the Indianapolis Building with No-TLDs ... 104
Table 3.2. Modal Acceleration Response Components in the 𝑦-direction for the Indianapolis Building with No-TLDs ... 104
Table 3.3. TLD Design for Mode 1 (𝑥-direction) for the Indianapolis Building ... 105
Table 3.4. Water Mass Calculations for TLDs to Suppress Modes 1 and 2 for the Indianapolis Building ... 106
Table 3.5. Modal Acceleration Response Components in the 𝑥-direction for the Indianapolis Building with TLDs to Suppress the First Two Modes of Vibration ... 107
Table 3.6. Modal Acceleration Response Components in the 𝑦-direction for the Indianapolis Building with TLDs to Suppress the First Two Modes of Vibration ... 107
Table 3.7. Modal Acceleration Response Components in the 𝑥-direction for the Indianapolis Building with TLDs to Suppress the First Three Modes of Vibration ... 108
Table 3.8. Modal Acceleration Response Components in the 𝑦-direction for the Indianapolis Building with TLDs to Suppress the First Three Modes of Vibration ... 108
Table 3.9. Percentage Reductions of the Average Peak Hourly Resultant Acceleration Responses for the Indianapolis Building Utilizing 2 and 3 Mode TLDs ... 108
Table 4.1. Fraction of 𝐶𝑙 with Angle (from Cassolato 2007) ... 153
Table 4.2. Building Properties ... 153
Table 4.3. TLD Properties ... 153
Table 4.4. TLD Design for Vertical Damping Screens (𝜇= 1.0%) ... 154
Table 4.5. Inclined Damping Screen Loss Coefficient values (𝐶𝜃) Used in the Parametric Study for the Single-Story Structure-TLD System ... 155
Table 4.6. Serviceability Return Periods and Wind Speeds ... 155
Table 4.7. Modal Acceleration Response Components in the 𝑥- and 𝑦-directions at the Centre of Mass with No-TLDs over a Range of Serviceability Return Period Wind Speeds (𝜃𝑤= 210∘, 𝑧= 154.6 m) ... 156
Table 4.8. Modal Acceleration Response Components in the 𝑥- and y-directions at the Four Corners Equipped with TLDs to Suppress the First Two Modes over a Range of Serviceability Return Period Wind Speeds (𝜇= 2%, 𝜃𝑤= 210∘, 𝑧= 154.6 m) ... 156
xvi
Table 4.10. Water Mass Calculations for TLDs to Suppress Mode 1 (𝜇= 2.0%) ... 158
Table 4.11. Optimal Properties of TLDs Equipped with Inclined Damping Screens to Suppress the First Three Modes of Vibration over a Range of Serviceability Return Period Wind Speeds (𝜇= 2.0%, 𝜃𝑤= 210∘) ... 158
Table 4.12. Mixed Return Periods and Wind Speeds ... 158
Table 4.13. Modal Factors in the 𝑥- and 𝑦-directions at the Centre of Mass with No-TLDs at Mixed Return Period Wind Speeds (𝜃𝑤= 210∘, 𝑧= 154.6 m) ... 159
Table 4.14. Modal Factors in the 𝑥- and 𝑦-directions at the Four Corners of the Indianapolis Building Equipped with TLDs to Suppress the First Two Modes of Vibration over a Range of Mixed Return Period Wind Speeds (𝜇= 2.0%, 𝜃𝑤= 210∘, 𝑧= 154.6 m) ... 159
Table 4.15. Optimal Properties of TLDs Equipped with Inclined Damping Screens to Suppress the First Three Modes of Vibration over a Range of Mixed Return Period Wind Speeds (𝜇 = 2.0%, 𝜃𝑤 = 210∘) ... 159
Table 5.1. Building Properties ... 193
Table 5.2. TLD Properties ... 193
Table 5.3. Preliminary TLD Design for Vertical Damping Screens (𝜇= 1.0%) ... 194
Table 5.4. Inclined Damping Screens Loss Coefficient values (𝐶𝜃) Used in the Validation Study ... 195
Table 5.5. Scaled Random Forces Used in the Validation Study ... 195
Table 6.1. Serviceability and Strength (Mixed) Return Periods and Wind Speeds ... 230
Table 6.2. Modal Acceleration Response Components in the 𝑥- and 𝑦-directions at the Centre of Mass with No-TLDs (𝜃𝑤 = 210∘, 𝑧= 154.6 m) ... 230
Table 6.3. Modal Acceleration Response Components in the 𝑥- and 𝑦-directions at the Four Corners with TLDs to Suppress the First Two Modes (𝜇= 6%,𝜃𝑤= 210∘, 𝑧= 154.6 m) ... 230
Table 6.4. Preliminary TLD Design for Mode 1 in the 𝑥-direction (𝜇= 6.0%, Serviceability Return Period = 10 years) ... 231
xvii
List of Figures
Figure Discretion Page
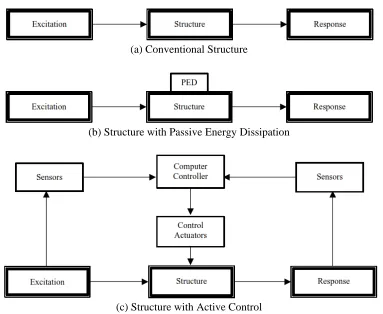
Fig. 1.1. Schematic of Various Control Systems (a: actuator, Con: control, Ex: excitation,
S: sensor) (from Kareem et al. 1999) ... 28
Fig. 1.2. Structures with Various Control Schemes (from Spencer and Soong 1999) ... 28
Fig. 1.3. Theoretical Representation of a Structure-DVA System (form Cassolato 2007) ... 29
Fig. 1.4. Experimental Speed Profile (from van der Tempel 2006) ... 30
Fig. 1.5. (a) TLCD; (b) Frahm’s Anti-Rolling Tank; and (c) Nutation Damper in Satellite (form Cassolato 2007) ... 30
Fig. 1.6. (a) Structure-TLD System; (b) Theoretical Representation; and (c) TMD Analogy (form Cassolato 2007) ... 30
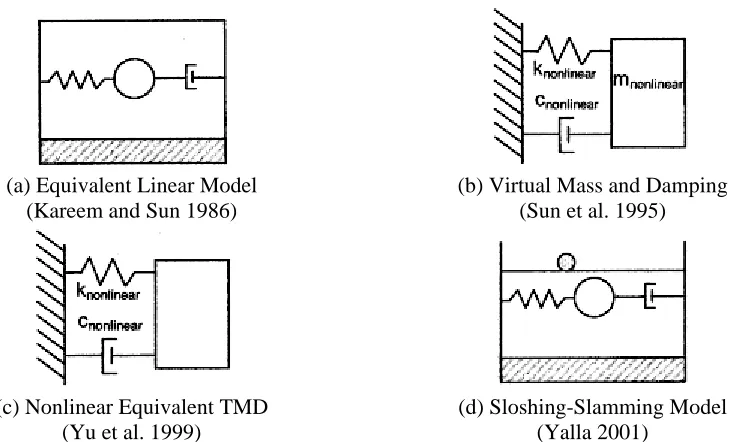
Fig. 1.7. Various Proposed Mechanical Models for Tuned Liquid Damper ... 31
Fig. 1.8. (a) TLD with Standing Rotatable Baffles; (b) Five-Story Building Model Equipped with TLD with Baffles on the Top and Located on the UTS Shaking Table; and (c) Schematic of Experimental Set-up and Instrumentation (from Zahari et al. 2012) ... 31
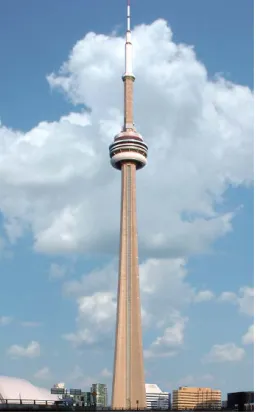
Fig. 1.9. CN Tower, Toronto, Canada ... 32
Fig. 1.10. Pendulum-Type TMD Utilized in Taipei 101 in Taipei, Taiwan ... 32
Fig. 1.11. (a) Sendagaya INTES Building; (b) Elevation View; and (c) Top View of the HMD Control System (from Spencer and Nagarajaiah 1999) ... 33
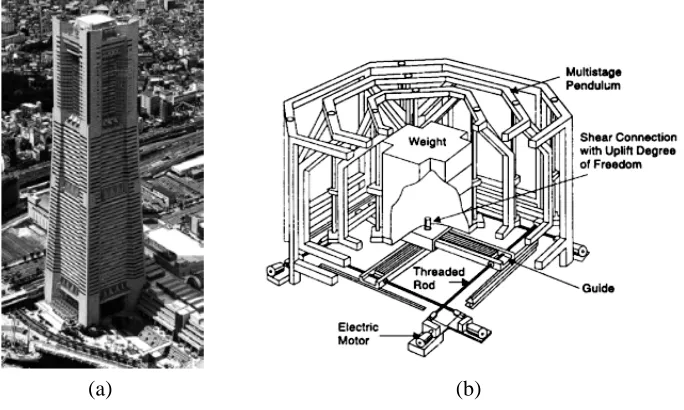
Fig. 1.12. (a) Yokohama Landmark Tower; (b) Schematic View of HMD; and (c) Principle of DUOX System (from Yamazaki et al. 1992) ... 33
Fig. 1.13. (a) Kyobashi Seiwa Building; and (b) Schematic View of AMD Control System (from Spencer and Nagarajaiah 1999) ... 34
Fig. 1.14. Nanjing Communication Tower (a) Elevation View; and (b) AMD Design (from Spencer and Nagarajaiah 1999) ... 34
Fig. 1.15. Stacks of Cylindrical-TLD MMDs Installed in SYPH (from Tamura et al. 1995) ... 35
Fig. 1.16. (a) 1 King West, Toronto, Canada; and (b) 1 Wall Centre, Vancouver, Canada ... 35
Fig. 2.1. Example of Bi-Directional TLD Configurations to Suppress: (a) Perpendicular Sway Modes, (b) a Pure Torsion Mode, and (c) Combined Sway and Torsion (from Tait et al. 2005) ... 63
Fig. 2.2. The Evolution of (a) a Structure-TLD System into (b) a Generalized Structural System with TLDs then into (c) a System with Equivalent TMD Representation (after Andrew 2009) ... 63
Fig. 2.3. Schematic View of the Three Dimensional Beam Element and Local Co-ordinate Axes (from Bathe and Bolourchi 1979) ... 64
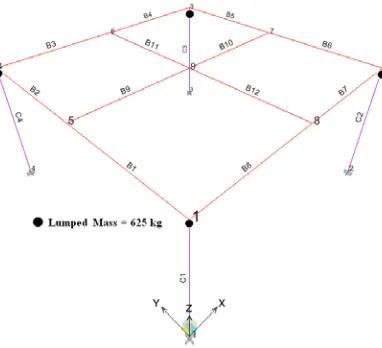
Fig. 2.4. 3D View of a Single-Story Structure Modelled with a Slab (SAP2000-Model 1) ... 65
xviii
Fig. 2.6. A 3D Single-Story Structure Modelled with Horizontal Frame Elements to
Simulate the Slab (SAP2000-Model 2) ... 65
Fig. 2.7. 3D-Structure Responses for Harmonic Excitation (a) Displacement, (b) Velocity, and (c) Acceleration ... 66
Fig. 2.8. Schematic of a TLD and its Dimensions (from Tait et al. 2004a) ... 67
Fig. 2.9. Photograph of a TLD Equipped with Internal Damping Screens (from Tait et al. 2004a) ... 67
Fig. 2.10. View of the Tank Set-up End View and Enlarged View of the Screen (from Tait et al. 2004a) ... 67
Fig. 2.11. Coordinate System for Nonlinear Shallow Water System (from Tait et al. 2005b) ... 68
Fig. 2.12. Discretization of the Tank Length with Respect to x (from Tait et al. 2005b) ... 68
Fig. 2.13. Discretization and Modelling of the Screen (from Tait et al. 2005b) ... 68
Fig. 2.14. TLD and EADTMD Model (a) TLD Equipped with Damping Screens, and (b) EADTMD Model (from Tait et al. 2004a) ... 69
Fig. 2.15. Normalized Energy Dissipation Frequency Response Curves from the Nonlinear TLD Fluid Model and the EADTMD Model for (a)𝐴/𝐿=0.0026, and (b) 𝐴/ 𝐿=0.0129 ... 69
Fig. 2.16. Equivalent Amplitude Dependent Tuned Mass Damper (EADTMD) Properties ... 70
Fig. 2.17. Frequency Response Curves For the 3D-Structure-TLD System Model ... 70
Fig. 2.18. For Minute 31 (a) Time History of the Random Excitation Force with 𝐹𝑚𝑎𝑥= 150 N, (b) Displacement Response Comparison of 3D-Structure-TLD System Model Employing Two Nonlinear TLD Models, and (c) Structural Displacement Response with/without TLD Attached ... 71
Fig. 3.1. Predicted Annual Extreme Upper Level (500 m) Wind Speed for Various Return Periods (from BLWT-SS3-2007) ... 109
Fig. 3.2. Close up Views of the Pressure Model (from BLWT-SS3-2007) ... 109
Fig. 3.3. Photographs of the High-Rise Building Model in the Wind Tunnel Showing the Upstream Terrain Models for Different Exposures (from BLWT-SS3-2007) ... 110
Fig. 3.4. Azimuth Ranges Over Which the Upstream Terrain Models were Used (from BLWT-SS3-2007) ... 110
Fig. 3.5. Mode Shapes of the Indianapolis Building for (a) Mode 1, (b) Mode 2, and (c) Mode 3 ... 111
Fig. 3.6. Floor Plan of the Indianapolis Building Showing the Statical System Consists of (a) Real Slabs and Shear Walls, and (b) Frame Elements and Slab Beams Installed with Lumped Masses (kg) ... 111
Fig. 3.7. Displacement Time History of the Indianapolis Building at the 𝐶𝑀 with No-TLD Installed in the (a) 𝑥-direction, (b) 𝑦-direction (𝑧= 154.6 m; 𝜃𝑤 = 210∘) ... 112
Fig. 3.8. RMS Acceleration Responses of the Indianapolis Building in the 𝑥-direction with No-TLDs Installed ... 113
xix
Fig. 3.10. Average Peak Hourly Resultant Acceleration Responses of the Indianapolis Building with No-TLDs Installed ... 113 Fig. 3.11. (a) Schematic of a TLD and Its Dimensions; (b) Photo of a TLD Equipped with
Internal Damping Screens; (c) Coordinate System for Nonlinear Shallow Water System; and (d) EADTMD Model (from Tait 2004) ... 114 Fig. 3.12. TLD (a) Mass Ratio, (b) Frequency Ratio, and (c) Damping Ratio with respect to
the Normalized Amplitude of Excitation for Mode 1 tanks in the 𝑥-direction of the Indianapolis Building ... 115 Fig. 3.13. Development of TMD Mass Matrix (from Yat 2009) ... 116 Fig. 3.14. Displacement Time History of the Indianapolis Building with TLDs Installed to
Suppress the First two Modes at the 𝐶𝑀 in the (a) 𝑥-direction, (b) 𝑦-direction (𝑧= 154.6 m; 𝜃𝑤= 210∘) ... 117 Fig. 3.15. A Comparison Time History of the Indianapolis Building at 𝐶𝑀 with/without
TLDs Installed to Suppress the First two Modes for the (a) Displacement, (b) Velocity, and (c) Acceleration in the 𝑥-direction (𝑧= 154.6 m, 𝜃𝑤= 210∘) ... 118 Fig. 3.16. A Comparison Time History of the Indianapolis Building at 𝐶𝑀 with/without
TLDs Installed to Suppress the First two Modes for the (a) Displacement, (b) Velocity, and (c) Acceleration in the 𝑦-direction (𝑧= 154.6 m, 𝜃𝑤 = 210∘) ... 119 Fig. 3.17. RMS Acceleration Responses of the Indianapolis Building in the 𝑥-direction with
TLDs Installed to Suppress the First Two Modes ... 120 Fig. 3.18. RMS Acceleration Responses of the Indianapolis Building in the 𝑦-direction with
TLDs Installed to Suppress the First Two Modes ... 120 Fig. 3.19. Average Peak Hourly Resultant Acceleration Responses of the Indianapolis
Building with TLDs Installed to Suppress the First Two Modes ... 120
Fig. 3.20. Percentage Response Reductions of the Average Peak Hourly Resultant
Accelerations of the Indianapolis Building with TLDs Installed to Suppress the First Two Modes ... 120 Fig. 3.21. RMS Acceleration Responses of the Indianapolis Building in the 𝑥-direction with
TLDs Installed to Suppress the First Three Modes ... 121 Fig. 3.22. RMS Acceleration Responses of the Indianapolis Building in the 𝑦-direction with
TLDs Installed to Suppress the First Three Modes ... 121 Fig. 3.23. Average Peak Hourly Resultant Acceleration Responses of the Indianapolis
Building with TLDs Installed to Suppress the First Three Modes ... 121
Fig. 3.24. Percentage Response Reductions of the Average Peak Hourly Resultant
Accelerations of the Indianapolis Building with TLDs Installed to Suppress the First Three Modes ... 121 Fig. 4.1. TLD Equipped with Inclined Screens: (a) Schematic of a TLD Showing the
Location of Screens and Wave Probes; (b) Enlarged View of the Screen; and (c) Photo of TLD Equipped with Internal Inclined Damping Screens (from Cassolato 2007) ... 160 Fig. 4.2. Normalized Various𝐶𝜃 from Equation 4.22 for Two Different Screens (from
xx
Fig. 4.4. Discretization of the Tank Length with Respect to 𝑥 (from Tait et al. 2005b) ... 161
Fig. 4.5. Discretization and Modelling of the Screen (from Tait et al. 2005b) ... 161
Fig. 4.6. Energy Dissipation Frequency Response Curves for 𝐶𝑙 = 3.53 and 𝛬= 0.005 ... 162
Fig. 4.7. Energy Dissipation Frequency Response Curves for𝐶𝑙 = 3.53 and 𝛬 = 0.021 ... 162
Fig. 4.8. Non-Dimensional Energy Dissipation for Various Screen Angles (𝛬 = 0.010, 𝐶𝑙 = 5.69) ... 162
Fig. 4.9. Constant Normalized Energy Dissipation through Inclined Screens (𝐶𝑙 = 5.69) ... 162
Fig. 4.10. Time Histories of 𝜂′ for 𝜃= 0∘, 30∘and 60∘ at 𝛽= 1.01 for 𝐶𝑙 = 3.53 ... 163
Fig. 4.11. Time Histories of 𝐹𝑤′ for 𝜃= 0∘, 30∘and 60∘ at 𝛽 = 1.01 for 𝐶𝑙 = 3.53 ... 163
Fig. 4.12. 3D Single-Story Structure Used in the Parametric Analysis (a) A Schematic Diagram, and (b) 3D View ... 163
Fig. 4.13. One Minute Portion of a 3.7-Hour Time History of Random Excitation Force ... 164
Fig. 4.14. Efficiency over Range of Structural Responses (a)𝜇= 1.0%, (b)𝜇= 2.5%, (c)𝜇= 3.5%, and (d)𝜇= 5.0% (𝑆= 60%) ... 165
Fig. 4.15. Predicted Annual Extreme Upper Level (500 m) Wind Speed for Various Return Periods (BLWT-SS3-2007) ... 165
Fig. 4.16. Floor Plan of the Indianapolis Building Showing the Statical System Consists of (a) Real Slabs and Shear Walls, and (b) Frame Elements and Slab Beams Installed with Lumped Masses (kg) ... 166
Fig. 4.17. Mode Shapes of the Indianapolis Building for (a) Mode 1, (b) Mode 2, and (c) Mode 3 ... 166
Fig. 4.18. Average Peak Hourly Resultant Accelerations with No-TLDs Installed (𝜃𝑤= 210∘, 𝑧= 154.6 m) ... 167
Fig. 4.19. Average Peak Hourly Resultant Accelerations with TLDs to Suppress the First 3 Modes Equipped with Inclined Damping Screens (𝜇= 2.0%, 𝜃𝑤= 210∘, 𝑧= 154.6 m) ... 167
Fig. 4.20. Percentage Response Reductions of the Average Peak Hourly Resultant Accelerations with TLDs to Suppress the First 3 Modes Equipped with (a) Inclined Damping Screens; and (b) Fixed (Single Angle) Damping Screens (𝜇= 2.0%, 𝜃𝑤 = 210∘, 𝑧= 154.6 m) ... 167
Fig. 4.21. Average Peak Hourly Resultant Accelerations for Mixed Return Periods with No-TLDs Installed (𝜃𝑤 = 210∘, 𝑧= 154.6 m) ... 168
Fig. 4.22. Average Peak Hourly Resultant Accelerations for Mixed Return Periods with TLDs to Suppress the First 3 Modes Equipped with Inclined Damping Screens (𝜇= 2.0%, 𝜃𝑤 = 210∘, 𝑧= 154.6 m) ... 168
Fig. 4.23. Percentage Response Reductions of the Average Peak Hourly Resultant Accelerations for Mixed Return Periods with TLDs to Suppress the First 3 Modes Equipped with (a) Inclined Damping Screens; and (b) Fixed (Single Angle) Damping Screens (𝜇 = 2.0%, 𝜃𝑤 = 210∘, 𝑧= 154.6 m) ... 168
xxi
Fig. 5.2. 3D Single-Story Structure Used in the Semi-Active Control Strategy Validation (a) A Schematic Diagram; and (b) 3D View ... 197 Fig. 5.3. Efficiency over Range of Structural Responses for 𝜇= 1.0% (𝑆= 60%) ... 197 Fig. 5.4. Efficiency over Range of Structural Responses for 𝜇= 2.5% (𝑆= 60%) ... 197 Fig. 5.5. Efficiency over Range of Structural Responses for 𝜇= 3.5% (𝑆= 60%) ... 198 Fig. 5.6. Efficiency over Range of Structural Responses for 𝜇= 5.0% (𝑆= 60%) ... 198 Fig. 5.7. Look-Up Table for Semi-Active Control Strategy at Various Mass Ratios ... 198 Fig. 5.8. Performance Charts Showing Values of (a) 𝜁𝑒𝑓𝑓 (%); (b) 𝑥𝑟 for 𝜇= 2.5%,
0.5 <𝛺< 1.5, and 0 <𝜁𝐴% < 100 (from Tait et al. 2008) ... 199 Fig. 5.9. Modeling of Structure with TLD/TMD Vibration Absorber and Equivalent SDOF
System (from Tait et al. 2008) ... 199 Fig. 5.10. RMS Structural Acceleration Response Values Resulting from the Semi-Active
Control Strategy Utilizing Various Averaging Time Values,𝐴𝑇 (S7-Random Force,𝜇= 3.5%,𝑈𝑇 = 1.0 𝑇) ... 200 Fig. 5.11. Screen Loss Coefficient Values Resulting from the Semi-Active Control Strategy
Utilizing Various Averaging Time Values, AT (S7-Random Force,𝜇=
3.5%,𝑈𝑇= 1.0 𝑇) ... 200 Fig. 5.12. Average Peak Hourly Structural Acceleration Response Values Resulting from the
Semi-Active Control Strategy for Various Updating Time Values,𝑈𝑇 (S7-Random Force,𝜇 = 3.5%, 𝐴𝑇= 60 min) ... 201 Fig. 5.13. Screen Loss Coefficient Values Resulting from the Semi-Active Control Strategy
for Various Updating Time Values,𝑈𝑇 (S7-Random Force,𝜇= 3.5%,𝐴𝑇 = 60 min) ... 201 Fig. 5.14. RMS Structural Acceleration Response Values Resulting from the Semi-Active
Control Strategy Subjected to Various Random Forces S1-S13 (𝜇= 3.5%,
𝐴𝑇= 60 min,𝑈𝑇= 1.0 𝑇) ... 202 Fig. 5.15. Screen Loss Coefficient Values Resulting from the Semi-Active Control Strategy
Subjected to Various Random Forces S1-S13 (𝜇= 3.5%, 𝐴𝑇= 60 min,𝑈𝑇= 1.0 𝑇) ... 202 Fig. 5.16. RMS Hourly Structural Acceleration Response Values Resulting from the Passive
and the Semi-Active Control Strategy for Various Averaging Time Values (𝐴𝑇) (S7-Random Force,𝜇= 3.5%,𝑈𝑇= 1.0 𝑇) ... 203 Fig. 5.17. Peak Hourly Structural Acceleration Response Values Resulting from the Passive
and the Semi-Active Control Strategy for Various Averaging Time Values (AT) (S7-Random Force,𝜇= 3.5%,𝑈𝑇= 1.0 𝑇) ... 203 Fig. 5.18. Hourly and Average Peak Factor Values Resulting from the Passive and the
Semi-Active Control Strategy (𝐴𝑇 = 60 min,𝑈𝑇= 1.0 𝑇) ... 203 Fig. 5.19. Screen Loss Coefficient Values Resulting from the Passive and Semi-Active
Control Strategy for Minimum and Maximum Studied Averaging Time Values (𝐴𝑇) Compared to the Instantaneous Control Case (S7-Random Force,𝜇= 3.5%) ... 204 Fig. 5.20. RMS Hourly Structural Acceleration Response Values Using Passive and
xxii
Fig. 5.21. Peak Hourly Structural Acceleration Response Values Using Passive and Semi-Active Control Strategies (S7-Random Force,𝜇= 3.5%) ... 205 Fig. 5.22. Average Hourly and Peak Factor Values from the Passive and Semi-Active
Control Strategy [(𝐴𝑇= 60 min, 𝑈𝑇= 1.0 𝑇) & (𝐴𝑇= 𝑈𝑇=𝑇/296)] (S7-Random Force,𝜇= 3.5%) ... 205 Fig. 5.23. Peak Hourly Fluid Response Ratio at the TLD End Wall Resulting Using Passive
and Semi-Active Control Strategies (S7-Random Force,𝜇= 3.5%) ... 205 Fig. 5.24. Peak Hourly Fluid Response Ratio at the TLD End Wall Resulting from the
Passive Control Strategy for Various Random Forces (𝜇= 3.5%) ... 206 Fig. 5.25. Peak Hourly Fluid Response Ratio at the TLD End Wall Resulting from the
Semi-Active Control Strategy for Various Random Forces (𝜇= 3.5%, 𝐴𝑇= 60 min,
𝑈𝑇= 1.0 𝑇) ... 206 Fig. 6.1. (a) Gain Scheduling Concept; (b) Semi-Active Control Strategy in Tall Buildings
(from Yalla and Kareem 2003); and (c) Semi-Active Control Strategy Updated in This Study ... 233 Fig. 6.2. Floor Plan of the Indianapolis Building Showing the Statical System Consists of
(a) Real Slabs and Shear Walls; and (b) Frame Elements and Slab Beams Installed with Lumped Masses (kg) ... 234 Fig. 6.3. Mode Shapes of the Indianapolis Building for (a) Mode 1; (b) Mode 2; and (c)
Mode 3 ... 234 Fig. 6.4. Predicted Annual Extreme Upper Level (500 m) Wind Speed for Various Return
Periods (from BLWT-SS3-2007) ... 235 Fig. 6.5. RMS Structural Accelerations of the Indianapolis Building with No-TLDs
Installed in (a) the 𝑥-direction; and (b) in the 𝑦-direction (Return Period=10 Years) ... 235 Fig. 6.6. Influence of Averaging Time (AT) on RMS Structural Accelerations at the CM in
the x-direction (𝑈𝑇= 1.0 𝑇,𝜃𝑤= 210∘, Return Period=10 Years) ... 236 Fig. 6.7. Influence of Averaging Time (𝐴𝑇) on Screen Loss Coefficient Values of Mode 1
Tanks Placed at the 𝐶𝑀 in the 𝑥-direction (𝑈𝑇= 1.0 𝑇,𝜃𝑤 = 210∘, Return Period=10 Years) ... 236 Fig. 6.8. Influence of Updating Time (𝑈𝑇) on RMS Structural Accelerations at the 𝐶𝑀 in
the 𝑥-direction (𝐴𝑇 = 60 min,𝜃𝑤= 210∘, Return Period=10 Years) ... 236 Fig. 6.9. Influence of Updating Time (UT) on Screen Loss Coefficient Values of Mode 1
Tanks Placed at the 𝐶𝑀 in the 𝑥-direction (𝐴𝑇= 60 min,𝜃𝑤 = 210∘, Return Period=10 Years) ... 236 Fig. 6.10. RMS Structural Accelerations in the 𝑥-direction of the Indianapolis Building
Using (a) Passive TLD System; and (b) Semi-Active TLD System (𝐴𝑇 = 60 min,𝑈𝑇 = 1.0 𝑇, Return Period=10 Years) ... 237 Fig. 6.11. RMS Structural Accelerations in the 𝑦-direction of the Indianapolis Building
xxiii
Fig. 6.12. RMS Resultant Accelerations of the Indianapolis Building Using Semi-Active TLD System to Suppress the First 3 Modes (𝐴𝑇 = 60 min,𝑈𝑇= 1.0 𝑇, Return Period=10 Years) ... 238 Fig. 6.13. Percentage Reduction of RMS Resultant Accelerations of the Indianapolis
Building Using Semi-Active TLD System to Suppress the First 3 Modes (𝐴𝑇= 60 min,𝑈𝑇= 1.0 𝑇, Return Period=10 Years) ... 238 Fig. 6.14. Average Peak Hourly Resultant Accelerations Using (a) No-TLDs; (b) Passive
TLD System; and (c) Semi-Active TLD System (𝐴𝑇= 60 min,𝑈𝑇= 1.0 𝑇, Return Period=10 Years) ... 239 Fig. 6.15. Influence of Wind Loading Direction on RMS Structural Acceleration at the 𝐶𝑀
in the 𝑥-direction Using Semi-Active TLD System (𝐴𝑇= 60 min,𝑈𝑇= 1.0 𝑇, Return Period=10 Years) ... 240 Fig. 6.16. Influence of Wind Loading Direction on Screen Loss Coefficient of Mode 1 Tanks
Placed at the 𝐶𝑀 in the 𝑥-direction Using Semi-Active TLD System (𝐴𝑇= 60 min,𝑈𝑇 = 1.0 𝑇, Return Period=10 Years) ... 240 Fig. 6.17. Influence of Wind Loading Direction on Screen Loss Coefficient of Mode 2 Tanks
Placed at the 𝐶𝑀 in the 𝑦-direction Using Semi-Active TLD System (𝐴𝑇= 60 min,𝑈𝑇 = 1.0 𝑇, Return Period=10 Years) ... 240 Fig. 6.18. Influence of Wind Loading Direction on Screen Loss Coefficient of Mode 3 Tanks
Placed at 𝐶3 and 𝐶4 in the 𝑥-direction Using Semi-Active TLD System (𝐴𝑇= 60 min,𝑈𝑇 = 1.0 𝑇, Return Period=10 Years) ... 241 Fig. 6.19. Influence of Wind Loading Direction on Screen Loss Coefficient of Mode 3 Tanks
Placed at 𝐶3 and 𝐶4 in the 𝑦-direction Using Semi-Active TLD Ssytem (𝐴𝑇 = 60 min,𝑈𝑇 = 1.0 𝑇, Return Period=10 Years) ... 241 Fig. 6.20. RMS Resultant Accelerations (𝜃𝑤 = 210∘) over a Range of Serviceability (black)
and Strength (red) Return Periods Using (a) No-TLDs; and (b) Semi-Active TLD System (𝐴𝑇= 60 min,𝑈𝑇= 1.0 𝑇) ... 242 Fig. 6.21. Percentage Reduction of RMS Resultant Accelerations (𝜃𝑤= 210∘) over a Range
of Serviceability (black) and Strength (red) Return Periods Using (a) Passive TLD System; and (b) Semi-Active TLD System (𝐴𝑇 = 60 min,𝑈𝑇 = 1.0 𝑇) ... 242 Fig. 6.22. Average Peak Hourly Resultant Accelerations (𝜃𝑤 = 210∘) over a Range of
Serviceability (black) and Strength (red) Return Periods Using (a) No-TLDs; (b) Passive TLD System; and (c) Semi-Active TLD System (𝐴𝑇= 60 min,𝑈𝑇= 1.0 𝑇) ... 243 Fig. 6.23. Experimental Speed Profile (from van der Tempel 2006) ... 243 Fig. 6.24. Influence of Return Period on RMS Structural Acceleration at the 𝐶𝑀 of the
Indianapolis Building in the 𝑥-direction Using Semi-Active TLD System (𝐴𝑇= 60 min,𝑈𝑇= 1.0 𝑇,𝜃𝑤 = 210∘) ... 244 Fig. 6.25. Influence of Return Period on Screen Loss Coefficient of Mode 1 Tanks Placed at
the𝐶𝑀 in the 𝑥-direction Using Semi-Active TLD System (𝐴𝑇= 60 min,𝑈𝑇= 1.0 𝑇,𝜃𝑤= 210∘) ... 244 Fig. 6.26. Influence of Return Period on Screen Loss Coefficient of Mode 2 Tanks Placed at
xxiv
Fig. 6.27. Influence of Return Period on Screen Loss Coefficient of Mode 3 Tanks Placed at
𝐶3 and 𝐶4 in the 𝑥-direction Using Semi-Active TLD System (𝐴𝑇 = 60 min,𝑈𝑇 = 1.0 𝑇,𝜃𝑤= 210∘) ... 245 Fig. 6.28. Influence of Return Period on Screen Loss Coefficient of Mode 3 Tanks Placed at
𝐶2 and 𝐶3 in the 𝑦-direction Using Semi-Active TLD System (𝐴𝑇 = 60 min,𝑈𝑇 = 1.0 𝑇,𝜃𝑤= 210∘) ... 245
xxv
Nomenclature
List of Symbols
𝐴 Excitation amplitude
𝐴 Cross sectional area
𝐼𝑥 Moments of inertia in the 𝑥-direction
𝐼𝑦 Moments of inertia in the 𝑦-direction
𝐼𝑧 Moments of inertia in the 𝑧-direction
𝑥(𝑡) Displacement component in the 𝑥-direction - 3D beam element
𝑦(𝑡) Displacement component in the 𝑦-direction - 3D beam element
𝑧(𝑡) Displacement component in the 𝑧-direction - 3D beam element
𝑥̇(𝑡) Velocity component in the 𝑥-direction - 3D beam element
𝑦̇(𝑡) Velocity component in the 𝑦-direction - 3D beam element
𝑧̇(𝑡) Velocity component in the 𝑧-direction - 3D beam element
𝑥̈(𝑡) Acceleration component in the 𝑥-direction - 3D beam element
𝑦̈(𝑡) Acceleration component in the 𝑦-direction - 3D beam element
𝑧̈(𝑡) Acceleration component in the 𝑧-direction - 3D beam element
𝜃𝑥(𝑡) Rotational component in the 𝑥-direction - 3D beam element
𝜃𝑦(𝑡) Rotational component in the 𝑦-direction - 3D beam element
𝜃𝑧(𝑡) Rotational component in the 𝑧-direction - 3D beam element
𝜃̇𝑥(𝑡) Torsional velocity component in the 𝑥-direction - 3D beam element
𝜃̇𝑦(𝑡) Torsional velocity component in the 𝑦-direction - 3D beam element
𝜃̇𝑧(𝑡) Torsional velocity component in the 𝑧-direction - 3D beam element
𝜃̈𝑥(𝑡) Torsional acceleration component in the 𝑥-direction - 3D beam element
𝜃̈𝑦(𝑡) Torsional acceleration component in the 𝑦-direction - 3D beam element
xxvi
∆𝑡 Time Step
𝑇 Time period
𝑡 Time
𝑃∘ Sinusoidal force amplitude
𝑓𝑠 Natural frequency of the primary structure
𝑓𝑒𝑥 Excitation frequency
𝑓𝑇𝐿𝐷 Nonlinear natural frequency of the damper
𝑔 Gravitational acceleration
ℎ Water depth
𝑘𝑇𝐿𝐷 Damper Stiffness
𝐿 Tank Length
𝑏 Tank width
𝐿𝑥 2D Tank length in 𝑥-direction
𝐿𝑦 2D Tank length in 𝑦-direction
𝑖 Integer value associated with different sloshing modes
𝑗 Integer value associated with different sloshing modes
𝑚𝑇𝐿𝐷 Nonlinear TLD mass
𝑀 Mass of the primary structure
𝑚∘ Non-participating (rigid) portion of fluid mass
𝑛 Integer value associated with different modes/harmonics
𝑓𝑤 Fundamental sloshing frequency
𝛺 Tuning ratio
𝑀∗ Generalized mass
𝐾∗ Generalized stiffness
𝐶∗ Generalized damping
xxvii
𝑣𝑤 Kinematic viscosity of water
𝜁𝑇𝐿𝐷 Damping ratio of TLD (% critical)
𝜁𝑒𝑓𝑓 Effective Damping (% critical)
𝜁𝑠 Equivalent viscous damping of the structure (% critical)
∆𝑝 Pressure drop across damping screens
𝑃𝐹 Peak factor
𝐶𝑙 Pressure loss coefficient of vertical damping screen
𝐶𝜃 Pressure loss coefficient of inclined damping screen
𝐴𝑠 Solid Area of damping screens submerged in water
𝑐𝑇𝐿𝐷 Nonlinear damping of the damper
𝑋̈ Horizontal base excitation acceleration of the tank
𝜁𝑤 Viscous damping coefficient
𝑈𝐷𝑆 Average horizontal water velocity at damping screens
𝑢 Average horizontal water particle velocity
𝜂 Free surface elevation or wave height
𝐶𝑑 Drag coefficient
𝐸𝑑 Energy dissipation by equivalent damper
�𝐻𝑧 𝑥⁄ (𝑓)� Frequency response function
𝜃𝑧/𝑥 Phase angle between output 𝑧 to input 𝑥
[𝑀𝑠] Mass Matrix of 3D-Structure
[𝐾𝑠] Stiffness Matrix of 3D-Structure
[𝐶𝑠] Damping Matrix of 3D-Structure
{𝐹𝑎} Vector of the applied external dynamic loads acting on the 3D-Structure
𝐹𝑇𝐿𝐷 TLD base shear force
𝑥𝑠 Maximum structural displacement amplitude experienced at the TLD location and in
xxviii
𝑥𝑠̈ Instantaneous structural acceleration at the TLD location and in its placement direction
𝐴𝑐𝑦𝑐𝑙𝑒 Complete structural response cycle at the TLD location and in its placement direction
𝑃1 Peak displacement value during the 1st half structural response cycle at the TLD location and in its placement direction
𝑃2 Peak displacement value during the 2nd half structural response cycle at the TLD location and in its placement direction
𝐹𝑚𝑎𝑥 Maximum amplitude excitation
𝐶𝑀 Centre of mass of the actual 38-story high-rise building
𝐶𝑇 Centre of twist of the actual 38-story high-rise building
𝜃𝑤 Wind loading angle (degree)
𝑥̈ Average peak hourly acceleration response in 𝑥-direction
𝑦̈ Average peak hourly acceleration response in 𝑦-direction
𝜎𝑥̈ RMS of structural acceleration response in 𝑥-direction
𝜎𝑦̈ RMS of structural acceleration response in 𝑦-direction
𝑅𝑝𝑒𝑎𝑘−ℎ𝑟 Average peak hourly of structural resultant acceleration response
𝑃𝐹𝑥 Peak factor in 𝑥-direction
𝑃𝐹𝑦 Peak factor in 𝑦-direction
𝜙 Normalized modal deflection value of the structure at the TLD location
𝑆 Screen solidity ratio
𝐴𝑠 Solid Area of damping screen submerged in water
𝜎𝑥̈−𝑡𝑎𝑟𝑔𝑒𝑡 Target RMS structural acceleration response in 𝑥-direction
𝜎𝑦̈−𝑡𝑎𝑟𝑔𝑒𝑡 Target RMS structural acceleration response in 𝑦-direction
𝑥̈𝑖𝑛𝑖𝑡𝑖𝑎𝑙 Initial average peak hourly structural acceleration response in 𝑥-direction
𝑦̈𝑖𝑛𝑖𝑡𝑖𝑎𝑙 Initial average peak hourly structural acceleration response in 𝑦-direction
𝑥̈𝑡𝑎𝑟𝑔𝑒𝑡 Target average peak hourly structural acceleration response in 𝑥-direction
xxix
𝜁𝑒𝑓𝑓−𝑜𝑝𝑡 Optimal effective damping (% critical)
𝜎𝑥̈−𝑡𝑎𝑟𝑔𝑒𝑡−𝑚 Target modal RMS structural acceleration response component in 𝑥-direction
𝜎𝑦̈−𝑡𝑎𝑟𝑔𝑒𝑡−𝑚 Target modal RMS structural acceleration response component in 𝑦-direction
𝜎𝑥̈−𝑖𝑛𝑖𝑡𝑖𝑎𝑙−𝑚 Initial modal RMS structural acceleration response component in 𝑥-direction
𝜎𝑦̈−𝑖𝑛𝑖𝑡𝑖𝑎𝑙−𝑚 Initial modal RMS structural acceleration response component in 𝑦-direction
𝜃 Inclination angle of the damping screens
𝜁𝑜𝑝𝑡 Optimal TLD Damping ratio (% critical)
𝑀𝐹 Modal Factor
𝑇𝑠−𝑥 Structural time period in 𝑥-direction
𝑇𝑠−𝑦 Structural time period in 𝑦-direction
𝑓𝑠−𝑥 Structural cyclic frequency in 𝑥-direction
𝑓𝑠−𝑦 Structural cyclic frequency in 𝑦-direction
𝜔𝑠−𝑥 Structural natural frequency in 𝑥-direction
𝜔𝑠−𝑦 Structural natural frequency in 𝑦-direction
𝜁𝑇𝐿𝐷−𝑒𝑓𝑓−𝑜𝑝𝑡𝑥 Optimal effective damping provided by TLD in 𝑥-direction
𝜁𝑇𝐿𝐷−𝑒𝑓𝑓−𝑜𝑝𝑡𝑦 Optimal effective damping provided by TLD in 𝑦-direction
𝜁𝑇𝐿𝐷−𝑜𝑝𝑡𝑥 Optimal TLD damping ratio in 𝑥-direction
𝜁𝑇𝐿𝐷−𝑜𝑝𝑡𝑦 Optimal TLD damping ratio in 𝑦-direction
𝛺𝑜𝑝𝑡𝑥 Optimal tuning ratio in 𝑥-direction
𝛺𝑜𝑝𝑡𝑦 Optimal tuning ratio in 𝑦-direction
𝑓𝑇𝐿𝐷−𝑜𝑝𝑡𝑥 Optimal TLD cyclic frequency in 𝑥-direction
𝑓𝑇𝐿𝐷−𝑜𝑝𝑡𝑦 Optimal TLD cyclic frequency in 𝑦-direction
𝑅𝑜𝑝𝑡𝑥 Optimal TLD response ratio in 𝑥-direction
𝑅𝑜𝑝𝑡𝑦 Optimal TLD response ratio in 𝑦-direction
xxx
𝜁𝑡𝑜𝑡−𝑦 Total damping of structure in 𝑦-direction
𝜎𝑥−𝑡𝑎𝑟𝑔𝑒𝑡−𝑚 Target modal RMS structural displacement response component in 𝑥-direction
𝜎𝑦−𝑡𝑎𝑟𝑔𝑒𝑡−𝑚 Target modal RMS structural displacement response component in 𝑦-direction
𝜎𝑟−𝑥 TLD response in 𝑥-direction
𝜎𝑟−𝑦 TLD response in 𝑦-direction
𝐶𝐷 Drag coefficient
𝐶𝑐 Contraction Coefficient
𝐹𝐷 Drag force
𝜌 Density of water
𝛹 Flow deflection angle
𝑈∘ Average fluid velocity throughout the depth
𝛾𝜃 Reduction in losses as a fraction of the losses for a vertical screen
𝐸𝑤′ TLD non-dimensional energy dissipation
𝜂′ Non-dimensional free-surface amplitude
𝜂 Free-surface response amplitude
𝛬 Non-dimensional excitation amplitude
𝐴 Applied excitation amplitude
𝛽 Excitation frequency ratio
𝑓𝑛=𝜔𝑛/2𝜋 Natural sloshing frequency
𝐹𝑤′(𝑡) Non-dimensional base shear force
𝐹𝑤(𝑡) Base shear force produced by the nonlinear TLD fluid model
𝐸𝑤′ Non-dimensional energy dissipation per cycle
𝑇 Applied excitation period
𝜓 Efficiency of a TLD
𝑥̈𝑝𝑒𝑎𝑘−ℎ𝑟 Peak hourly structural acceleration response in 𝑥-direction
xxxi
𝑅 Percentage response reduction values of the average peak hourly resultant
accelerations
𝑇𝑑 Duration time in seconds used to calculate the peak factor
𝑆𝐹 Scale factor
𝑥̈𝑡𝑎𝑟𝑔𝑒𝑡−𝑚𝑖𝑛 Minimum target peak hourly structural acceleration response in 𝑥-direction
𝑥̈𝑡𝑎𝑟𝑔𝑒𝑡−𝑚𝑎𝑥 Maximum target peak hourly structural acceleration response in 𝑥-direction
𝐴𝑇 Averaging time used in the gain schedule scheme
𝑈𝑇 Updating time used in the gain schedule scheme
𝐼𝑇 Initial time used in the gain schedule scheme
𝜎𝑥̈−𝑡𝑎𝑟𝑔𝑒𝑡−𝑚𝑎𝑥 Maximum target RMS structural acceleration response in 𝑥-direction
𝜎𝑦̈−𝑡𝑎𝑟𝑔𝑒𝑡−𝑚𝑎𝑥 Maximum target RMS structural acceleration response in 𝑦-direction
𝜎𝑥̈−𝑡𝑎𝑟𝑔𝑒𝑡−𝑚𝑖𝑛 Minimum target RMS structural acceleration response in 𝑥-direction
𝜎𝑦̈−𝑡𝑎𝑟𝑔𝑒𝑡−𝑚𝑖𝑛 Minimum target RMS structural acceleration response in 𝑦-direction
𝐶𝑙−𝑚𝑎𝑥 Maximum damping screen loss coefficient value
𝐶𝑙−𝑚𝑖𝑛 Minimum damping screen loss coefficient value
𝜃𝑚𝑎𝑥 Maximum inclination angle of the damping screen
𝑃𝑉 Peak hourly acceleration response values for the 1/10 scale model
𝐶1 Corner 1 of the high-rise building (𝑧= 154.6 m)
𝐶2 Corner 2 of the high-rise building (𝑧= 154.6 m)
𝐶3 Corner 3 of the high-rise building (𝑧= 154.6 m)
𝐶4 Corner 4 of the high-rise building (𝑧= 154.6 m)
𝜎𝑥̈−𝑡𝑎𝑟𝑔𝑒𝑡−𝑡 Total target RMS acceleration response value in 𝑥-direction
𝜎𝑦̈−𝑡𝑎𝑟𝑔𝑒𝑡−𝑡 Total target RMS acceleration response value in 𝑦-direction
𝐶𝜃𝑥1 Damping screen loss coefficient value for mode 1 tanks in 𝑥-direction
𝐶𝑙𝑥−𝑚𝑎𝑥1 Maximum damping screen loss coefficient value for mode 1 tanks in 𝑥-direction
xxxii
𝜃𝑥1 Damping screen inclination angle value for mode 1 tanks in 𝑥-direction
𝜃𝑥−𝑚𝑎𝑥1 Maximum damping screen inclination angle value for mode 1 tanks in 𝑥-direction
𝜃𝑥−𝑚𝑖𝑛1 Minimum damping screen’s inclination angle for mode 1 tanks in 𝑥-direction
𝐶𝜃𝑦2 Damping screen loss coefficient value for mode 2 tanks in 𝑦-direction
𝐶𝑙𝑦−𝑚𝑎𝑥2 Maximum damping screen loss coefficient value for mode 2 tanks in 𝑦-direction
𝐶𝑙𝑦−𝑚𝑖𝑛2 Minimum damping screen loss coefficient value for mode 2 tanks in 𝑦-direction
𝜃𝑦2 Damping screen inclination angle value for mode 2 tanks in 𝑦-direction
𝜃𝑦−𝑚𝑎𝑥2 Maximum damping screen inclination angle value for mode 2 tanks in 𝑦-direction
𝜃𝑦−𝑚𝑖𝑛2 Minimum damping screen inclination angle value for mode 2 tanks in 𝑦-direction
𝐶𝜃𝑥3 Screen loss coefficient value for mode 3 tanks in 𝑥-direction
𝐶𝑙𝑥−𝑚𝑎𝑥3 Maximum damping screen loss coefficient value for mode 3 tanks in 𝑥-direction
𝐶𝑙𝑥−𝑚𝑖𝑛3 Minimum damping screen loss coefficient value for mode 3 tanks in 𝑥-direction
𝜃𝑥3 Damping screen’s inclination angle for mode 3 tanks in 𝑥-direction
𝜃𝑥−𝑚𝑎𝑥3 Maximum damping screen’s inclination angle for mode 3 tanks in 𝑥-direction
𝜃𝑥−𝑚𝑖𝑛3 Minimum damping screen’s inclination angle for mode 3 tanks in 𝑥-direction
𝐶𝜃𝑦3 Screen loss coefficient value for mode 3 tanks in 𝑦-direction
𝐶𝑙𝑦−𝑚𝑎𝑥3 Maximum damping screen loss coefficient value for mode 3 tanks in 𝑦-direction
𝐶𝑙𝑦−𝑚𝑖𝑛3 Minimum damping screen loss coefficient value for mode 3 tanks in 𝑦-direction
𝜃𝑦3 Damping screen inclination angle value for mode 3 tanks in 𝑦-direction
𝜃𝑦−𝑚𝑎𝑥3 Maximum damping screen inclination angle value for mode 3 tanks in 𝑦-direction
𝜃𝑦−𝑚𝑖𝑛3 Minimum damping screen inclination angle value for mode 3 tanks in 𝑦-direction
𝑅𝑅𝑀𝑆 Resultant acceleration value of RMS structural acceleration response
𝐶𝑙𝑥−𝑝𝑎𝑠𝑠𝑖𝑣𝑒1 Passive damping screen loss coefficient value for mode 1 tanks in 𝑥-direction
𝐶𝑙𝑦−𝑝𝑎𝑠𝑠𝑖𝑣𝑒2 Passive damping screen loss coefficient value for mode 2 tanks in 𝑦-direction
xxxiii
𝐶𝑙𝑦−𝑝𝑎𝑠𝑠𝑖𝑣𝑒3 Passive damping screen loss coefficient value for mode 3 tanks in 𝑦-direction
𝐶𝜃𝑥1−𝑎𝑣𝑒𝑟𝑎𝑔𝑒 Average damping screens loss coefficient value for mode 1 tanks in 𝑥-direction
𝐶𝜃𝑦2−𝑎𝑣𝑒𝑟𝑎𝑔𝑒 Average damping screens loss coefficient value for mode 2 tanks in 𝑦-direction
𝐶𝜃𝑥3−𝑎𝑣𝑒𝑟𝑎𝑔𝑒 Average damping screens loss coefficient value for mode 3 tanks in 𝑥-direction
𝐶𝜃𝑦3−𝑎𝑣𝑒𝑟𝑎𝑔𝑒 Average damping screens loss coefficient value for mode 3 tanks in 𝑦-direction
Superscripts
𝐴 Excitation amplitude
𝐸𝑑′ Theoretical expression to match both the maximum value of the energy dissipated and the total energy dissipated over the range of frequency tested
𝑀∗ Generalized properties of 𝑀
𝑥̇ First time derivative of 𝑥
𝑥̈ Second time derivative of 𝑥
Subscripts
𝐴 Excitation amplitude
TLD Tuned Liquid Damper
TMD Tuned Mass Damper
𝑜𝑝𝑡 Optimal
𝑤 Water
𝑥 𝑥-axis
𝑦 𝑦-axis
𝑧 𝑧-axis
𝑒𝑓𝑓 Effective
𝑟 𝑟-axis (Local coordinate system)
xxxiv
𝑡 𝑡-axis (Local coordinate system)
Abbreviations
DVA Dynamic Vibration Absorber
EADTMD Equivalent Amplitude Dependent Tuned Mass Damper
SDOF Single Degree of Freedom
TMD Tuned Mass Damper
TLD Tuned Liquid Damper
SA-TLD Semi-Active Tuned Liquid Damper
SA-MTLD Semi-Active Multiple Tuned Liquid Dampers
MTLD Multiple Tuned Liquid Dampers
3D-Structure Three Dimensional Structure
DOF Degree of freedom
SHARCNET ™ Shared Hierarchical Academic Research Computing Network
NBC National Building Code of Canada
BLWTL Boundary layer wind tunnel laboratory
ASCE American Society of Civil Engineers
RMS Root-mean-square
MR-TLCD Semi-active TLCD using magneto-rheological fluid
1D TLD Uni-directional TLD
Chapter 1: Introduction
1.1. General Overview
Implementation of supplemental damping systems (i.e. the dynamic vibration absorbers,
DVAs) to mitigate excessive building vibrations induced by external dynamic loads (i.e.
wind storms and earthquakes) has increased over the last several decades. A DVA increases
the effective damping of a structure by dissipating a portion of the energy when it is
subjected to movement, thus a portion of the energy transmitted to the primary structure by
the external forces is dissipated. Considerations when designing high-rise structures are the
utilization of space, prevention of urban sprawl and an efficient use of resources, especially
when buildings are often built to accommodate the urban economic core. Therefore, as new
structures become taller, lighter, more flexible and lightly damped, which magnifies their
sensitivity to dynamic excitation, this leads to additional design considerations in order to
satisfy both strength and serviceability requirements.
1.2. Categorization of Structural Response Mitigation Systems
Soong and Dargush 1997 divided structural response mitigation systems into three main
categories; isolation, passive and semi-active/active systems. Table 1.1 shows examples of
systems that belong to each of these categories. Isolation systems isolate the structure from
input excitation (i.e. earthquake) and are typically located at the foundation level. The first
four systems listed in the middle column of Table 1.1 represent direct passive energy
dissipation systems. Direct energy dissipation mechanisms include the flow of a highly
viscous fluid through an orifice and the shearing action of a polymeric/rubber-like material in
viscoelastic dampers (Kareem et al. 1999). Indirect energy dissipation mechanisms consist of
a secondary auxiliary system that provides effective damping by modifying the frequency
response characteristics of the structure (Kareem 1983). Semi-active and active control
systems offer improved performance over traditional passive systems.
Housner et al. (1997) described different energy dissipation systems utilized for structural
control including active, semi-active, passive and hybrid systems. Kareem et al. (1999)
described different control systems installed in various buildings around the globe. Soong
and Spencer (2002) summarized the state of the art of different energy dissipation systems
and their structural applications. The main reason to implement a control system in a building
wind and earthquakes. Schematic diagrams of various energy dissipation systems are shown
in Figure 1.1 and discussed briefly in the following sections.
1.2.1 Active Control Systems
An active control system is one that uses an external power source to drive actuator(s)
that apply forces to the structure in a prescribed manner. These forces can be used to both
add and dissipate energy (Housner et al. 1997). In an active feedback control system, the
signals sent to the control actuators, which are measured with physical sensors (optical,
mechanical, electrical, chemical, etc.), are a function of the response of the structure. The
effectiveness of an active control system could be compromised due to a loss of power
during the loading event. As shown in Figure 1.1a, based on the measured excitation, the
controller introduces a control force to the secondary mass through the actuator to counteract
the structure’s motion. Although, active control systems have been implemented in the fields
of mechanical and electrical engineering for a considerable period of time, applications in
civil engineering are much more recent. Soong (1988) and Housner et al. (1996) describe the
development of various active control systems and their uses in civil engineering.
1.2.2 Passive Control Systems
A passive control system does not require an external power source, which is the main
advantage of this system type relative to an active control system (see Figure 1.1b). Passive
control systems impart forces that develop in response to the motion of the structure. The
main function of a passive control system is to alter the characteristics of the structure such
as its damping and/or stiffness. Tuned mass dampers (TMD), tuned liquid column dampers
(TLCD) and tuned liquid dampers (TLD) represent common dynamic vibration absorber
passive control systems. Due to their simplicity and efficiency in reducing structural
response, these passive control systems are commonly used in civil engineering applications.
TMD, TLCD and TLD involve adding an auxiliary system to the primary system. Their basic
function is to dissipate a portion of the input energy from the external excitation source (i.e.
wind or earthquake), thereby, reducing the energy dissipation demand on the primary
1.2.3 Hybrid Control Systems
The hybrid control system typically implies the combined use of active and passive
control systems. For example, a structure equipped with distributed viscoelastic damping
supplemented with an active mass damper on or near the top of the structure, or a base
isolated structure with actively controlled actuators to enhance performance (Housner et al.
1997). As shown in Figure 1.1c, a tertiary mass is connected to the auxiliary secondary mass
using a spring, damper and actuator. The motion of the secondary mass system is set and
magnified by the active tertiary mass, making it more efficient. In this system, the active
control is used only during large amplitude structural excitation. In the event of power
failure, or extreme excitation, the system automatically switches to a passive control system,
thus eliminating the risk of total system failure. Most of the applications of hybrid control
systems have been in Japan (see Section 1.8 for full-scale application examples). A reduction
of about 50% of uncontrolled structural response due to the addition of the hybrid control
systems was reported in Kareem et al. (1999).
1.2.4 Semi-Active Control Systems
Semi-active control systems are a class of control systems for which the external energy
requirements are typically orders of magnitude smaller than that of active control systems.
Semi-active control systems do not add significant amounts of mechanical energy to the
structural system (including the structure and the control actuators), therefore bounded-input
bounded-output stability is guaranteed (Housner et al. 1997). Semi-active control systems are
often viewed as controllable passive systems. Researchers have developed this control
system by combining the best features of active and passive control systems. For a
semi-active control system, the properties of the auxiliary system are altered and optimized during
the time history to achieve improved efficiency of the semi-active system leading to
maximum structural response reduction. Examples of such semi-active systems include
variable-orifice fluid dampers, variable-stiffness systems, controllable friction systems,
controllable fluid dampers and controllable impact dampers (see Section 1.8 for full-scale
application examples).
Spencer and Soong (1999) describe structures with various control schemes as shown in
Figure 1.2. When only the structural response variables are measured, the control