Constrained caloric curves
for hot nuclei
B. Borderie1, S. Piantelli2, M.-F. Rivet1 and Ad. R. Raduta3
for the INDRA Collaboration
1Institut de Physique Nucl´eaire, CNRS/IN2P3, Univ. Paris-Sud 11,
Orsay, France
2Sezione INFN, Sesto Fiorentino (Fi), Italy 3National Institute for Physics and Nuclear Engineering,
Bucharest-M˘agurele, Romania
Abstract
Simulations based on experimental data obtained from multifrag-menting quasi-fused nuclei produced in central129Xe +natSn collisions
have been used to deduce event by event freeze-out properties on the thermal excitation energy range 4-12 AMeV. From such properties, information on constrained caloric curves has been derived. At con-stant average volumes caloric curves exhibit a monotonous behaviour whereas for constrained pressures backbending is observed. Such re-sults support the existence of a first order phase transition for hot nuclei.
1
Introduction
like negative microcanonical heat capacity and bimodalities [2–4]. Corre-lated temperature and excitation energy measurements, commonly termed caloric curves, were the first studied possible signatures of phase transition. However in spite of the observation of a plateau in some caloric curves, no decisive conclusion was extracted [1, 5–7]. The reason is that experimen-tally it is not possible to explore the caloric curves at constant pressure or constant average volume, which is required for an unambiguous phase transition signature. Indeed, theoretical studies show that if many differ-ent caloric curves can be generated depending on the path followed in the thermodynamical variable plane, constrained caloric curves exhibit different behaviours in presence of a first order phase transition: a monotonous evolu-tion at constant average volume and a back bending of curves at constained pressures [8, 9]. With the help of a simulation able to carefully reproduce all the experimental observables measured for hot nuclei formed in central colli-sions (quasi-fused systems, QF, from129Xe+natSn, 32-50 AMeV), event by event properties at freeze-out were restored and used to build constrained caloric curves. The definition of pressure in the microcanonical framework is presented in section 2. Then, in section 3, simulations to recover freeze-out properties of multifragmentation events are briefly described [10, 11]. The deduced constrained caloric curves are presented in section 4. In section 5, the classical thermometer derived from simulations is discussed and a more quantum approach is proposed to produce final constrained caloric curves.
2
Pressure in the microcanonical framework
Let us consider a gas of weakly interacting fragments (i.e. they interact only by Coulomb and excluded volume), which corresponds to the freeze-out configuration. Within a microcanonical ensemble, the statistical width
of a configuration C, defined by the mass, charge and internal excitation
energy of each of the constituting MC fragments, writes
WC(A, Z, E, V) = 1 MC!
χVMC MC
n=1
ρn(n)
h3 (mAn) 3/2
2π Γ(3/2(MC −2))
1
(detI)
(2πK)3/2MC−4
(mA)3/2 , (1)
where I is the moment of inertia,K is the thermal kinetic energy, V is the
freeze-out volume and χVMC stands for the free volume or, equivalently,
The microcanonical equations of state are T = ∂S ∂E −1 |V,A,
P/T =
∂S ∂V
|E,A,
−μ/T =
∂S ∂A
|E,V. (2)
Taking now into account that S = lnZ = lnCWC and that
∂WC/∂V = (MC/V)WC it comes out that
P/T =
∂S ∂V
= 1
CWC
C ∂WC ∂V = 1 V
CMCWC
CWC
= < MC >
V . (3)
The microcanonical temperature is also easily deduced from its statistical definition [12]: T = ∂S ∂E −1
= ( 1
CWC
C
WC(3/2MC −5/2)/K)−1
= <(3/2MC −5/2)/K >−1 . (4)
where K is the total thermal kinetic energy of the system at freeze-out. AsMC, the total multiplicity at freeze-out, is large, the pressure P can be well approximated by
P = 2 3
< K >
V .
3
Event by event freeze-out properties
event, in the reaction centre of mass, from all the fragments and twice the charged particles emitted in the range 60−120◦ in order to exclude a major part of pre-equilibrium emission. Dressed excited fragments, which in flight statistically deexcite, and particles at freeze-out are described by spheres at normal density. Four free parameters are used to recover the data at each in-cident energy: the percentage of measured particles which were evaporated from primary fragments, the collective radial energy, a minimum distance between the surface of products at freeze-out and a limiting temperature for fragments. Such a limiting temperature, related to the vanishing of level density for fragments [13], was mandatory to reproduce the observed widths of fragment velocities. Indeed, Coulomb repulsions plus collective energy plus thermal kinetic energy (directed at random) plus spreading due to frag-ment decays are responsible for about 60-70% of the observed widths. By introducing a limiting temperature for fragments, thermal kinetic increases, due to energy conservation, which produces the missing percentage for the widths of final velocity distributions. The agreement between experimen-tal and simulated velocity/energy spectra for fragments/charged particles and for the different beam energies is quite remarkable (see figures 3 and 5 of [11]). Relative velocities between fragment pairs were also compared through reduced relative velocity correlation functions [14, 15] (see figure 4 of [11] ). Again a good agreement is obtained between experimental data and simulations, which indicates that the retained method (freeze-out topol-ogy built up at random) and parameters are sufficiently relevant to correctly describe the freeze-out configurations, including volumes. From the simula-tions it is then possible to recover, event by event, the different quantities needed to build constrained caloric curves, namely the thermal excitation energy of QF hot nuclei,E∗(total excitation minus collective energy), the ki-netic temperatureTkin at freeze-out, the freeze-out volumeV (see envelopes of figure 8 from [11]) and the total thermal kinetic energy at freeze-outK.
4
Constrained caloric curves
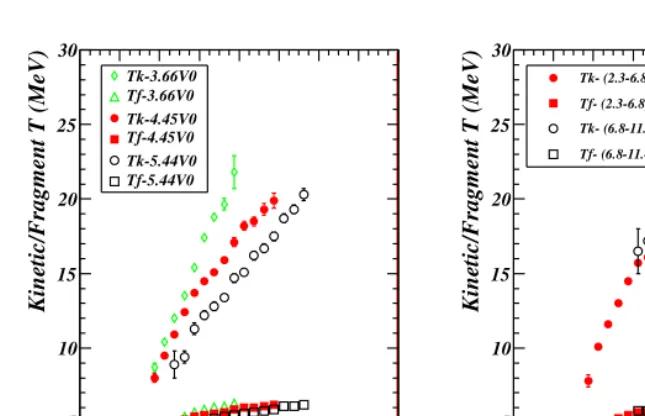
Constrained caloric curves, which correspond to correlated values ofE∗ and Tkin have been determined for QF hot nuclei with Z restricted to the range 80-100, which corresponds to the A domain 194-238 in order to reduce any possible effect of mass variation on caloric curves [7]. In fig. 1 (left) we have constructed caloric curves for different average freeze-out volumes cor-responding to the three ranges 3.0-4.0V0, 4.0-5.0V0 and 5.0-6.0V0 where V0
E* (A MeV)
0 2 4 6 8 10 12 14 16
Kinetic/Fragment T (MeV)
0 5 10 15 20 25 30
Tk-3.66V0 Tf-3.66V0 Tk-4.45V0 Tf-4.45V0 Tk-5.44V0 Tf-5.44V0
E* (A MeV)
0 2 4 6 8 10 12 14 16
Kinetic/Fragment T (MeV)
0 5 10 15 20 25 30
3
MeV/fm
-2
Tk- (2.3-6.8) 10
3
MeV/fm
-2
Tf- (2.3-6.8) 10
3
MeV/fm
-2
Tk- (6.8-11.4) 10
3
MeV/fm
-2
Tf- (6.8-11.4) 10
Figure 1: (Colour online) Caloric curves (kinetic temperature versus thermal ex-citation energy) constrained at average volumes (left) and for selected ranges of pressure (right) and the corresponding internal temperatures for fragments.
cally expected a monotonous behaviour of caloric curves is observed. Curves for fragment temperatures are also shown in the figure. Fig. 1 (right) shows the caloric curves when pressure has been constrained within two domains: 2.3-6.8 and 6.8-11.4 10−2 MeVfm−3. Backbending are clearly seen and more-over the qualitative evolution of curves with increasing pressure exactly cor-responds to what is theoretically predicted with a microcanonical lattice gas model [8]. As in fig. 1 (left) the evolution of fragment temperatures is also reported. By extrapolating at higher pressures caloric curves of fig. 1 (right), one could infer a critical temperature around 20 MeV. Such a value is within the range calculated for infinite nuclear matter whereas a much lower value is expected for nuclei in relation with surface and Coulomb effects [1].
5
Discussion and conclusion
multi-E* (A MeV) 0 2 4 6 8 10 12 14 16
HeLi/Kin. T (MeV)
0 5 10 15 20 25 30
THeLi
Tkin
Figure 2: (Colour online) Caloric curves with two different thermome-ters: Tkin andTHeLi(see text).
plicities experimentally observed for3He and Li isotopes and the high degree of completeness required for QF nuclei, which reduces the number of events, introduce large temperature error bars and prevent any construction of con-strained caloric curves. However one can build the caloric curve without constraints to be compared to the same curve using Tkin. Results are
dis-played in fig. 2. THeLi exhibits a plateau around 6-7 MeV up toE∗ ≈9-10
AMeV in agreement with [7] whereas Tkin increases from 7 to 17 MeV in
the same E∗ range. Secondly, and most important, we must recall that
dis-persions in fragment transverse momentum spectra generated in projectile fragmentation were succesfully explained by adding the Fermi momenta of individual nucleons in fragments [16], which is a consequence of the quantum nature of nucleons. For multifragmentation reactions a similar approach was first proposed in [17] to qualitatively explain the different temperatures ob-tained from various observables (kinetic energies, level populations, isotope ratios). Very recently a thermometer based on quantum fluctuations was proposed [18]. Using Fermi-Dirac distribution, proton momentum fluctu-ations at finite temperature are calculated and show an evident difference with respect to a classical calculation. Even at zero temperature and ground state density, fluctuations arise from the Fermi motion whereas at sufficient
E∗ protons at freeze-out are emitted with quantum fluctuations. The last
step of this work will be to produce constrained caloric curves using this thermometer for momentum fluctuations of protons emitted at freeze-out, and related densities to confirm, we hope, the present results.
References
[1] B. Borderie, J. Phys. G: Nucl. Part. Phys. 28(2002) R217.
[2] P. Chomaz, F. Gulminelli et al. (eds.) vol. 30 of Eur. Phys. J. A,
Springer, 2006.
[3] B. Borderie and M. F. Rivet, Prog. Part. Nucl. Phys.61 (2008) 551.
[4] E.Bonnet, D. Mercier et al. (INDRA Collaboration), Phys. Rev. Lett.
103(2009) 072701.
[5] J. Pochodzalla, T. Mhlenkamp et al. (ALADIN Collaboration), Phys.
Rev. Lett.75(1995) 1040.
[6] Y. G. Ma, A. Siwek et al. (INDRA Collaboration), Phys. Lett. B 390
(1997) 41.
[7] J. B. Natowitz, R. Wada et al., Phys. Rev. C 65(2002) 034618.
[8] P. Chomaz, V. Duflot and F. Gulminelli, Phys. Rev. Lett. 85 (2000)
3587.
[9] T. Furuta and A. Ono, Phys. Rev.C 74(2006) 014612.
[10] S. Piantelli, N. Le Neindre et al. (INDRA Collaboration), Phys. Lett.
B 627(2005) 18.
[11] S. Piantelli, B. Borderie et al. (INDRA Collaboration), Nucl. Phys. A
809 (2008) 111.
[12] A. H. Raduta and A. R. Raduta, Nucl. Phys.A 703(2002) 876.
[13] S. E. Koonin and J. Randrup, Nucl. Phys.A 474(1987) 173.
[14] Y. D. Kim, R. T. de Souza et al., Phys. Rev.C 45 (1992) 338.
[15] G. T˘ab˘acaru, M. F. Rivet et al. (INDRA Collaboration), Nucl. Phys.
A 764(2006) 371.
[16] A. S. Goldhaber,Phys. Lett. B 53 (1974) 306.
[17] W. Bauer,Phys. Rev. C 51(1995) 803.