Available Online at www.ijcsmc.com
International Journal of Computer Science and Mobile Computing
A Monthly Journal of Computer Science and Information Technology
ISSN 2320–088X
IMPACT FACTOR: 6.017IJCSMC, Vol. 6, Issue. 12, December 2017, pg.78 – 83
Classifying Human Walking Patterns using
Accelerometer Data from Smartphone
Akram Bayat
1, Amir Hossein Bayat
2, Amir Sina Ghasemi
3 ¹ Department of Computer Science, University of Massachusetts Boston, USA ² Department of Computer Engineering, Iran University of Science & Technology, Iran³ Department of Computer Science, Azad University of Zanjan, Iran
1
[email protected]; 2 [email protected]; 3 [email protected]
Abstract— This paper presents a study on identifying different individuals using accelerometer data from a smartphone presented on their walking patterns. The identifier algorithm was trained and evaluated in an experiment with twenty human subjects including 12 males and 8 females in real-world conditions. Various classifiers were tested using descriptive statistical features. Our model recognizes patterns and regularities in human walking movement using limited accelerometer data captured from a mobile device. The accelerometer data are decomposed into gravitational acceleration and body motion acceleration using a low pass filter, and then extracted features of those acceleration components is fed to multi-class classifiers. The proposed model is developed based on an informative and stable body acceleration feature set that gives rise to a high performance multi-class identification model. The results show that using the Decision tables as our classification method enables the identification to be made in overall accuracy rate of 98.45%.
Keywords— Human walking style, Pattern recognition, User identification, Accelerometer data
I. INTRODUCTION
and outdoor scenarios. Using walking style for different applications, such as healthcare or identification tasks using computer-vision based techniques or multiple wearable sensors, have been studied in recent years (for example, works of Mannini and Sabatin in [2] or Davis in [6]). However, our approach differs from earlier recognition methods as follows: First, we use a very simple process of recognition that can be adapted to general task identification by employing only an accelerometer built into the smartphone. Second, our powerful features allow us to reliably distinguish individuals based on differences in their walking patterns through very simple classifiers. Furthermore, considering multiple scenarios for the walking experiment decreases the effect of environmental factors on the identification process. Last but not least, we apply a simple multi-class classifier that can distinguish users based on their movement style with high accuracy, very low false acceptance rate and false rejection rates.
The rest of the paper is organized as follows: In the next section we outline the related work. In Section III, we give an overview over the experimental design, data collection, and the extracted features. The classification methods and performance evaluation are described in Sections IV. Finally, we conclude the paper in Section V.
II. RELATED WORK
Recognizing a human’s walking style has been used for many applications. Some works focus on the computer-vision based techniques and some focus on the use of several accelerometers as well as other sensors. Many research works such as [7] or [8] use wearable accelerometers that are located on the body to recognize everyday life activities or personal posture to improve life style or enhance safety.
Reference [6] offers a framework to distinguish children from adults in a video using their movement patterns. They analyze locomotion properties using computer vision techniques to classify various patterns of walking activity.
In [9], authors introduce an authentication system based on walking patterns in which fingerprint data and voice recognition have been used to make the system more reliable. The data was collected using an ad-hoc accelerometer based system.
In [10], walking data from 51 individuals was acquired using an accelerometer sensor on an Android phone, resulting error rate of 0.2.
Authors in [11] present an approach to verify users of mobile devices based on their gait data which is obtained from accelerometer built-into portable devices. Automatic and persistent user verification is implemented using supervised and unsupervised learning techniques. For this purpose, correlation, frequency domain and data distribution statistics of gait data are employed. Furthermore, an unobtrusive training method is explored in order to provide techniques of collecting training data without explicit user annotation.
The problem of human identity and gender recognition from gait sequences with arbitrary walking directions is investigated in [12]. Also, the sparse reconstruction based metric learning (SRML) method learns a distance metric to minimize the intra-class sparse reconstruction errors and maximize the inter-class sparse reconstruction errors simultaneously.
In [13], the biomechanical variables of the walking patterns of the young adults are compared with healthy and fit elderly people. This study revealed several significant differences that made adaptation by the elderly to have safer and stable walking pattern.
III.EXPERIMENT DESIGN
In this section we describe how different smartphone users can be distinguished using the accelerometer data acquired from their walking activities. First, the data collection process is designed and implemented. Then, we extract informative features from the acceleration data along three axes. Finally, we use these features to train and build a multi-class model that can classify individuals based on their walking patterns.
A. Data Collection
In order to collect data, we use a triaxial accelerometer inside the Android phone to measure acceleration. The data from the accelerometer includes the acceleration along the x-axis, y-axis, and z-axis. These axes capture the horizontal movement of the user (x-axis), forward/backward movement (y-axis), and upward/downward movement (z-axis). Twenty subjects, twelve males and eight females, with an average age of 26.4 (SD= 4.95) volunteered to participate in this research study.
All subjects, each carrying a cell phone in their left pant pocket, performed the same walking activity as they do in their daily lives, in indoor and outdoor environments. They started their walk in the indoor corridor and then they went out into the street. Road conditions can be flat, uphill, or downhill with smooth or rough grounds.
Fig. 1 Sample acceleration during walking activity performed by four sample subjects (shown in different colors) along horizontal movement.
During data collection process, subjects have been asked to hold the smartphone in their pocket and don’t change its initial position. Otherwise, the acceleration data can change significantly for the same activity for an identical participant, resulting in inaccurate recognition.
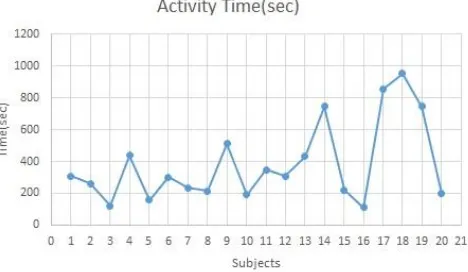
We label the acceleration data associated with each subject with the name of that subject in order to use in our supervised classification algorithm. The sampling rate is 50Hz; i.e., one sample for every 20ms. In this way, each subject provides between 120 and 954 seconds of data. Fig. 2 illustrates how long it takes for each subject to complete his/her walking task. As it is shown in this figure, durations of performing an identical activity are significantly different for different subjects. This differences are resulted from various walking patterns for each individual. Overall, 145,235 samples are collected for each direction in three-dimensional acceleration dataset.
Fig. 2 Walking task completion time for 20 subjects.
B. Feature Extraction
The accelerometer sensor generates three time series along three dimensions of movement (x-axis, y-axis and z-axis). The quality of recognizing different users crucially depends on the features we extract for these three time series. We Consider AX, AY, AZ which are the original data and the features are constructed based on this data.
Each time series along different axes can be considered as a combination of two acceleration components: the gravitational acceleration and body acceleration as suggested in [2]. We use the simple digital low pass filter that has been proposed in [15] that separates gravity and body acceleration. The Dc component resulting from the low pass filter is assumed as the gravitational acceleration. The Ac component resulting from subtracting the Dc time series from the original time series is assumed as the acceleration resulting from body motion.
In the design of the low pass filter the cut-off frequency has been set to ~1Hz. The low pass filter is formulated as follows:
[ ] ( [ ] [ ])
Where n refers to each sample, ADC shows the Dc component and A is the original data before the filtering process.
In order to find the Ac component, we need to subtract the DC components from the original components as follows:
The effect of the low pass filter and high pass filter on acceleration along the x-axis, y-axis, and z-axis is a decomposition of that acceleration into gravitational and body motion accelerations.
After separating the gravitational and body acceleration, for all-time series (Ai , with i={x, y, z}), two time series ADC,i and AAC,i are obtained, where ADC,i and AAC,i respectively represent the DC and AC components along each axis. Furthermore, the magnitude of acceleration, Am, on all directions are computed. In this way, we have four time series, each of which is used for feature construction.
In order to extract the descriptive features for all of time series, (ADC,x, ADC,y, ADC,z, Am), we employ a technique of window overlap as suggested in [16]. In this technique, we divide the dataset into smaller sets such that each window has 64 samples, corresponding to 1.28 seconds of data. The reason is that this window can adequately represent cycles in walking activity. Individual windows may overlap in time in order to reduce the loss of information at the edges of the window. For this purpose, we choose 50% of the overlap between the following windows corresponding to the overlap of 32 samples. Therefore, we apply the window overlap with the size of 64 samples per window and 50% overlap on each four time series.
The average of each window on each direction over a time period is used to estimate the gravity components. So, the mean value for each window is proposed to be one of the features.
By observing the behavior of walking activity signals (positive and negative variants of signals), it is determined that standard deviation and root mean square (RMS) values are useful and effective features.
The Min-Max value is proposed as another feature along with the mean and standard deviation. For this, the minimum value of each window component is subtracted from their maximum value.
The average number of local peak values in each window as well as their variance along all three directions of movement are computed. The variance can give a good estimation of distribution for local peaks along the x-axis, y-axis and z-axis. In some works, researchers use the time between peaks in the activity signals instead of the number of local peaks [17].
Furthermore, we measure correlation between different axes to improve identification of subjects. To summarize, in this work, six features including the mean, standard deviation, MinMax, RMS, average number of peaks, and their statistical variance are chosen to apply on all four time series as was explained earlier in this section. In addition three correlation features are computed. Considering all these features together we construct the 27 dimensional feature vector.
IV.CLASSIFICATION
In this section we describe our classification algorithm for our identification task. Each subject has performed a walking activity such that the acceleration data has been collected along three axes. A feature vector is extracted for each subject that consists of the 27 features that were explained in the previous section.
Multi-class classification algorithms which consider each class label as a unique subject are implemented using several Rule-Based classifiers including the Decision Tables, OneR, Part, and JRip. Classifiers are trained on the set of extracted features. The 10-fold cross validation is employed for a validation and error estimator. We primarily evaluate the performance of these classifiers using their accuracies. The summary results are presented in Table I.
TABLE I
CLASSIFICATION ACCURACY FOR DIFFERENT RULE- BASED CLASSIFIERS
Classifier Accuracy
Decision Table 98.45 %
OneR 95.93 %
Part 87.11 %
JRip 86.87 %
TABLE II
CLASSIFICATION ACCURACY FOR SVM, MULTILAYER PERCEPTRON, AND RANDOM FOREST CLASSIFIERS
Classifier Accuracy
SVM 77.53 %
Multilayer Perceptron 79.57 %
Random Forest 89.17 %
prior research [18]. Obtaining the highest accuracy when using Rule- Based classifiers, reflects their effectiveness to distinguish users by their walking styles.
Illustration of the F-measure for each class (subject) in Fig. 3 represents another evaluation measure for Decision table and OneR classifiers. The F-measure considers both the precision and the recall of the classification. In order to obtain a high performance for identification of subjects through their walking patterns, we need to classify them with high precision and recall. It is shown that in Decision Table classifiers, the F-measure for most of subjects is above 98%. However, the performance for detecting all subjects based on their walking style is above 87%. Evaluating the performance of Decision Table and OneR classifiers based on their F-measures shows that the Decision Table classifier outperforms the OneR in identifying the people using biomechanical properties of their walking.
Fig.3 F-measure for each subject using two classifiers: Decision Table and OneR
V. CONCLUSIONS
In this paper, identification accuracy of up to 98.45% for recognizing individuals is obtained from their walking patterns. The data is collected under real-world conditions from 20 subjects. A new set of features and then a multi-class model that can distinguish between different users based on their walking styles were taken into account. In this context, we investigated the effectiveness of Rule- Based Classifiers as an identification framework and as an alternative technique to Neural Networks, Bayesian Networks, and Decision Trees.
R
EFERENCES
[1] N.D. Lane, E. Miluzzo, H. Lu, D. Peebles, T. Choudhury, and A.T. Campbell, “A survey of mobile phone sensing,” IEEE Communications magazine, 48(9), pp.140-150, 2010.
[2] A. Mannini and A.M. Sabatini, “Machine learning methods for classifying human physical activity from on-body accelerometers,” Sensors, 10(2), pp.1154-1175, 2010.
[3] A. Bayat, A.H. Bayat, and M. Pomplun. "Enhancing User Identification During Reading by Applying Content-Based Text Analysis to Eye-Movement Patterns," International Conference on Applied Human Factors and Ergonomics. Springer, Cham, 2017.
[4] E. Miluzzo, et al. "Tapprints: your finger taps have fingerprints." Proceedings of the 10th international conference on Mobile systems, applications, and services, ACM, 2012.
[5] A. Bayat and M. Pomplun, "Biometric Identification Through Eye-Movement Patterns," International Conference on Applied Human Factors and Ergonomics. Springer, Cham, 2017.
[6] J.W. Davis, “Visual categorization of children and adult walking styles,” International Conference on Audio-and Video-based Biometric Person Authentication, (pp. 295-300), Springer Berlin Heidelberg, 2001. [7] L. Bao and S.S. Intille, “Activity recognition from user-annotated acceleration data,” International
Conference on Pervasive Computing (pp. 1-17), Springer Berlin Heidelberg, 2004.
[8] N. Ravi, N. Dandekar, P. Mysore, and M.L. Littman, “Activity recognition from accelerometer data,” AAAI, Vol. 5, pp. 1541-1546, 2005.
[9] E. Vildjiounaite, S.M. Makela, M. Lindholm, V. Kyllonen, and H. Ailisto, “Increasing security of mobile devices by decreasing user effort in verification,” 2007 Second International Conference on Systems and Networks Communications (ICSNC 2007), (pp. 80-80). IEEE, 2007.
[11]J. Mantyjarvi, M. Lindholm, E. Vildjiounaite, S.M. Makela, and H.A. Ailisto, “March. Identifying users of portable devices from gait pattern with accelerometers,” Proceedings.(ICASSP'05). IEEE International Conference on Acoustics, Speech, and Signal Processing, (Vol. 2, pp. ii-973). IEEE, 2005.
[12]J. Lu, G. Wang, and P. Moulin, “Human identity and gender recognition from gait sequences with arbitrary walking directions,” IEEE Transactions on Information Forensics and Security, 9(1), pp.51-61, 2014. [13]D.A. Winter, et al. "Biomechanical walking pattern changes in the fit and healthy elderly," Physical therapy
70.6 (1990): 340-347,1990.
[14]A. Bayat, A.H. Bayat, and M. Pomplun. "Information Fusion Based on Fixation Patterns and Semantic Analysis for Observer Identification during Reading." Journal of Vision 17.10 (2017): 531-531, 2017. [15]A. Bayat, M. Pomplun, and D.A. Tran, “ A study on human activity recognition using accelerometer data
from smartphones,” Procedia Computer Science, 34 , pp.450-457, 2014.
[16]P. Casale, O. Pujol, and P. Radeva, “Human activity recognition from accelerometer data using a wearable device,” Iberian Conference on Pattern Recognition and Image Analysis (pp. 289-296), 2011.
[17]A. Bayat, M. Pomplun., “The influence of text difficulty level and topic on eye-movement behavior and pupil size during reading,” In Signal Processing and Intelligent Systems (ICSPIS), International Conference of (pp. 1-5). IEEE, 2016.
[18]JR Kwapisz, GM Weiss, SA Moore, "Activity recognition using cell phone accelerometers," ACM SigKDD Explorations Newsletter, 12.2 (2011): 74-82, 2011.