Abstract. ∼
right femurs of 12 female baboons, (Papio hamadryasspp.) from the Texas Biomedical Research Institute/Southwest National Primate Research Center in San Antonio, Texas. The animals were divided into two age groups: a young age group (6.63±0.6 years) and an old age group (26.96±1.3 years). Seven specimens per group were monotonically loaded to failure to determine their mechanical properties. The quasistatic strength of the bone for the old group was just a little (but not significantly) lower than the young group. High strain rate tests performed with the Hopkinson bar indicate that baboon bone from the older group was significantly weaker under impact loads than that from the younger group. This observation is particularly important due to the similarities between baboon and human bone tissue. Typical strain rates for these tests ranged from 130 s−1to 250 s−1. A full-size 3-D simulation of the Hopkinson bar test was performed to confirm that the bone specimen was under stress equilibrium and to evaluate the consistency of the modulus and strength inferred from the tests. Simulations were performed in which the modulus, strength and failure strain were varied to see the sensitivity of the results. Additionally, simplified simulations were performed to estimate the strain rate environment of a femur during a fall at an impact velocity of 5 m/s, similar to a free fall velocity from a height of 1.3 meters. The simulations confirm that strain rates obtained in the Hopkinson bar are relevant because they are similar to those expected inr such a fall.
1 Introduction
The effect of strain rate on biomaterials like cortical bone is still unclear. Hansen et al. [1], for example, compare their data to literature data both for compression and tensile testing at quasistatic and high strain rates. Hansen shows that, in general, the strength in compression apparently increases with strain rate. Unfortunately, in tension the results are ambiguous with some literature supporting a significant increase in strength with strain rate while other authors claiming just a small increase or even a decrease in strength. This probably relates to the different types of bones used by the different authors but other effects like inertial confinement or experimental bias should not be discarded.
The objective of the work presented here is to compare the mechanical properties of young and old baboon bones at high strain rates. The decrease of quasistatic strength with age is well documented in humans [2] and is a health concern. Interestingly, for the baboon bones tested in the study presented here, the strength of young and old baboon bones is similar for tensile quasistatic rates, although the bones from the old-age group are more brittle, i.e. fail at lower strains.
Dynamic tensile tests show a very different picture. The old-age group is, in average, much weaker than the young group for strain rates close to 200 s−1. The reason is unclear but, because both groups of specimens were of similar dimensions and tested in a similar way, it would seem that it is not an artifact from the experimental technique. The implication is that bones from the old group ae-mail:[email protected]
are more prone to failure in dynamic conditions than the young ones while, in quasistatic conditions, both groups behave in a similar way.
This paper describes the experimental technique used to obtain the mechanical properties and simulations per-formed in a commercial code to confirm that the interpreta-tion of the waves obtained in the Hopkinson bar is correct. Additionally simulations of the free fall of part of a femur were performed to check that the strain rates seen in the specimens tested are relevant to the impact problem.
2 Materials and methods
2.1 Sample population
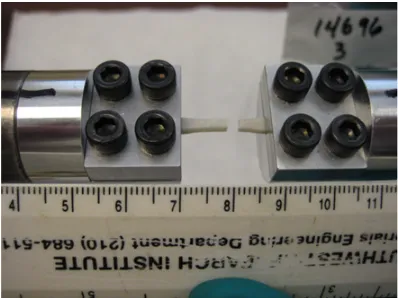
Fig. 1.Baboon bone after a test in the Hopkinson bar.
records for each animal were checked and any animals with medical conditions known to affect bone metabolism were omitted from the sample. Femurs were collected opportunistically at routinely performed necropsies (i.e. no animals were sacrificed for the purpose of this study), wrapped in saline-soaked gauze, placed in air tight plastic bags, and frozen until specimen processing.
2.2 Specimen preparation
A 3 mm transverse midshaft segment was sectioned from each baboon femur for a study of cortical bone microstruc-ture. The remaining distal shaft section of the femurs was transversely sectioned to create shaft sections approxi-mately 38 mm long. These sections were further divided radially to create “blanks” based on individual animal shaft geometry. Flat 2 mm thick “dog-bone” shaped specimens with 3 mm wide × 7 mm long gage regions and 4 mm wide grip regions were machined under constant irrigation from the 12 baboon femurs using a computer numerical controlled (CNC) router (IMService Desktop CNC Router, New Hudson, MI) and purpose-built fixtures. The long axis of each specimen was oriented along the long axis of the femur. Two specimens from each femur were used in this investigation: one for quasi-static testing and one for dynamic testing. Specimen geometry nominally conforms to American Society for Materials and Testing (ASTM) D638-03 requirements for tensile test specimens within the constraint of available bone material. Final specimen gage region dimensions (thickness and width) were determined as the average of three measurements using digital calipers. Figure 1 shows the bone specimen placed in the aluminum grips. The specimen failed after testing it at a strain rate of around 150 s−1.
2.3 Quasi-static tensile testing
Specimens were monotonically loaded to failure to de-termine their mechanical properties under displacement control at a strain rate of 0.01%/sec using an electro-mechanical test machine (Sintech, MTS, Minneapolis, MN). Displacement was measured using an extensometer
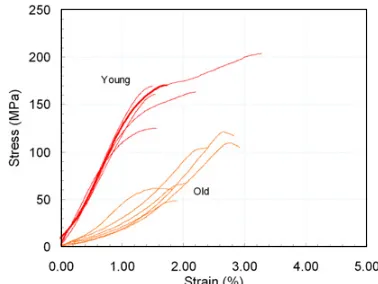
Fig. 2. Comparison of the quasistatic stress-strain curves recorded for the young and old baboons.
Fig. 3. Schematic of the tensile Hopkinson bar built for this project.
(±10% strain range, 5.08 mm gage length) and applied load was measured using a calibrated load cell (±2.2 kN range). Displacement was converted to strain by dividing by initial extensometer gage length and load was converted to specimen stress by dividing by specimen cross sec-tional area. Elastic modulus was determined as the slope of stress-strain data. Peak stress was determined as the maximum observed stress and the corresponding strain level was also determined.
2.4 Dynamic tests
The Hopkinson bar, in a compression configuration, has been used, as described for example by Lindholm [4], since the 1960s to test materials. The bar can also be used to perform indirect tensile tests with a steel collar surrounding the specimen to bypass the compressive wave. This configuration has some limitations on the geometry and size of the specimen, which prevented the use of the system to test materials that work mainly in tension, e.g. composites or biomaterials.
The new tensile Hopkinson bar designed and built for this work allows direct tension of the specimen. The prin-ciples of the system are the same than for the compression bar, see Fig. 3. A projectile is propelled by a gas gun and travels down the barrel impacting a reaction mass at the end. This impact generates a tensile wave (I, strain signal
in the incident bar) that travels back the input bar and reaches the specimen pulling it in tension and eventually failing it. Part of the tensile wave is reflected (R) and
part is transmitted (T) to the output bar. If the specimen
And the stress in the specimen is proportional to the signal recorded by the output bar:
σS =E
A A0
T (3)
where E is the Young modulus of the bar, A the cross section of the bar andA0the cross section of the specimen. The three main one-inch diameter bars of the system were made of maraging steel (Vascomax C350). The input and output bars were strain gaged and calibrated internally. The strain gages have a resistance of 120Ωand constitute a half Wheatstone bridge since two strain gages are placed at diametrally opposite sides of the bar to compensate for bending.
An additional hollow aluminum output bar with a wall thickness of 1/16 inch was ordered and semiconductor strain gages were placed on the surface by an external vendor (Micron Instruments). Owing to the large gage factor (145 for the strain gages used, SS-060-033-500) and the small thickness of the tube, the hollow output bar allows recording very low stresses. This low stresses are on the order of a few MPa and are expected for weak materials like rubber or when small biomaterial specimens like bones and ligaments are used.
The striker projectiles were also built in maraging steel. Three projectiles, 12-in (30.5 cm), 24-in (61 cm) and 48-in (122 cm) long were produced.
2.5 Gripping system
A set of aluminum grips, shown in Fig. 1 with a baboon bone as a specimen, was designed to be used in conjunction with the hollow aluminum bar for very weak specimens. These grips were used for testing the baboon bones. The clamping pressure is obtained by sandwiching the specimen, with the help of four screws, between the grip and a small aluminum tab.
3 Quasistatic test results
The quasistatic tests were generated on the context of a different project. Both young and old groups were tested including seven tests performed per group. Figure 2 plots the stress-strain curves for both young and old groups of baboons. The plot seems to indicate that young baboon bones are more ductile, i.e. fail at larger strains, but the average strength for both groups is not significantly different.
Fig. 4.Comparison of the dynamic stress-strain curves recorded for the young and old baboons.
4 High strain rate test results
The high strain rate tests used the new tensile Hopkinson bar with the hollow aluminum bar as the output bar. When using input and output bars with different cross sections or materials the analysis of the signals needs to be modified properly to find the strains. See for example Chen [5] for more details. The strain rate in the specimen is now given by:
˙
S =
c L
1−Ai At
i(t)
−
1+ Ai At
r(t)
(4) wherecis the sound speed in the bars (assumed the same for both bars here),Lthe length of the specimen,Aiis the
cross section of the input bar,Atis the cross section of the
transmitter bar,iis the incident strain wave andr is the
reflected wave strain. For the tests on the bones strain and strain rate computed “as usual” (see Eqs. (1) and (2)) gave very similar results to the ones computed using Eq. (4) for the time interval of interest.
Figure 4 summarizes the dynamic stress-strain curves obtained when testing young and old baboon bones. Typ-ical strain rates for these tests ranged from 130 s−1 to 250 s−1. It is interesting to observe that the young group is clearly stronger than the old group at these strain rates. Strains to failure seem to be larger (but not significantly) for the older group. The comparison between quasistatic and dynamic results will be further discussed in the dis-cussion section.
5 Numerical simulations
5.1 Validation of test results
A full-size 3-D simulation of the Hopkinson bar test was performed with a double objective. First to confirm that the bone specimen was under stress equilibrium, as is required for a correct interpretation of the waves recorded in the bar. Second to check the consistency of the modulus and strength inferred from the tests.
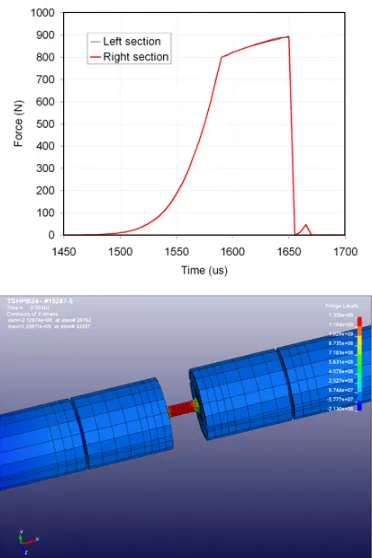
Fig. 5.(top) Force on the left and right end of the gage section of the specimen. (bottom) Stress distribution in the specimen right before failure.
of the results. As it will be explained below a modulus of 20 GPa with a strength of 120 MPa and a failure strain of 3% were found to be consistent with the waveform obtained in the output bar. These material properties were used in the simulation shown in Fig. 5 where the top image shows the force both on the left and right side of the specimen. Both curves lay on top of each other confirming that the specimen is in equilibrium during the elastic and plastic loading of the specimen. Figure 5 (bottom) shows the stress distribution (σxx) in the specimen right before
failure. Again it is seen that in the gage section the stress is uniform and, consequently, the stresses and strains inferred from the incident and output bar signals are reliable.
Figure 6 shows the signals recorded during the tests of young baboon bone together with the results of two LS-DYNA simulations. The thin lines correspond to the signal in the output bar for the seven tests performed. The thick black line is the signal obtained in the output bar of the simulation for an elastic modulus of 20 GPa and a strain to failure of 3% while the thick gray line was obtained with a modulus of 15 GPa and strain to failure of 2%. Both runs used a Von Mises plasticity model with strength of 120 MPa and a hardening modulus of 0.9 GPa.
Figure 6 shows that the output signal is actually sensitive to changes in the elastic modulus and strain to failure and that the signals recorded are consistent with a modulus of 20 GPa. Simulations and tests agree well so it can be concluded that the properties measured with the Hopkinson bar for this particular specimen are reliable. Table 1 summarizes the properties used in simulations of the baboon bone.
Fig. 6.Output bar signals for the seven tests and two simulations performed with young baboon bones.
Table 1.Mechanical properties of the bone used in the simulation of the tensile tests.Eis the elastic modulus,νthe Poisson’s ratio, Y the strength, andf the strain to failure.
Hardening
ρ E Y Slope f
(g/cm3) (GPa) ν (MPa) (GPa) (%)
2 20 0.3 120 0.09 3
Fig. 7.Strain rate map. The impact site has the largest strain rates as expected.
5.2 Typical strain rates in femur free fall
The strain rates achieved in the baboon sample with the Hopkinson bar apparatus are on the order of 100 to 300 s−1. Are these strain rates similar to what we would expect if a human falls and hits the ground? In this section simplified simulations were performed to estimate the strain rates a femur would see when hitting the ground at an impact velocity of 5 m/s.
Figure 7 shows the geometry (and strain rate field) of the bone used for the simulations. The mesh for the femur as well as the different material properties in the femur were developed elsewhere. Among the multiple simplica-tions that make the problem tractable the following are mentioned:
performed with young baboon bones.
3. The impact happens with an initial velocity of 5 m/s against a rigid surface. This corresponds to a free fall from a height of 1.3 meters
4. Impact happens on the bigger trochanter
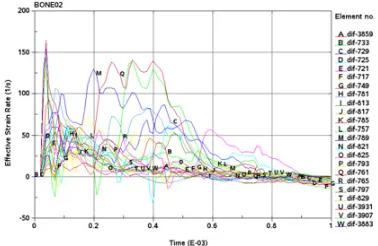
Figure 7 is a snapshot of the strain rates on the impact side. For a more quantitative image some elements around the impact point were selected and the strain rates on them are plotted in Fig. 8. A sharp peak strain rate of 150 s−1 is observed early during the impact (40–50µs), which corresponds very well with the strain rates achieved in the Hopkinson bar. Later in time (approx. 200–300µs) the strain rate raises again but stays around 130 s−1. Although the simulations are a very rough approach to reality it is still thought that they provide a reasonable order of magnitude of the strain rates seen in reality and hence show that the numbers obtained in Hopkinson bar are relevant to the real problem of obtaining bone properties at rates seen in real human falls.
6 Discussion
Table 2 summarizes the average strength of old and young baboons for quasistatic and high strain rates. The standard deviation is also presented on the table to easily assess the scatter of the data. Clearly for quasistatic data the difference between old and young is within the scatter.
For the dynamic data something interesting happens: while the strength of the young baboon bones increase slightly (although within the scatter) with respect to quasi-static, the old baboon bones decrease their strength signifi-cantly. The reason for this surprising behavior is unknown to the authors and will be the subject of further research. Both young and old groups were tested in the same condi-tions and with the same setup so the strength decrease of the old group is not thought to be an experimental artifact. Figure 9 shows in graphical form the strength of both groups at quasistatic and dynamic rates. All the tests are shown in the figure, which clearly shows the overlap on the quasistatic data and no overlap on the dynamic data.
7 Conclusions
The strength of young and old baboon bones has been determined in quasistatic and high rate tension with the
Fig. 9.Strength vs. strain rate for all the tests performed in this program on young and old baboon specimens.
new tensile Hopkinson bar built at Southwest Research Institute. The results are puzzling because the quasistatic strength is similar in both groups while dynamic strength is much lower in the old group. 3-D numerical simulations have confirmed that the material properties inferred from the tests reproduce the waves recorded from input and out-put bar. Due to the similarities between baboon and human bone tissue the results could be important in helping to explain clinical fractures in older individuals.
References
1. U. Hansen, P. Zioupos, R. Simpson, J.D. Currey, and D. Hynd. The effect of strain rate on the mechanical properties of human cortical bone. J. Biomechanical Engineering, 130:011011–1–8, 2008.
2. J.H. Tyler R.L. Acuna H.J. Gayle X. Wang J. Nyman, A. Roy. Age-related factors affecting the postyield en-ergy dissipation of human cortical bone.J. Orthopaedic Research, May:646–655, 2007.
3. National Research Council Guide for the care and use of laboratory animals. National Academy of Sciences, Washington D.C., 1996.
4. U. S. Lindholm and L. M. Yeakley. High strain rate testing: Tension and compression. Experimental Me-chanics, 8:1–9, 1968.