1
Study on Diffusion Coefficient of Fluorophores in 3D
Hydrogel with Cationic Charge using Microchip
Ju Young Jin1,#, Jaesool Shim2,#, and Jinseok Kim1,*
1 Center for Bionics, Biomedical Research Institute, Korea Institute of Science and
Technology, Hwarangno 14-gil 5, Seongbuk-gu, Seoul 136-791, Republic of Korea
2 School of Mechanical Engineering, Yeungnam University, Gyeongsan, Gyeonsanbuk-do
712-749, Republic of Korea
Author Information
# Ju Young Jin and Jaesool Shim contributed equally to this work. * Corresponding Authors. E-mail: [email protected]
Abstract
The diffusion coefficients of ions are measured in a microchip filled with a cationic
charged 3D hydrogel in order to study the effect of cationic charged 3D hydrogel on the
diffusivity of ions. In this study, poly-diallyl-dimethyl-ammoniumchloride (poly-DADMAC)
is used to produce a 3D hydrogel. Four different fluorophores are used in the 3D hydrogel
rhodamine 6G, rhodamine-BSA, fluorescein isothio-cyanate (FITC) and FITC-BSA. The
rhodamine 6G and rhodamine-BSA are positively charged (cations), while fluorescein
isothio-cyanate (FITC) and FITC-BSA are negatively charged (anions). Two widely used
techniques which are short time diffusivity measurement technique and long time diffusivity
measurement techniques are used to measure the diffusion coefficients. For the short time
measurement, Fluorescence recovery after photo-bleaching (FRAP) is used by a 3D confocal
microscope. For the long time measurement, fluorescence images are taken for 11 days to observe a pure diffusivity without any convective movement. As a result, the diffusivity of
the cations was found to be lower than that of the anions in the cationic charged hydrogel.
2
Keywords - Fluorescence recovery after photo bleaching (FRAP), Diffusion coefficient,
electric charge, Poly-DADMAC, 3D hydrogel
Introduction
Hydrogels, also well known as aquagels, are composed of a three-dimensional network of
hydrophilic polymer chains. Hydrogels can be used to deliver soluble or immobilized signals
to the cells, act as support structures for cell growth and function, and provide space filling
for the future tissue ingrowth. It is highly absorbent and therefore can swell or shrink by
absorbing or emitting water [1–2]. Hydrogels are commonly used as scaffolds in tissue
engineering [3–4] and as biosensors that respond to certain molecules such as glucose or
antigens [5]. In addition, they have been used to release drugs in drug delivery systems [6–7].
These key features of hydrogels such as swelling and shrinking under water have been
rapidly studied as potential materials for various biomedical applications [8–11]. In many
cases, hydrogels have been applied as a ‘stealth material’ since it is inert to most biological
molecules such as proteins. Various molecules can be encapsulated in the hydrogels. Since
hydrogel molecules are inert and do not bind with most chemicals, drugs or other proteins, a
variety of molecules can be released from hydrogels based on the molecular diffusion rate as
well as the pore diameter of the polymetric network. Diffusivity in hydrogels is of significant
importance in mimicking the actual biological environment. Besides molecular weight or size,
diffusivity can be affected greatly by the polarity or electric charge density of the bio
3
There are a variety of studies on measurement and analysis of diffusivity of molecules in
hydrogels for biomedical applications.
In 1985, Lee examined both experimentally and theoretically the kinetics of drug release
from hydrogel matrices. He found that the release of water soluble drugs from initially
dehydrated hydrogel matrices generally involves the simultaneous absorption of water and
desorption of drug through a swelling-controlled diffusion mechanism [12]. In 1993, Merrill
et al. experimentally determined the ratio of diffusion coefficient in hydrogels of poly
ethylene oxide(PEO) and diffusion coefficient in free solution. They found the effective
diffusion coefficients of oxygen, hydrogen peroxide and hydroquinone in a hydrogel under
steady state conditions. In their study, the diffusion rate for the materials was independent of
the degree of cross-linking of the hydrogel [13]. In 1996, Li et al. determined diffusion
coefficients for relevant solutes [ranging in size from oxygen to immunoglobulin G (IgG)]
into and out of agarose and alginate gels. They show that the determination is highly
reproducible and useful for gels crosslinked in the cylindrical geometry in order for studying
transport through matrices used in cell immobilization [14]. In 1997, Matsuyama et al.
examined diffusion and portioning of solutes which have various molecular weights in
poly(vinyl alcohol) hydrogel membrane. The solute diffusion through swollen gel membrane
was analyzed by the equation based on free volume theory and the efficiency of the proposed
analysis equation was confirmed by the experimental results of the effects of solute size and
water volume fraction in the membrane [15]. In 2006, Liang et al. conducted the
determination of proteins’ diffusion in agarose hydrogel at body temperature using their
in-situ refractive index method. They found that the diffusion coefficients of proteins decrease
with the increase of the concentration of agarose and the solute molecular size [16]. In 2009,
4
of molecular mass, hydrodynamic radii, and isoelectric points through a nanofiber hydrogel
scaffold consisting of designer self-assembling peptides by using single-molecule
fluorescence correlation spectroscopy (FCS). Their results showed that this biocompatible
and injectable designer self-assembling peptide hydrogel system may be useful as a carrier
for therapeutic proteins for sustained release applications [17]. In 2010, Park et al. presented
an approach to generate microporous cell-laden hydrogels for fabricating biomimetic
tissue-engineered constructs, and characterized the physical, mechanical, and biological properties
(i.e., microporosity, diffusivity, and cell viability) of cell-laden agarose gels as a function of
engineered porosity. In their study, microporosity within agarose gels can also control
diffusion profiles that significantly affect cell viability in the medium perfusion condition [18]. Recently, in 2015, Lopez-Sanchez et al. studied diffusion of macromolecules in self-assembled cellulose/hemicellulose hydrogels using fluorescence recovery after
photobleaching (FRAP). They investigated the diffusivities of a series of fluorescently
labelled dextrans of different molecular weight, and proteins including a plant pectin methyl
esterase (PME) [19]. In the same year, Patra et al. showed the Diffusion of Moisture from
Hydrogel Scaffold with Induced Porosity from Self-Assembled Bubbles. In their study a
mathematical model was used to derive an effective diffusivity of the scaffold as a function
of the moisture content [20].
Although a variety of experiments on diffusivity in various hydrogels are conducted, the
diffusivity has been mainly determined in terms of the mechanical properties of hydrogels
such as molecular weight or size, mass and pore size of the matrix as well as porosity of
5
However, in many cases, since there are electric interactions between the molecules and the
matrix of hydrogels under specific charge conditions, the electric forces hinder diffusivity of
molecules from hydrogels or enhance diffusivity of them. we experimentally found that the
diffusivity of molecules is also highly dependent on the charge conditions of both molecules
and hydrogels. In this study, the diffusion coefficients of charged molecules are measured in
a cationic charged 3D hydrogel by using microchips in order to study the interaction effect of
charge conditions of hydrogels.
Diffusion coefficients of fluorophores with electric charges in
poly-diallyl-dimethyl-ammoniumchloride (poly-DADMAC) hydrogels have been used to measure diffusivity of
charged molecules.
Fluorescence recovery after photo-bleaching that has been widely used to quantify the
two dimensional lateral diffusion of fluorescent molecules was utilized to measure the
diffusion coefficients of fluorophores. In addition, a long-term diffusivity test was also
conducted to compare the results that were obtained by FRAP.
Experimental Methods
Microchannel fabrication
The procedure for the fabrication of the microchannels used for the measurement of
diffusion coefficient is based on a photo lithography method widely used to make PDMS
microchips. Briefly, for a pattern replica, the SU-8 2035 as a negative photoresist is coated on
a silicon-wafer substrate using a spin coater. The spin rate was controlled and programmed
according to the processing guidelines of MICROCHEM for the desired channel thickness
6
(Sylgard 184; Dow Corning, Midland, MI, USA) were uniformly mixed at a ratio of 10:1,
and degassed to remove bubbles inside the PDMS mixture. The PDMS mixture formed on a
master silicon substrate was cured in the oven. After the curingprocess, the cured PDMS was
carefully peeled off from the Si-wafer substrate. The PDMS channel had holes asreservoirs
at the end of the channels. The PDMS with a channel pattern and a slide glass for the bottom
of thechannel were bonded by treating it with the plasma cleaner.
Figure 1 shows a schematic and a picture of the fabricated microchannel. The height of
the channel is 25 μm and the total height of the PDMS mold is 0.8 mm for this experiment.
Poly-DADMAC synthesis
A poly-DADMAC solution was synthesized by using 4.8 mL of
poly(acrylamide-co-diallyl-dimethyl-ammoniumchloride) solution (Sigma®), 0.05 g of N,N′-Methylenebis
(acrylamide; Sigma®) that acted as a cross-linker, and 0.05 g of 2-Hydroxy-4’-(2-hydroxyethoxy)-2-methylpropiophenone (Sigma®) that acted as a photoinitiator. The synthesized poly-DADMAC solution was injected into the microchannel and cured by using
ultraviolet light (UV). Omnicure® S2000 was used as an ultraviolet light source and
poly-DADMAC solution was cured for 10 s using 20 W of power.
Fluorescence synthesis
Four fluorescent materials were used to measure the diffusivities of molecules with
7
electric charges of the four different fluorophores, electrophoresis was carried out. Since the
electrophoresis places high charge difference at the opposing ends through the electrodes, the
molecules between the two electrodes should migrate one direction or the other according to
its charge. Rhodamine-BSA and Rhodamine 6G migrated toward the negatively charged
electrode, which verified that these two fluorophores are positively charged. The FITC and
FITC-BSA migrated toward the positively charged electrode, which verified that these
fluorophores are negatively charged in Fig 2.
Bovine serum albumin (BSA) was conjugated to each fluorophore in rhodamine-BSA and
FITC-BSA. The molecular weight of BSA is 66,463 Da, and its size is 140 × 40 × 40 Å [22].
We used BSA-conjugated FITC to verify our FRAP system. The diffusivity of FITC-BSA in
2% agarose gel is 64 ± 4 μm2/s [23]. Hence, we could conclude that our system could generate reproducible and reliable data if we could obtain a similar result. Rhodamine-BSA
was used to compare it with FITC-BSA because both were conjugated with BSA but had
opposite polarities. Thus, the blocking effect of poly-DADMAC would be observable by
comparing the diffusion coefficients of both materials. Fluorophores were conjugated to
amino acids in BSA, which consists of 607 amino acids.
Fluorescence Recovery After Photobleaching
Fluorescence Recovery After Photobleaching (FRAP) is an optical technique that is used
to quantify the two dimensional lateral diffusion of fluorescently labeled molecules. If a
region of interest (ROI) is bleached by a high-intensity laser, molecules in the ROI are
replaced by nonbleached molecules that are located outside of the ROI because of diffusion
8
fluorescently labeled sample is measured by using a low-power beam. Next, the fluorescently
labeled molecules are bleached quickly by a high-power beam. The ROI diameter is usually
selected to be between 1 μm and 100 μm; diameter of 80 μm was used in this experiment.
After photobleaching, diffusion from the other regions to the ROI is monitored by using the
low-power beam. The intensity recovery curve of the photobleached area is fitted to a
suitable FRAP model from which the diffusion coefficient D of the sample molecules can be
determined. The light intensity of the photobleached area cannot be exactly same as that of
the unbleached area because some parts of the bleached area are not replaced by intact
fluorophores. Thus, it is little lower than the initial intensity [25–27]. If the light exhibits a
Gaussian profile, then the diffusion equation for the molecules can be determined according
to the following three theories.
The first theory is the single exponential method:
(1)
This method supposes that the intensity recovery curve follows an exponential curve. I(t) is
the intensity of the ROI that has been normalized to the region that was not influenced by the
bleaching because it was far enough from the ROI. I(∞) is the intensity of the plateau level.
, which is called the characteristic diffusion time or half maximum time. It is the time over
which the intensity of the ROI recovers to half of I(∞). The diffusion coefficient could be
calculated by using the following equation [28]:
(2)
Where D is the diffusion coefficient and ω is the diameter of the ROI. The second method is
9
(3)
The Soumpasis method tries to determine the exact diffusion coefficient by assuming that the
intensity recovery curve can be expressed by two equations rather than a single equation.
However, the two equations originate from a theoretical prediction and exhibit errors when
they are applied to real experimental data. To solve this problem, Ellenberg et al. introduced
an empirical equation based on his experiments [30]:
(4)
Diffusion coefficient D can be represented by the following equation:
(5)
We employed Ellenberg’s empirical equation to calculate the diffusion coefficient in our
experiments.
We used a FV1000 (Olympus®) and a FV-10-ASW (Olympus®) to measure the changes in intensity of the samples and calculated the intensity of each ROI by using the Image J
program. The measured intensity of each type of fluorescent molecule was saved as a text file
and its respective diffusion coefficient was calculated by using the Igor Pro program.
Long term diffusivity experiment
The long term diffusivity experiment is an alternative method to measure the diffusion
coefficients of fluorescent materials. Although FRAP can be used to measure the local
diffusivity of a material, the long term diffusivity experiment can be used to measure realistic
10
inlet to the outlet. The Poly-DADMAC is loaded into the channel through the use of the
capillary force. The photoinitiator added to the Poly-DADMAC allows it to be cured by UV
irradiation at 10 Watts for 10 seconds. After UV curing, the channel will appear clogged with
Poly-DADMAC, but the Poly-DADMAC has a porous structure through which the
fluorophores can diffuse through. The 20 µL of each of the four fluorophores are loaded onto
the inlet of the PDMS channel. In order to maintain constant density of the materials at the
inlet, a thermohygrostat was used. The materials were added to the inlet once every 24 hours
to prevent dehydration, and the diffusion of the materials towards the outlet was observed.
The fluorescence intensity of the microchannel at 2.5 mm intervals was measured every 2
days from day 1 by taking a photo using the microscope and the diffusion coefficient was
calculated from the fluorescence intensity.
Results
FRAP
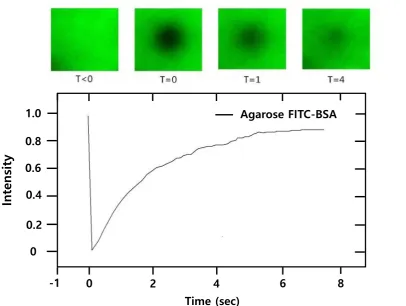
First, we measure the diffusivity of FITC-BSA and rhodamine-BSA in the 2% agarose gel
to validate the accuracy of our FRAP system. Fig. 3 shows the recovery curve of FITC-BSA
after bleaching.
The diffusivity of FITC-BSA was calculated to be 58 ± 3 μm2/s. This was 8% in error
when compared to the value of 64 ± 4 μm2/s that was obtained from a reference paper. The error may take place from specimen, microscope and a curve fitting method, etc., but the 8%
error is acceptable for measuring the diffusion coefficient in liquid phase [31]. The diffusivity
11
reasonable because agarose gel is a nonpolar material and the error rate with respect to the
reference value was 5%. Thus, we concluded that our FRAP system provided valid results.
Next, we measured the diffusivity of rhodamine 6G, FITC-BSA, and FITC in the
poly-DADMAC by using the same conditions as for the previous experiment. For the case of
negatively charged Rhodamine and Rhodamine-BSA, their charge causes slow diffusion
within the positively charged ion exchange resin, poly-DADMAC. Additionally, the FRAP
test came out to be inconclusive for Rhodamine-BSA due to the lack of recovery after
bleaching step. Although Rhodamine did recover after bleaching, increased mass and size of
Rhodamine-BSA due to the conjugation of BSA seems to have lowered recovery rate
Rhodamine-BSA far below the measurable amount.
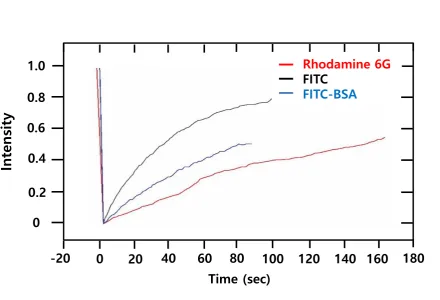
Fig. 4 shows the graphs of recovered intensities of the fluorophores in the ROI after
photobleaching. The values were normalized and therefore the initial intensities are unity.
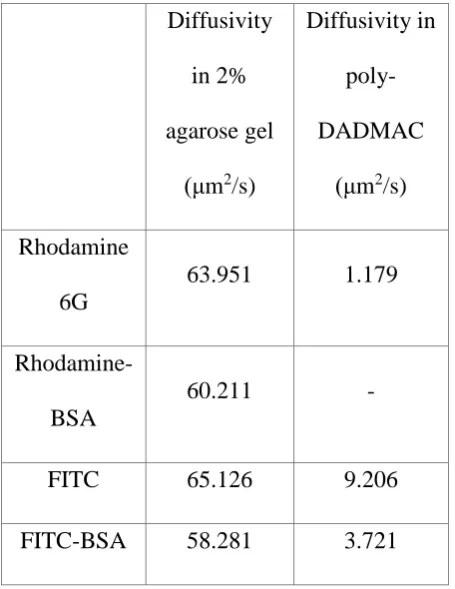
Using the graph, the diffusivity of each fluorophore in poly-DADMAC was calculated (Table
1).
The diffusivities of rhodamine 6G and rhodamine-BSA were much smaller than those of
FITC and FITC-BSA. This was because rhodamine has a positive charge while FITC has a
negative charge. Also, FITC-BSA diffused more slowly than FITC because its molecular
weight was higher than FITC due to the conjugated BSA. Rhodamine 6G diffused the most
slowly and FITC was the fastest in poly-DADMAC.
Long term diffusivity experiment
By carrying out the long term diffusivity experiment, we were able to obtain realistic
diffusion speeds for the fluorophores in the microchannel. Fig. 5 shows fluorescence
12
taken every two days. The light intensity at 2.5 mm intervals from the inlet was measured and
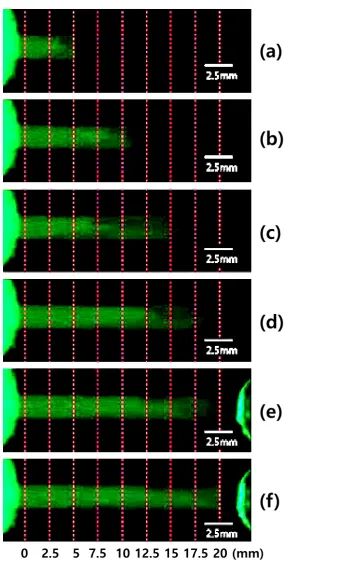
the diffusivity was calculated by using this information. Fig. 5(a) shows that the fluorophores
diffused faster on day 1 than the other days because of the concentration gradient. This meant
that the ratio of the concentration to the distance between two points as well as the diffusion
velocity were proportional to the concentration gradient. The concentration gradients in the
early days were higher than those of the later days, and thus the diffusion velocity decreased
during the experiment.
Fig. 6 shows the diffusion lengths of each fluorophore in the poly-DADMAC cured
microchannel. The diffusion lengths of rhodamine 6G, FITC and FITC-BSA were same on
day 11 because all of the molecules diffused to the end of the microchannel. The diffusion
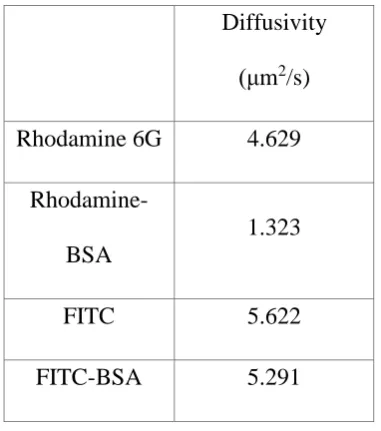
coefficient of each fluorophore that was calculated using the data from the long-term
diffusivity experiment is shown in Table 2. The diffusion rate differences due to varying
PDMS channel widths are indicated in the table 3. In this study, the diffusion rate differences
are calculated as the obtained diffusion coefficients for different channel widths are compared
with the average diffusion coefficient for each case. The increase in the average diffusion rate
was observed as the channel width was increased. Additionally BSA conjugated fluorophore
seem to have smaller differences.
Rhodamine-BSA was the slowest material with diffusion coefficient of 1.323 μm2/s, while FITC was the fastest material with a diffusion coefficient of 5.622 μm2/s. FITC was the fastest at diffusing followed by FITC-BSA, rhodamine 6G, and rhodamine-BSA for both
FRAP and the long-term diffusivity experiment. The relative order of the diffusion
coefficients were the same for both FRAP method and the long term diffusion tests.
13
FRAP and long term diffusion tests. The diffusion coefficients for FRAP were much smaller
than those from the FRAP method.
Discussion
Diffusion coefficients of the four fluorophores in poly-DADMAC were measured by two
methods in this study. When measured by FRAP, the diffusion coefficient of cationic
rhodamine 6G was 1.179 μm2/s. This was much smaller value than that of FITC and
FITC-BSA, which were 9.206 μm2/s and 3.721 μm2/s, respectively. This shows that molecules with
positive charges diffuse slower than those with negative-charges in the cationic hydrogel
poly-DADMAC. We were not able to measure the diffusion coefficient of rhodamine-BSA
by FRAP because the bleached area did not recover.
To verify our results, a long-term diffusivity test was conducted and the results were
compared to those for FRAP. The diffusion coefficients of rhodamine 6G, rhodamine-BSA,
FITC, and FITC-BSA when measured by the long-term diffusivity test were 4.629 μm2/s, 1.323 μm2/s, 5.622 μm2/s, and 5.291 μm2/s, respectively. The relative order of diffusivity was
the same by both methods but the absolute values for the diffusivities were different. The
experimental difference might have occurred due to the locally non-uniform porosity of 3D
hydrogels. The effect of the non-uniform porosity of 3D hydrogels is smaller in the FRAP
method due to the radial diffusion of the fluorophores, but greater in the long-term diffusion
test due to its linear diffusion mechanism. In addition, another difference was that the
diffusion velocity decreased as time progressed by long-term diffusivity test method.
Although the different diffusion coefficients are obtained from the two methods, the orders
14
rather than the long-term diffusivity test if we consider the local diffusion coefficients
without considering the uniformity of hydrogels.
Diffusion coefficients for FITC and FITC-BSA were not much different from each other
as seen by the long-term diffusivity test. Therefore, the pore size of poly-DADMAC should
be much larger than the size of BSA. Poly-DADMAC has pores interspersed in a uniform
structure and thus the fluorophores were affected when they travelled through the pores.
FITC and FITC-BSA were not influenced very much by the cation because they had negative
charges. However, the diffusion coefficient of rhodamine-BSA was much smaller than that of
rhodamine 6G. Rhodamine 6G is smaller than rhodamine-BSA and thus the cations in
rhodamine-BSA might have been influenced more than those in rhodamine 6G when the
molecule passed through the pores in the poly-DADMAC. FITC-BSA seemed to be able to
pass through the pores of poly-DADMAC faster than rhodamine-BSA because FITC has
negative charge.
Conclusions
In this paper, the diffusion coefficients of biomaterials with different charge conditions in
poly-DADMAC were measured to study the effect of the cationic poly-DADMAC as a 3D
hydrogel. FRAP and a long-term measurement method that involved using a microchannel
were employed to measure and compare the diffusion coefficient of each fluorophore. We
demonstrated that the diffusion coefficients of the cations were smaller than those of the
15 Acknowledgements
This research was supported by the convergence technology development program for bionic
arm through the National Research Foundation of Korea(NRF) funded by the Ministry of
Science & ICT (No. 2017M3C1B2085292)
References
[1] Park K, Shalaby SW, Park H (1993) Biodegradable hydrogels for drug delivery (Co.
Lancaster, U.K.) 6:2
[2] Omidian H, Rocca JG, Park KN (2005) Advences in superporous hydrogels. J Control
Release 102:3-12
[3] Appelmana TP, Mizrahi J, Elisseeff JH, Seliktar D (2011) The influence of biological
motifs and dynamic mechanical stimulation in hydrogel scaffold systems on the phenotype of
chondrocytes. Biomaterials 32:1508-1516.
[4] Leipziga ND, Wyliec RG, Kim H, Shoichet MS (2011) Differentiation of neural stem
cells in three-dimensional growth factor-immobilized chitosan hydrogel scaffolds.
Biomaterials 32:57-64
[5] Yang W, Xue H, Carra LR, Wang J, Jiang S (2011) Zwitterionic poly(carboxybetaine)
hydrogels for glucose biosensors in complex media. Biosens Bioelectron 26:2454-2459
[6] Gupta P, Vermani K, Garg S (2002) Hydrogels: from controlles release to pH-responsive
drug delivery. Drug Discov Today 7:569-579
[7] Hoarea TR Kohaneb DS (2008) Hydrogels in drug delivery: Progress and challenges.
16
[8] Pallabi D, Deeptak B, Sudipto R (2012) An experimental study of the swelling behaviour
of spherical hydrogel in water and the formulation of a theoretical model for its explanation.
Int J Drug Delivery 4:20-30
[9] Li Y, Maciel D, Tomas H, Rodrigues J, Ma H, Shi H (2011) pH sensitive
Laponite/alginate hybrid hydrogels: swelling behaviour and release mechanism, Soft Matter
7: 6231-6238
[10] Ye F, Yaghmur A, Jensen H, Larsen SW, Larsen C,Østergaard J (2011) Real-time UV
imaging of drug diffusion and release from Pluronic F127 hydrogels. Eur J Pharm Sci
43:236-243
[11] Yılmaz Y, Gelir A, Salehli F, Nigmatullin RR, Arbuzov AA (2006) Dielectric study of
neutral and charged hydrogels during the swelling process. J Chem Phys 125:234705
[12] Lee PI (1985) Kinetics of drug release from hydrogel matrices. J Control Release
2:277-288
[13] Stroe-Biezen S.A.M., Everaerts FM, Janssen LJJ, Tacken RA (1993) Difusion
coefficients of oxygen, hydrogen peroxide and glucose in a hydrogel. Analytica Chimica
Acta 273:553-560
[14] Li RH, Altreuter DH, Gentile FT (1996) Transport characterization of hydrogel matricies
for cell encapsulation. Biotechnol Bioeng 50:365-373
[15] Matsuyama H, Teramoto M, Urano H (1997) Analysis of solute diffusion in poly(vinyl
17
[16] Koutsopoulos S, Unsworth LD, Nagai Y, Zhang S (2009) Controlled release of
functional proteins through designer self-assembling peptide nanofilter hydrogel scaffold.
PNAS 106:4623-4628
[17] Liang S, Xu J, Weng L,Dai H,Zhang X, Zhang L (2006) Protein diffusion in agarose
hydrogel in situ measured by improved refractive index method.J Control Release
115:189-196
[18] Park JH, Chung BG, Lee WG, Kim J, Brigham MD, Shim J, Lee S, Hwang CM, Durmus
NG, Demirci U, Khademhosseini A (2010) Microporous cell-laden hydrogels for engineered
tissue constructs. Biotechnol Bioeng 106:138-148
[19] Lopez-Sanchez P, Schuster E, Wang D, Gidley MJ, Strom A (2015) Diffusion of
macromolecules in self-assembled cellulose/hemicellulose hydrogels. Soft Matter
11:4002-4010
[20] Patra S, Bal DK, Ganguly S (2015) Diffusion of moisture from hydrogel scaffold with
induced porosity from self-assembled bubble. Drying Technol 33:336-345
[21] http://www.microchem.com/pdf/SU-82000DataSheet2025thru2075Ver4.pdf
[22] Wright AK, Thompson MR (1975) Hydrodynamic structure of bovine serum albumin
determined by transient electric birefringence. Biophys J 15:137-141
[23] Pluen A, Netti PA, Jain RK, Berk DA (1999) Diffusion of macromolecules in agarose
18
[24] Goehring NW, Chowdhury D, Hyman AA, Grill SW (2010) FRAP analysis of
membrane-associated proteins: lateral diffusion and membrane-cytoplasmic exchange.
Biophys J 99:2443-2452
[25] Axelrod D, Koppel DE, Schlessinger J, Elson E, Webb WW (1976) Mobility
measurement by analysis of fluorescence photobleaching recovery kinetics. Biophys J
16:1055-1069
[26] Peters R, Peters J, Tews KH, Bahr W (1974) A microfluorimetric study of translational
diffusion in erythrocyte membranes. Biochim Biophys 367:282-294
[27] Braeckmans K, Buyens K, Naeye B, Vercauteren D, Deschout H, Raemdonck K,
Remaut K, Sanders NN, Demeester J, De Smedt SC (2010) Advanced fluorescence
microscopy methods illuminate the transfection pathway of nucleic acid nanoparticles. J
Control Release 148:69-74
[28] Axelrod D, Koppel DE, Schlessinger J, Elson E, Webb WW (1976) Mobility
measurement by analysis of fluorescence photobleaching recovery kinetics. Biophys J
16:1055-1069
[29] Soumpasis DM (1983) Theoretical analysis of fluorescence photobleaching recovery
experiments. Biophys J 41:95-97
[30] Ellenberg J, Siggia ED, Moreira JE, Smith CL, Presley JF, Worman HJ,
Lippincott-Schwartz JJ (1997) Nuclear membrane dynamics and reassembly in living cells: targeting of
an inner nuclear membrane protein in interphase and mitosis. Cell Biol 138:1193-1206
[31] Milozic N, Lubej M, Novak P, Znidarsic-Plazl P, Plazl I (2014) Evaluation of diffusion
20 Tables
Table 1. Diffusion coefficients in poly-DADMAC measured by FRAP
Diffusivity
in 2%
agarose gel
(μm2/s)
Diffusivity in
poly-DADMAC
(μm2/s)
Rhodamine
6G
63.951 1.179
Rhodamine-BSA
60.211 -
FITC 65.126 9.206
21
Table 2. Diffusion coefficients in poly-DADMAC measured by the long-term experiment
Diffusivity
(μm2/s)
Rhodamine 6G 4.629
Rhodamine-BSA
1.323
FITC 5.622
FITC-BSA 5.291
Table 3. Effect of varying microchannel widths on the long term diffusion test
Channel size rhodamine 6G
rhodamine-BSA FITC FITC-BSA
200um -3.9% -1.4% -2.2% -2.7%
400um -2.1% -0.6% +0.2% +0.4%
600um +1.4% +2.0% +3.9% +2.6%
800um +3.8% +2.5% +5.1% +4.7%
22 Figure Captions
Fig. 1. Schematic and photos of the fabricated PDMS microchannel
Fig. 2. Fluorescence images after electrophoresis of the fluorophores. The red line in the
middle is the start line. Rhodamine-BSA and rhodamine 6G moved to the cathode because
they had negative charges while FITC-BSA and FITC had positive charges and thus moved
to the anode.
Fig. 3. FITC-BSA FRAP data for 2% agarose
Fig. 4. Intensity changes of rhodamine, FITC, and FITC-BSA in the poly-DADMAC in the
bleached area.
Fig. 5. (a–f) Fluorescence images of FITC-BSA diffusion in poly-DADMAC in the
microchannel on (a) day 1, (b) day 3, (c) day 5, (d) day 7, (e) day 9, and (f) day 11
Fig. 6. Diffusion lengths along the microchannel for each measurement. Rhodamine-BSA
23
Figures
a
b
c
d
e
f
(a)
24
Fig. 1. Schematic (a) and photos (b) of the fabricated PDMS microchannel: a,b,c,d,e and f are
25
Fig. 2. Fluorescence images after electrophoresis of the fluorophores. The red line in the
middle is the start line. Rhodamine-BSA and rhodamine 6G moved to the cathode because
they had positive charges while FITC-BSA and FITC had negative charges and thus moved
26
Agarose FITC-BSA
0 0.2 0.4 0.6 0.8 1.0
In
ten
sity
Time (sec)
-1 0 2 4 6 8
27 0
0.2 0.4 0.6 0.8 1.0
In
ten
sity
Time (sec)
-20 0 20 40 60 80 100 120 140 160 180
FITC
Rhodamine
FITC-BSA Rhodamine 6G
FITC
FITC-BSA
Fig. 4. Intensity changes of rhodamine, FITC, and FITC-BSA in the poly-DADMAC in the
28
(a)
(b)
(c)
(d)
(e)
(f)
0 2.5 5 7.5 10 12.5 15 17.5 20 (mm)
Fig. 5. (a–f) Fluorescence images of FITC-BSA diffusion in poly-DADMAC in the
29
Distan
ce
(m
m)
0 20 40 60 80 100 120 140 160 180 2001 3 5 7 9 11
Time (day)
Rhodamine Rhodamine-BSA FITC FITC-BSA 20 18 16 14 12 10 8 6 4 2Fig. 6. Diffusion lengths along the microchannel for each measurement. Rhodamine-BSA