Journal of Pain Research 2017:10 461–467
Journal of Pain Research
Dove
press
submit your manuscript | www.dovepress.com 461
O R I G I N A L R E S E A R C H
open access to scientific and medical research
Open Access Full Text Article
Estimated risk for chronic pain determined using
the generic STarT Back 5-item screening tool
Hiroyuki Oka1
Ko Matsudaira1
Tomoko Fujii1
Norimasa Kikuchi2,3
Yuri Haga2
Takayuki Sawada2,3
Junji Katsuhira4
Takahiko Yoshimoto5
Kayo Kawamata1
Juichi Tonosu6
Masahiko Sumitani7
Satoshi Kasahara7
Sakae Tanaka8
1Department of Medical Research
and Management for Musculoskeletal Pain, Faculty of Medicine, 22nd Century Medical & Research Center, University of Tokyo, Tokyo, 2Clinical
Study Support, Inc., 3Department
of Public Health, Aichi Medical University School of Medicine, Aichi, 4Department of Prosthetics &
Orthotics and Assistive Technology, Faculty of Medical Technology, Niigata University of Health and Welfare, Niigata, 5Department of Rehabilitation,
Kameda Medical Center, Chiba,
6Department of Orthopaedic Surgery,
Kanto Rosai Hospital, Kanagawa,
7Department of Pain and Palliative
Medicine, Faculty of Medicine,
8Department of Orthopaedic Surgery,
University of Tokyo, Tokyo, Japan
Objective: The generic STarT Back 5-item screening tool (STarT-G) is used to manage chronic pain in the lower back and elsewhere. This study evaluated the validity of the Japanese version of this generic screening tool.
Materials and methods: Japanese participants between the ages of 20 and 64 years completed online surveys regarding pain. Survey reliability was assessed with internal consistency, as calculated using Cronbach’s alpha coefficients. Spearman’s correlation coefficients were used to evaluate concurrent validity between the STarT-G score and standard reference questionnaires. Associations between STarT-G scores and the presence of a disability due to chronic pain (DCP) were analyzed using receiver operator characteristic (ROC) curves.
Results: Analyses ultimately included data obtained from 52,842 Japanese participants (54.4% male) with a mean (standard deviation) age of 47.7 (9.4) years. Approximately 1.5% of partici-pants had DCP, and the mean STarT-G score was 1.2 (1.4). The Cronbach’s alpha coefficient was 0.71, indicating an acceptable reliability. The STarT-G score moderately correlated with the pain numerical rating scale (NRS) score (Spearman’s correlation coefficient: r= 0.34). When the STarT-G threshold was set at 4, the sensitivity and specificity of the DCP predictive model were 65.8% and 82.4%, respectively, and the area under the ROC was 0.808.
Conclusion: The STarT-G was internally consistent and was able to distinguish between subjects with and without a DCP. Therefore, the STarT-G can reliably be used in the Japanese population to identify patients with DCP.
Keywords: chronic pain, disability, primary care, psychological factors, screening tool, somatic symptoms
Introduction
Disability due to chronic pain (DCP) results in absence from work and is a major public health concern in Japan and many Western countries.1–4 Various screening tools have
been developed to identify chronic pain subgroups and comorbid factors.5–7 A widely
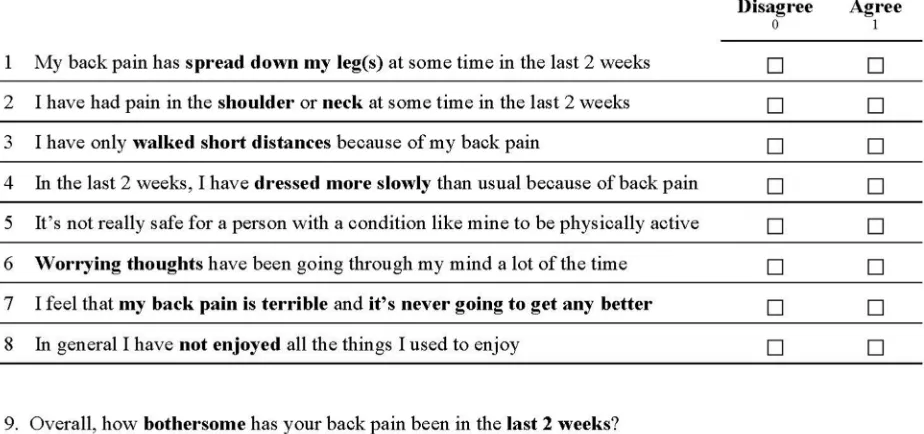
used powerful tool is the STarT Back Tool (STarT), a 9-item screening tool that was developed as a prognostic indicator of lower back pain (LBP). Items 1–4 evaluate physical factors and items 5–9 assess psychosocial factors (Figure 1).5,8 The STarT
score is often used by primary care physicians in England to make clinical decisions.5
Specifically, the STarT results indicate the subgroup that an LBP patient falls into, which helps determine which treatment strategies may be most effective. The STarT has been shown to be particularly effective for individual patient management in the physiotherapy setting. Patients who underwent STarT testing and subsequent targeted therapy had higher clinical and cost efficacy than patients who did not undergo STarT
Correspondence: Hiroyuki Oka Faculty of Medicine, 22nd Century Medical Center, University of Tokyo, Hongo 7-3-1, Bunkyo, Tokyo 113-8655, Japan
Tel +81 3 3815 5411ext34580 Fax +81 3 5800 9549 Email [email protected]
Journal name: Journal of Pain Research Article Designation: ORIGINAL RESEARCH Year: 2017
Volume: 10
Running head verso: Oka et al
Running head recto: The 5-item STarT-estimated risk of chronic pain DOI: http://dx.doi.org/10.2147/JPR.S129585
Journal of Pain Research downloaded from https://www.dovepress.com/ by 118.70.13.36 on 24-Aug-2020
For personal use only.
This article was published in the following Dove Press journal: Journal of Pain Research
24 February 2017
Dovepress Oka et al
testing and were treated with usual care strategies.5 We
previously translated the STarT into Japanese,9 and this
ver-sion was linguistically validated in a general cross-cultural adaptation process.10–12 We also evaluated the reliability and
validity of “the STarT into Japanese” in a large number of Japanese patients with LBP.13
The lower back was the most common site of chronic pain and accounted for 65% of all cases of reported chronic pain in a Japanese epidemiological study.1 However, chronic
pain often originates in places other than the lower back, and a generic screening tool is needed to help effectively man-age chronic pain from all sites. One such tool is the generic
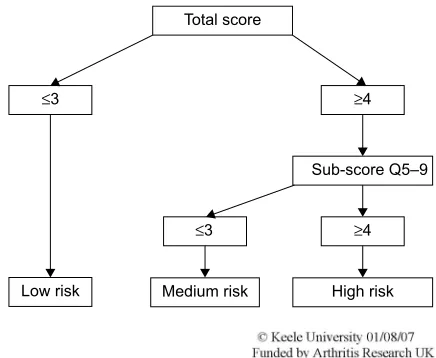
version of the STarT Back 5-item screening tool (STarT-G), a modified version of the 9-item STarT.8 The STarT 9-item
screening tool provides an easy way to stratify patients into three subgroups according to the probability of a poor prog-nosis or pain chronicity. These categories are defined as “low risk,” “medium risk,” and “high risk” (Figure 2).8 On the other
hand, the use of STarT-G (5-item) screening tool has not yet been established. The STarT-G has also not been validated for evaluating chronic pain in a large group of Japanese subjects. Therefore, the current study was performed to examine the validity of STarT-G in such a population using cross-sectional data obtained from STarT-G surveys administered online.
Figure 1 The Keele STarT Back screening tool (9-item).
Note: Copyright ©2007. Reprinted from Keele University. STarT Back Screening Tool Website. Available from: https://www.keele.ac.uk/sbst/startbacktool/usingandscoring/.8
Journal of Pain Research downloaded from https://www.dovepress.com/ by 118.70.13.36 on 24-Aug-2020
Dovepress The 5-item STarT-estimated risk of chronic pain
Materials and methods
This study was reviewed and approved by the medical/ethics review board of the Japan Labour Health and Welfare Orga-nization at Kanto Rosai Hospital (Kanagawa, Japan, approval number: 2012-22). All study procedures adhered to the tenets of the Declaration of Helsinki. Participation was voluntary, and no personal information was collected. Written informed con-sent was not obtained, but submitting the completed question-naire was considered evidence of consent. Before completing the questionnaire, potential participants read an explanation of the survey’s purpose and were informed that they should proceed to the questionnaire only if they agreed to participate in the study. As an incentive, participants received online shopping reward points from the Internet research company that helped conduct this study (UNITED, Inc., Tokyo, Japan).
Study population
Subject information was collected via surveys administered online in January and February 2014. Participants were recruited from an online panel conducted by an Internet research company (UNITED, Inc.). The all-Japanese study population consisted of ~1.25 million registered research volunteers between the ages of 20 and 64 years. From this volunteer pool, 965,919 individuals were randomly selected and invited by e-mail to complete an online questionnaire on health problems associated with pain. We ultimately obtained 52,842 online responses by January 31, 2014.
Study measures
The 5-item STarT-G tool is a modified version of the 9-item psychosocial subscale that specifically identifies distress in
other conditions.5 Questions address fear (one item from
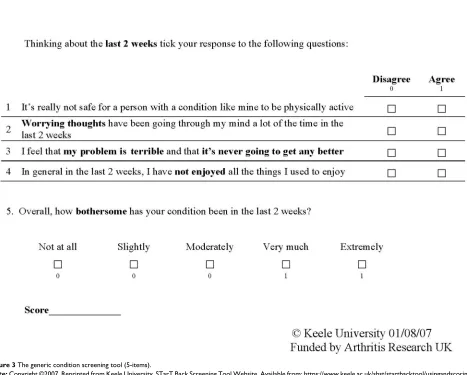
the Tampa Scale of Kinesiophobia), anxiety (one item from the Hospital Anxiety and Depression Scale), pessimistic patient expectations (one item from the Pain Catastrophizing Scale), low mood, (one item from the Hospital Anxiety and Depression Scale), and how bothersome pain is.7 The first
four items had possible responses of “agree” or “disagree,” and the bothersome item had possible responses from 0 to 5 (Likert scale). We used the 5-item STarT back screening tool that is available from the Keele University website (March 2013, Figure 3).8
The study questionnaire investigated pain experienced over the past month in 20 different anatomical sites. All anatomical sites were illustrated on diagrams to ensure that participants correctly identified each area. Examined sites included the head, chin, teeth/mouth, face, throat, neck, shoulder, elbow, wrist/hand, chest, abdomen, back, low back, hip, thigh, knee, lower leg, ankle/foot, genitals, and anus. The degree of chronic pain experienced over the last 4 weeks was assessed using the numerical rating scale (NRS), with scores ranging from 0 (no pain at all) to 10 (the worst pain imaginable).
Somatizing tendency was assessed using a subset of items from a linguistically validated Japanese version of the Brief Symptom Inventory (BSI).14,15 Seven somatic symptoms were
assessed for severity, including faintness or dizziness, pain in the heart or chest, nausea or upset stomach, difficulty breathing, numbness or tingling in part of the body, weakness in part of the body, and hot or cold spells. All symptoms were assessed on a five-point scale that evaluated how much the participant was bothered by the symptom. Participants chose from the fol-lowing response options: not at all (0), mildly (1), moderately (2), quite a bit (3), and extremely (4). For this test, participants were grouped by the number of somatic symptoms or pain sites. A participant was considered to have a symptom if he/she responded with a 2–4, which is indicative of somatization.16,17
The presence/absence of a DCP was also investigated. A DCP was considered present when the pain symptoms had continued for at least 6 months and the subject had withdrawn from social activities because of pain.
Statistical analyses
Data are presented as mean (standard deviation), where applicable. Participant demographic and clinical charac-teristics were summarized using descriptive statistics. To examine floor and ceiling effects, the percentages of respon-dents with total scores of 0 and 5 were calculated. Floor and ceiling effects were considered present when >15% of respondents had the lowest or highest possible score, respectively.18 To examine STarT-G reliability, we evaluated Medium risk
≤3 ≥4
Sub-score Q5–9 ≥4 Total score
≤3
High risk Low risk
Figure 2 The STarT Back tool scoring system.
Notes: Scores were used to stratify patients into “low risk,” “medium risk,” and “high risk” groups. Copyright ©2007. Reprinted from Keele University. STarT Back Screening Tool Website. Available from: https://www.keele.ac.uk/sbst/startbacktool/ usingandscoring/.8
Journal of Pain Research downloaded from https://www.dovepress.com/ by 118.70.13.36 on 24-Aug-2020
Dovepress Oka et al
internal consistency by calculating Cronbach’s alpha coef-ficients. An alpha index >0.70 indicates a satisfactory internal consistency.19 Spearman’s correlation coefficients were used
to evaluate concurrent validity by examining correlations between STarT-G and NRS pain scores. Correlation coef-ficients were interpreted using Cohen’s20 criteria for
correla-tion strength in psychometric validacorrela-tion (0.10 = weak, 0.30
= moderate, and 0.50 = strong).
The ability of STarT-G scores to differentiate between participants with known differences (known-group validity) was examined using the Jonckheere–Terpstra test. To do this, participants were categorized into the following groups according to the number of somatic symptoms present: no symptoms, one symptom, and two or more symptoms.
Associations between STarT-G scores and the presence of a DCP were examined using receiver operator characteristic (ROC) curves and the corresponding area under the curve (AUC). Accuracy was determined using the AUC. The follow-ing traditional academic point system for AUC values can be
used as a rough guide for classifying diagnostic test accuracy: 0.90–1.00 = excellent, 0.80–0.90 = good, 0.70–0.80 = fair, 0.60–0.70 = poor, and 0.50–0.60 = fail.21 Statistical analyses
were performed using SPSS statistical software (version 20.0; SPSS, Inc., Chicago, IL, USA). All reported P values are two-sided, and statistical significance was defined as P< 0.05.
Results
A total of 52,842 participants were ultimately included in analyses. Mean subject age was 47.7 (9.4) years, and 54.4% of participants were male. Approximately 1.5% of participants claimed to have experienced a DCP. Table 1 summarizes participant demographic characteristics and overall pain survey results.
Mean STarT-G score was 1.2 (1.4). A remarkable ceil-ing effect was not observed, with only 2.3% of participants reporting the highest score of 5. However, a substantial floor effect was observed, with 41.0% of participants reporting the lowest score of 0. The Cronbach’s alpha coefficient was
Figure 3 The generic condition screening tool (5-items).
Note: Copyright ©2007. Reprinted from Keele University. STarT Back Screening Tool Website. Available from: https://www.keele.ac.uk/sbst/startbacktool/usingandscoring/.8
Journal of Pain Research downloaded from https://www.dovepress.com/ by 118.70.13.36 on 24-Aug-2020
Dovepress The 5-item STarT-estimated risk of chronic pain
0.71, indicating good test reliability. Concurrent validity was examined by investigating the correlation between STarT-G score and pain NRS. The two pain measures were only mod-erately correlated (r= 0.34).
We examined the STarT-G scores among participants with known differences. As expected, participants with more somatic symptoms had significantly higher STarT-G scores. The mean score was 0.97 (1.12), 1.96 (1.42), and 2.74 (1.53) in participants with zero, one, and two or more somatic symp-toms, respectively (Figure 4). This linear trend of increasing total STarT-G score with an increasing number of somatic symptoms was highly significant (Jonckheere–Terpstra test,
P< 0.0001). Furthermore, participants with pain at a higher
number of body sites had significantly higher STarT-G scores. The mean score was 0.63 (1.05), 1.05 (1.25), 1.27 (1.30), 1.50 (1.37), 1.80 (1.45), 2.23 (1.54), and 2.96 (1.57) in participants with zero, one, two, three, four-to-five, six-to-nine, and ≥10 pain sites, respectively (Figure 5). This linearly increasing trend in STarT-G score with an increasing number of bodily pain sites was highly significant (Jonckheere–Terpstra test, P< 0.0001). The ability of the model to predict the presence of a DCP was also examined when the STarT-G threshold was set to 4. At this cutoff value, sensitivity and specificity for detecting a DCP were 65.8% and 82.4%, respectively. Additionally, area under the ROC curve was 0.808 for this STarT-G threshold, indicating that the model was good (Figure 6).
Table 1 Participant demographic and pain characteristics
Characteristics Sex, n (%)
Male 28,769 (54.4)
Female 24,073 (45.6)
Age, years 47.7 (9.4)
BMI, kg/m2 22.8 (3.8)
STarT-G score 1.2 (1.4)
NRS for pain 3.1 (2.4)
Pain sites, n (%)
0 12,045 (22.8)
1 14,076 (26.6)
2 10,014 (19.0)
3 6,370 (12.1)
4–5 6,188 (11.7)
6–9 3,484 (6.6)
10+ 665 (1.3)
Disability due to chronic pain, n (%)
Present 818 (1.5)
Absent 52,024 (98.5)
Note: Data presented as mean (standard deviation) where applicable.
Abbreviations: BMI, body mass index; STarT-G, generic version of the STarT Back 5-item screening tool; NRS, numerical rating scale.
4
3
2
1
0
None
(n = 42,360) (n = 5,449)One
Number of somatic symptoms
ST
ar
T-G score
Two or more (n = 5,033)
Figure 4 Mean STarT-G scores for participants with different numbers of somatic symptoms.
Notes: The linear trend was found to be highly significant (Jonckheere–Terpstra
test, P < 0.0001). The STarT-G is the generic version of the STarT Back 5-item screening tool. The number of somatic symptoms was determined using the Brief Symptom Inventory somatization scale.
5
4
3
2
1
0 0
(n = 12,045)(n = 14,076)(n = 10,014)(n = 6,370)(n = 6,188)(n = 3,484)(n = 665) Bodily pain sites
1 2 3 4–5 6–9 10+
ST
ar
T-G score
Figure 5 Mean STarT-G scores for participants with different numbers of pain sites.
Notes: The linear trend was found to be highly significant (Jonckheere–Terpstra
test, P < 0.0001). The STarT-G is the generic versions of the STarT Back 5-item screening tool. The number of pain sites represents pain experienced during the past month in the head, chin, teeth/mouth, face, throat, neck, shoulder, elbow, wrist/ hand, chest, abdomen, back, low back, hip, thigh, knee, lower leg, ankle/foot, genitals, and/or anus.
100
50
0 50
1-specificity
Sensitivity (%
)
100
Figure 6 Receiver operating characteristics (ROC) curve of disability due to chronic pain, as assessed using a STarT-G score threshold value of 4.
Note: The area under the ROC curve was 0.808.
Journal of Pain Research downloaded from https://www.dovepress.com/ by 118.70.13.36 on 24-Aug-2020
Dovepress Oka et al
Discussion
Here, we evaluated psychometric properties of the STarT-G. We found that the survey was internally consistent and had acceptable concurrent and known-groups validity in the Japanese population. The Cronbach’s alpha coefficient for the STarT-G was 0.71, indicating a good internal con-sistency. This value was similar to that obtained for the Japanese 9-item STarT scale (0.75).13 Concurrent validity
was assessed by analyzing correlations between the STarT-G and pain NRS scores, which were moderately correlated with each other (r= 0.34). Known-group validity was investigated by examining relationships between STarT-G scores and the number of somatic symptoms and body pain sites. These analyses showed that the STarT-G score increased as the number of somatic symptoms and pain sites increased. This suggests that the STarT-G is able to differentiate between patients with different levels of chronic pain and pain-related problems.
Yellow flags are useful in identifying patients with chronic LBP who have a poor prognosis.22 The 5-item tool covers the
minimal important psychological factors that are consid-ered to be yellow flags for overall chronic LBP. This survey includes questions related to fear, anxiety, catastrophizing, depression, and bothersomeness, all of which are the most important predictors identified as yellow flags. For patients with high STarT-G scores, specific cognitive behavioral approaches are needed in addition to pain education, moti-vation, encouragement, exercise, medical therapy (minimal amounts), and physical treatment. This conclusion is based on previous reports that stated, “early intervention to yellow flag leads to better outcome.”23,24
Finally, ~1.5% of participants reported having a DCP. At a STarT-G threshold value of 4 points, ROC analysis revealed that the sensitivity and specificity of DCP were 65.8% and 82.4%, respectively. Additionally, the AUC was 0.808, indi-cating a good capacity of the STarT-G to differentiate between patients with and without a DCP.
The STarT-G is a diagnosis-specific screening tool used for communication between primary care physicians and pain specialists in the care of chronic pain patients. Using the STarT-G threshold of 4 points, patients examined here were divided into the following two groups: those at risk for a DCP and those with minimal to no risk for a DCP. We recommend that patients at or beyond this threshold consult a pain specialist. The STarT-G is now planned to be used as a tool to identify patients for referral to one of 18 core facilities in Japan that provide cognitive behavioral therapy.
Our study had several limitations. First, our study popula-tion was selected from Internet research volunteers who have chronic pain. Given that 41% of participants had a STarT-G score of 0, many patients may have had chronic pain that was not severe enough to require medical care. This may have influenced our results. Second, Internet-based surveys can introduce a selection bias and may not be representative of the general population. Because our study population was selected from Internet research volunteers who may differ from general Internet users, caution is needed when interpreting our study findings. In particular, people living in large cities are overrepresented in Internet survey company volunteers. In addition, a higher proportion of respondents had completed university or graduate level education than the general population, particularly in older respondents.25
Third, our study had a test reliability of >0.70.19 However,
Nunnally and Bernstein26 recommend a minimum test
reli-ability of >0.90 for making clinical decisions. Therefore, it is possible that test reliability was overestimated. Finally, this cross-sectional study did not assess the ability of the STarT-G to predict pain consistency. Future longitudinal studies are needed to better understand potential associations between risk groups and long-term pain outcomes. These should also examine whether or not the STarT-G score is predictive of DCP.
Conclusion
The STarT-G scale had acceptable internal consistency, reliability, and validity (concurrent and known groups) in Japanese patients with chronic pain. We hope that these analyses of the psychometric properties of STarT-G will enable Japanese clinicians to use this survey as a screening tool for detecting DCPs. The STarT-G is simple, fast, and suitable for use in primary care settings, all of which sug-gest that the STarT-G may facilitate screening for DCP in the primary care setting in Japan. We hope using the STarT-G will ultimately ease physical, social, and economical burdens of chronic pain in the Japanese population.
Disclosure
The authors report no conflicts of interest in this work.
References
1. Nakamura M, Nishiwaki Y, Ushida T, Toyama Y. Prevalence and charac-teristics of chronic musculoskeletal pain in Japan. J Orthop Sci. 2011; 16(4):424–432.
2. Goldberg DS, McGee SJ. Pain as a global public health priority. BMC Public Health. 2011;11:770.
Journal of Pain Research downloaded from https://www.dovepress.com/ by 118.70.13.36 on 24-Aug-2020
Dovepress
Journal of Pain Research
Publish your work in this journal
Submit your manuscript here: https://www.dovepress.com/journal-of-pain-research-journal The Journal of Pain Research is an international, peer reviewed, open access, online journal that welcomes laboratory and clinical findings in the fields of pain research and the prevention and management of pain. Original research, reviews, symposium reports, hypoth-esis formation and commentaries are all considered for publication.
The manuscript management system is completely online and includes a very quick and fair peer-review system, which is all easy to use. Visit http://www.dovepress.com/testimonials.php to read real quotes from published authors.
Dove
press
The 5-item STarT-estimated risk of chronic pain
3. Guerriere DN, Choinière M, Dion D, et al. The Canadian STOP-PAIN project - Part 2: what is the cost of pain for patients on waitlists of multidisciplinary pain treatment facilities? Can J Anaesth. 2010;57(6): 549–558.
4. Lynch ME. The need for a Canadian pain strategy. Pain Res Manag. 2011;16(2):77–80.
5. Hill JC, Whitehurst DG, Lewis M, et al. Comparison of stratified primary care management for low back pain with current best practice (STarT Back): a randomised controlled trial. Lancet. 2011;378(9802): 1560–1571.
6. Leboeuf-Yde C, Gronstvedt A, Borge JA, et al. The Nordic back pain subpopulation program: demographic and clinical predictors for out-come in patients receiving chiropractic treatment for persistent low back pain. J Manipulative Physiol Ther. 2004;27(8):493–502. 7. Dunn KM, Croft PR. Classification of low back pain in primary care:
using “bothersomeness” to identify the most severe cases. Spine (Phila Pa 1976). 2005;30:1887–1892.
8. STarT Back Screening Tool Website. Available from: https://www.keele. ac.uk/sbst/startbacktool/usingandscoring/. Accessed February 17, 2017. 9. Matsudaira K, Kikuchi N, Kawaguchi M, et al. Development of a
Japanese version of the STarT (Subgrouping for Targeted Treatment) Back screening tool: translation and linguistic validation. J Musculoskel Pain Res. 2013;5:11–19. Japanese.
10. Guillemin F, Bombardier C, Beaton D. Cross-cultural adaptation of health-related quality of life measures: literature review and proposed guidelines. J Clin Epidemiol. 1993;46(12):1417–1432.
11. Suzukamo Y, Kumano H. Psychometrics. In: Ikegami N, Fukuhara S, Shimozuma K, Ikeda S, editors. QOL Evaluation Handbook for Clinical Diagnosis. Tokyo: Igaku Shoin; 2001:8–13. Japanese.
12. Wild D, Grove A, Martin M, et al. Principles of good practice for the translation and cultural adaptation process for patient-reported outcomes (PRO) measures: report of the ISPOR Task Force for translation and cultural adaptation. Value Health. 2005;8(2):94–104.
13. Matsudaira K, Oka H, Kikuchi N, Haga Y, Sawada T, Tanaka S. Psy-chometric properties of the Japanese version of the STarT Back Tool in patients with low back pain. PLoS One. 2016;11(3):e0152019.
14. Derogatis LR, Melisaratos N. The Brief Symptom Inventory: an intro-ductory report. Psychol Med. 1983;13(3):595–605.
15. Matsudaira K, Inuzuka K, Kikuchi N, et al. Development of the Japanese version of the brief symptom inventory-somatization scale: translation and linguistic validation. Orthop Surg. 2012;63:149–153. Japanese. 16. Matsudaira K, Palmer KT, Reading I, Hirai M, Yoshimura N, Coggon D.
Prevalence and correlates of regional pain and associated disability in Japanese workers. Occup Environ Med. 2011;68(3):191–196. 17. Derogatis LR, Melisoratos N. The Brief Symptom Inventory: an
intro-ductory report. Psychol Med. 1983;13(3):595–605.
18. Terwee CB, Bot SD, de Boer MR, et al. Quality criteria were proposed for measurement properties of health status questionnaires. J Clin Epidemiol. 2007;60(1):34–42.
19. Nunnally JC. Psychometric Theory. 2nd ed. New York: McGraw-Hill; 1978. 20. Cohen J. Statistical Power Analysis for the Behavioral Sciences. 2nd
ed. Hillsdale: Lawrence Erlbaum Associates; 1988.
21. Hosmer DW, Lemeshow S. Assessing the fit of the model. In: Hosmer DW, Lemeshow S, editors. Applied Logistic Regression. 2nd ed. New York: Wiley; 2000:143–202.
22. Pincus T, McCracken LM. Psychological factors and treatment oppor-tunities in low back pain. Best Pract Res Clin Rheumatol. 2013;27(5): 625–635.
23. Nicholas MK, Linton SJ, Watson PJ, et al. Early identification and management of psychological risk factors (“yellow flags”) in patients with low back pain: a reappraisal. Phys Ther. 2011;91(5):737–753. 24. Kendall NA, Linton SJ, Main CJ. Guide to Assessing Psychosocial Yellow
Flags in Acute Low Back Pain: Risk Factors for Long-term Disability and Work Loss. Wellington, New Zealand: Accident Rehabilitation and Compensation Insurance Corporation of New Zealand and the National Health Committee; 1997.
25. Statistics Bureau Ministry of Internal Affairs and Communication [webpage on the Internet]. Population Census and Labour Force Survey. 2011. Available from: www.stat.go.jp; http://www.stat.go.jp/data/index. htm. Accessed October 4, 2011.
26. Nunnally JC, Bernstein IH. Psychometric Theo. 3rd ed. New York: McGraw-Hill; 1994.
Journal of Pain Research downloaded from https://www.dovepress.com/ by 118.70.13.36 on 24-Aug-2020