Physiological characteristics, activity patterns and physiological
responses of elite women field hockey players during competition.
By
Richard John Walsh
A thesis submitted in fulfilment of the requirements for the degree
Master of Applied Science.
June 1996 fif c%
i " LIBRARY l--^Supervisors:
Dr Michael McKenna
Department of Physical Education and Recreation
Victoria University of Technology
Professor John Carlson
Centre for Rehabilitation, Exercise and Sports Science
Victoria University of Technology
DECLARATIONS
1. This thesis is less than 20,000 words in length, exclusive of tables, references
and appendices.
2. The experimental and analytical work presented in this thesis were performed
by the author. The exceptions being assistance with filming fi^om Jeremy
Darval, Simon Mclness and David Buttifant, intravenous blood sampling by Dr
Jill Grogan and a small amount of blood analysis by Steve Fraser.
3. No material fi"om this thesis has been previously submitted to any other
Abstract
Despite the popularity of field hockey very little research has investigated the
physical requirements of, and the responses to, a game of field hockey. This study
investigated the physiological characteristics of six elite women hockey players,
their movement patterns during a game and the accompanying acute physiological
responses. Players were chosen fi-om the Victorian State Women's Field Hockey
team on the basis of playing positions characterised by a high work-rate.
All players completed a series of laboratory tests comprising a maximal 10 second
cycle ergometer sprint, five 6 second maximal cycle ergometer sprints and a
maximal incremental treadmill test. During a competition game subjects were
videotaped and analysed for physical movement activities using a computerised
video analysis system. The fi"equency and duration of movement patterns were
continuously recorded on computer whilst viewing the video in real time. Selected
physiological responses of the subjects were analysed before, during and following
the same game. Blood samples were taken before, at half time and after the game
to determine plasma acid-base status, fluid shifts, metabolite and electrolyte
concentrations. Fingertip capillary blood lactate was determined at these times and
at the midpoint of each half Heart rate was monitored throughout the game. The
match-induced decline in body mass corrected for water intake was measured as an
indicator of total fluid loss.
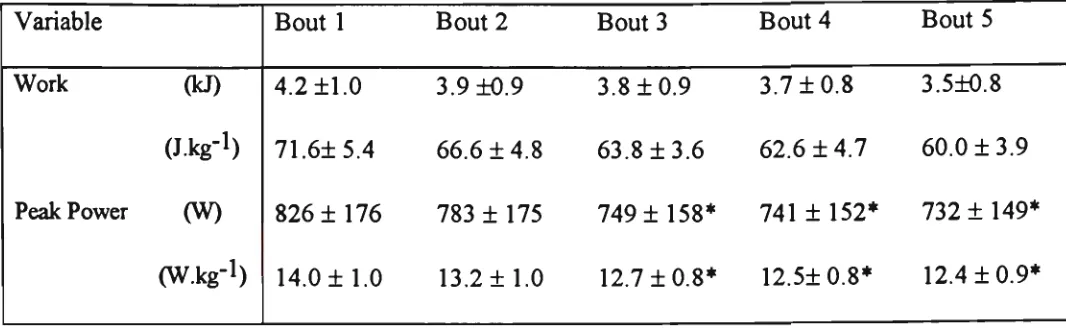
Laboratory sprint tests showed a peak power output of 912.3 ± 171 W (mean ±
SD) for the 10 second sprint with a decline of 11.4 % in peak power by the fifth
bout in the intermittent sprint test (p<0.05). Peak VO2 during treadmill testing was
51.8 ± 3.9 ml.kg-i.min-i and the peak heart rate was 186 ± 5
bts.min-i-Although the hockey matches were played under cool (11.6 ± 2.8 °C), humid (64.8
± 14%) conditions, the calculated sweat loss was 1.0 ± 0.2 l.hr'V Time motion
analysis revealed that 84% of game time was spent in low intensity activity
comprising walking (45 ± 8%), jogging (29 ± 5%), stationary (8 ± 2%) and
sideways motion (2 + 2%). High intensity activity totalled 16 % of game time and
number of events was 1184 ±111, with an average duration of 2.9 ± 0.3 s,
indicating a change in events every 3.6 + 0.4 s. The mean heart rate during game
time was 157 ± 15 bts.min' * representing 85 ± 8% of the peak heart rate recorded
during the maximal incremental test.
Fingertip capillary blood [Lac"] (mmol.l-i) was increased (p< 0.05) above rest (1.9
± 0.3) at mid-first half (6.0 ± 1.5), half time (4.6 ± 2.5), mid-second half (6.0 ±
2.3) and fiiU time (4.7 ± 0.4). Similarly, venous plasma [Lac"] (mmol.l-i) was
elevated (p< 0.05) fi-om rest (1.5 ± 0.5), at half time (4.8 ± 3.6) and at the end of
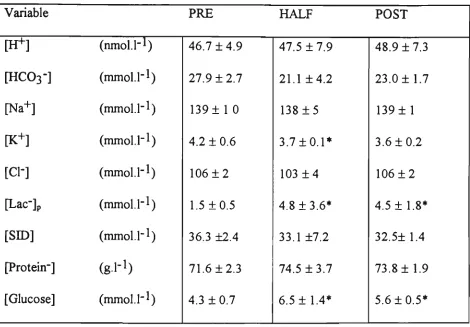
the match (4.5 ± 1.8). Venous plasma [glucose] was elevated (p< 0.05) at half-time
and at the end of the match compared to rest, whilst plasma [K"*"] was reduced
fi-om rest at half time (p< 0.05). Other biochemical changes in venous blood
including pH were minor.
Laboratory tests confirmed that the subjects tested were in an elite class when
compared to published data on international hockey players. The activity patterns
of the players during competition indicates hockey is a sport characterised by a
rapid turnover of activity with a high percentage of the total time involving low
intensity recovery fi-om very brief high intensity efforts. The physiological
responses were high with sustained high heart rates and increased circulating
[Lac"] which indicates that glycolysis is an important energy source during a game
of hockey. Time motion analysis reveals that elite women hockey players in
positions of the highest work rate perform a relatively short period in high intensity
activities and yet the physiological responses and therefore the physiological cost
Acknowledgments
A thesis centred around women should start by acknowledging the three women who are
very important people in my life. Firstly to my Mother and dearest fiiend Anne
Camoscini I thank you for your enduring love. To my soul mate Jacqueline Magid who I
will always love, thank you for being you and to my fiiend Claire Mitchell-Tavemer for
her love and encouragement, not to mention the two max tests in short succession and
late nights trying to fix "that little yellow lactate analyser". This thesis is dedicated to
these three women, my family and fiiends who I adore.
I am most gratefiil to my supervisor Dr Michael McKenna for his growing fiiendship,
humble wisdom and undying patience during my studies. I wish to thank Professor John
Carlson, Dr Jill Grogan, Jeremy Darval, Dr Geraldine Naughton, Simon Mclness,
Kathryn Stear and David Buttifant for their assistance in unpleasant conditions during the
field testing and Steve Fraser for his analyses assistance. I would also like to especially
extend my gratitude to Mr Ian "Sunny day" Fairweather for his amazing technical
expertise and Tim Wrigley for his assistance with software and statistics.
To John Mowat, the coach of the Victorian Women's Hockey Team, whose cooperation
made this thesis possible thank-you for your support during a very stressfiil period in the
build up to the National championships. I am extremely gratefiil to the subjects who
participated in three sets of field and laboratory testing namely: Claire Mitchell Tavemer,
Lisa Holland, Toni Cumpston, Denise Jennings, Dannielle Roche and Kim Raynor.
And finally a special acknowledgment to my father David Peter Walsh who passed away
during my studies but continues to live beside me in spirit and encourage me to love and
Table of contents
Chapter no
CHAPTER 1
CHAPTER 2
Heading
Declarations
Abstract
Acknowledgments
Table of Contents
List of tables
List of figures and appendices
INTRODUCTION
1.1 Definitions and Abbreviations
REVIEW OF LITERATURE
2.1.1 Introduction
2.2 Physiological characteristics
2.2.1 Introduction
2.2.2 Anthropometry
i) Height and Body mass
ii) Body fat composition
2.2.3 Anaerobic power and capacity
2.2.4 Peak oxygen consumption
2.3 Activity analysis
2.3.1 Classification of match activities
2.3.2 Distance covered
2.3.3 Time Spent in various movement
activities.
2.3.4 Conclusions
2.4 Physiological responses to elite FITS
2.4.1 Estimation of exercise intensity
I) Heart rate
ii) Oxygen consumption
Page no
2
3
5
6
9
10
11
12
16
19
19
20
20
20
21
22
24
24
25
26
30
31
31
31
CHAPTER 3
CHAPTER 4
2.4.2 Metabolic responses
I) Sources of energy during ITS
ii) Blood glucose
iii) Lactate
iv) Potassium
v) Fluid regulation
2.4.3 Conclusions
2.5 Aims of the study
METHODOLOGY
3.1 Subjects
3.2 Laboratory tests
3.2.1 Anthropometric measures
3.2.2 Maximal sprint performance measures
3.2.3 Maximal aerobic power
3.2.4 Capillary blood sampling
3.3 Field tests
3.3.1 Computer- video movement pattern
analysis
3.3.2 Variability of the movement analysis
3.3.3 Physiological measurements
i) Heart rate
ii) Fluid balance
iii) Blood sampling analyses
iv) Calculations
3.4 Statistical analysis
RESULTS
4.1 Laboratory tests
4.2 Variability data for analysis of the activities
4.3 Activity patterns analysis
4.4 Heart rate responses to field hockey
4.5 Body mass changes and fluid intake
35
35
37
38
41
41
44
45
46
46
46
46
47
48
48
49
49
51
52
52
52
53
55
55
56
55
58
61
63
4.6 Fluid shifts and Blood Gas Status
4.7 Metabolite and electrolyte concentrations
4.8 Integration of activities and physical
responses
CHAPTER 5 DISCUSSION
5.1 The physiological characteristics
5.2 Movement activities
5.2.1 Critique of methods used
5.2.2 Movement activity patterns
i) Frequency of change in event
ii) Time spent in the movement categories
iii) Work to rest ratios
5.3 Physiological responses
5.3.1 Fluid loss
5.3.2 Heart rate
5.3.3 Blood analyses
i) Lactate
ii) Glucose
iii) Potassium
iv) Other biochemical changes
5.3.4 Summary
5.4 Integration of activities and physiological
responses
5.5 Conclusions
5.6 Exercise prescription
5.7 Directions for future research
APPENDICES
REFERENCES
69
70
76
80
81
84
84
85
85
86
87
89
89
89
91
91
94
95
95
95
97
100
101
104
105
List of tables
Table Title Page
number
2.1 Distinguishing features of court and field intermittent sports 18
2.2 Physical characteristics and fitness profiles of women hockey players 23
2.3 The % of time spent in specific activities in field intermittent sports 28
2.4 Average period of the high intensity periods in field intermittent sports 29
2.5 Mean HR and % ofmaximumHR values in field intermittent sports 32
2.6 Blood lactate concentration during intermittent team sports 40
4.1 Performance data during a ten second sprint test 56
4.2 Intermittent sprint test performance data 57
4.3 Maximal incremental exercise data 57
4.4 Capillary lactate concentrations after the laboratory tests 58
4.5 Intra-session video analysis variability by inexperienced analyst. 59
4.6 Intra session video analysis variability with experienced analyst. 60
4.7 Activity analysis of female field hockey players during competition 61
4.8 Calculated high intensity activity to low intensity activity ratios 62
4.9 Mean HR and HR expressed as a percentage of peak HR 63
4.10 Percentage of time spent in different categories 65
4.11 HR data averaged over a 5 minute period preceding blood samples 66
4.12 % of maximum HR over a 5 minute period preceding blood samples 67
4.13 Body mass changes, fluid intake, sweat loss and environmental conditions 68
4.14 Haematological data, fluid shifts and blood gas status in venous blood 69
^•15 Blood [Lac"]cap before, during and following a game of field hockey ^^
4.16 Plasma electrolyte, glucose and protein concentrations in venous blood 75
List of figures
Figure Title Page
no
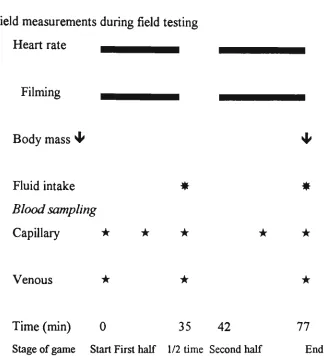
1 Field measurements during field testing 49
2 A typical heart rate response during a game of field hockey 64
3 Capillary Blood [Lac"] before and during field hockey ^^
4 Venous plasma [Lac] before and during field hockey '^
5 Plasma [glucose] before and during field hockey 73
6 Plasma [K''^ before and during field hockey ^^
7 Relationship of % high intensity activity and capillary blood lactate 77
8 Relationship of % high intensity activity and % HRpeak 78
9 Relationship of capillary blood lactate and % HRpeak 79
Appendices Section A
No Table numbers Page
1 Subject information, informed consent and 106
schedule
2 Tables A1-A7 Physiological characteristics of elite women 114
hockey players
3 Tables A8-A13 Activity patterns of elite women hockey players 117
4 Tables A14-A16 Physiological responses from heart rate 120
monitoring
5 Figures 10-14 Heart rate graphs of elite women hockey players 123
CHAPTER 1
INTRODUCTION
Within Australia there are approximately seventy eight thousand male and thirty thousand
female registered field hockey players, with possibly another two hundred thousand
unregistered players. However, very little research has investigated the acute physiological
responses and movement patterns during a game of field hockey.
This study explores the physiological characteristics, activity patterns and physiological
responses of elite women hockey players in positions of the highest work rate during
competition. This will extend prior research into women's field hockey by investigating the
relationship between activity patterns and the corresponding physiological responses that
occur in elite female hockey players during a game. The information from this investigation
may be used to provide a benchmark for the fijture prescription of exercise and
physiological testing protocols for field hockey coaches and sports scientists to assist
1.1 Definitions and abbreviations
Term
Intermittent exercise
Intermittent team sports (ITS)
Intermittent field team sports (FITS)
Intermittent court team sports (CITS)
Game Time (GT)
Low intensity activity (LIA)
High intensity activity (HIA)
Stationary
Walk
Sideways
Jog
Stride/Sprint
Definition
Activity requiring alternating low and high
intensity activities.
Team sports requiring intermittent exercise
Intermittent team sports played on a field, eg
hockey, soccer, rugby and Australian rules
football.
Intermittent team sports played on a court of fixed
dimension eg basketball, netball and volleyball.
Time during which the competition game clock
was running.
The categories of movement considered to be at a
low workrate, ie stationary, walk, jog and
sideways motion.
The categories of movement considered to be at a
high work rate, ie Sprint/stride and shuffle
No movement.
Minimal intensity activity
Side on movement with the legs extended.
Forward and backward running activity requiring
less intensity than striding but greater than
walking.
Forward running movement at a greater intensity
intense effort at or close to maximum.
Shuffle A shuffling action of the feet in a forward,
sideways or backward action
VO2 peak The highest volume of oxygen consumed during a
continuous incremental treadmill test in the
laboratory. It is expressed in absolute (l.min"^) or
relative terms (ml.kg"l.min"l).
% VO2 peak A percentage of a VO 2 peak.
Heart rate (HR) The frequency of ventricular contractions per
minute.
Peak Heart rate (HRPeak) The highest heart rate value recorded for each
subject whilst completing the VO 2 peak testing
Abbreviations
Muscle metabolism
ADP
AMP
ATP
CP
Adenosine diphosphate
Adenosine monophosphate
Adenosine 5'triphosphate
Creatine phosphate
Cardiorespiratory
RER
VO:
Respiratory exchange ratio
Expired ventilation per minute
Volume of oxygen consumption per minute
(l.min')
(l.min*)
Haematology, derived fluid shifts and blood gas
[Hb]
Hct
ABV
APV
PCO2
PO2
SO2
Haemoglobin concentration
Haematocrit
Change in blood volume from rest
Change in plasma volume from rest
Tension of carbon dioxide in plasma
Tension of oxygen in plasma
Oxygen saturation of haemoglobin
(gdl-»)
(mmHg)
Electrolytes
[IT''] Hydrogen ion concentration (nmol.l'*)
[HCO3"] Bicarbonate concentration (mmol.l'^)
[Na"*"] Sodium concentration (mmoll'')
[K"^] Potassium concentration (mmol.l'')
[CI"] Chloride concentration (mmol.!'*)
[Lac"]p Plasma lactate concentration (mmol.l'^)
[ Lac"]cap Capillary blood lactate concentration (mmol.l'*)
CHAPTER 2
REVIEW OF LITERATURE
2.1.1 Introduction
This review is a critique of the physiological characteristics of elite women field hockey
players, their activity patterns and physiological responses during elite women's field
hockey competition. Where there is insufficient information on elite women field hockey
players during competition this review will examine men's field hockey or other elite field
intermittent sports (FITS) which include soccer, Australian Rules football, lacrosse, rugby
league, rugby union and touch rugby. The different types of FITS are played on fields of
varying sizes and require a wide variety of high impact, irregular, low and high intensity
activities. A review of court intermittent sports (CITS) such as netball and basketball is not
included due to reasons explained below. Other intermittent sports including squash and
tennis are not included because arguably they are not considered to be team sports, they are
played on a substantially smaller playing area and therefore do not have similar movement
patterns to FITS. Ice hockey is not included because of the very different mode of
movement, therfore whenever the term "hockey" is used in this thesis it refers to field
hockey.
Previous reviews on intermittent team sports have not separately analysed CITS and FITS
(Mclnness 1993), however data exist to suggest that these types of sports are not
congruous (Table 2.1). Firstly the sizes of the playing areas and the durations of the games
are considerably different which may restrict positional movement. Secondly the shorter
duration and higher work to rest ratios in CITS suggest that the intensity of the game is
higher than in FITS. The intensity of play during certain stages may be higher in CITS due
to regular player interchange. This may allow players to work harder knowing they will
ITS decrease it appears players cover a shorter distance, the work to rest ratio is higher and
the movement patterns occur more frequently. Following this it could also be argued that
the activity patterns during Australian rules football should not be compared to soccer and
hockey because of the large difference in the size of the field and the significantly lower
work to rest ratio (Table 2.1). Finally sufficient studies exist for either FITS or CITS to
focus on making a literature review more specific to the size of the playing area which in
turn affects the nature of the activity patterns.
Although the above evidence for dividing the two types of sports for interpretation is
strong, it could also be argued that the differences between the two types of sports are
decreasing. A major objective for a coach is to facilitate players to produce greater work at
a higher intensity, which in turn will increase the work to rest ratio. This objective is evident
in Australian rules football where in recent times changes to the interchange of player rules
and resulting changes to coaches tactics may allow the players in positions of the highest
workrate to be interchanged more regularly. This suggests that players are able to rest more
often so they may produce more work at a higher intensity while playing and following this
it may illicit higher work to rest ratios. Basketball and netball coaches have used the
interchange rule for many years to increase workrate while the players are on the court.
Changes in the playing surface for hockey in the 1970s allowed a faster, more intense game
(Cibich 1991). The characteristics of FITS may become more similar to present work to rest
ratios in CITS due to previous and fijture changes to the playing surfaces, the rules and the
CO O 9i
•a
I
COi
i
u (4-1 oi
4> a3
13 u 4)1
o o o >.1 I
S 'Z
o 4>
f
I
CO 4> t 3 O u fe «> 13 B ^ •o S ^ j ^^ ^^ V13 S V u c V ^ fll ef i ffi t : o o. C/0 CO c
1-o a> .a X en
m ON ts
o ^ vd VO O SO o o o o
o «^ S § 2^ o ON a- 2 !I; 00
00 a. ^ ^ 00
»o '"' X TT O (N X cs w-» f^ X <s
o • ^
X (N c« I i ^ V + o "^ X <s CO u
t< V + o -^ X <s ei u
t< (U + o • ^ X cs ea u
t< 4>
4-•n
<s X TT
«r> o
NO <s o o VO en o o 00 VO o o VO m 1 o o oo o o VO en ' o o 00 o o VO m O O 00 o o o ^^ o o o cs cs
^
:s
^ '^ ^ :$cs «n
S S
Sports Team itten?
^ o«/t//i /U etbal
l Z cs • asketba l OQ Sports Team ttent S rc W /lite r k, r^ ^ J ^ el d Ho c b
>r> VO OO
Xi
00 u o
o § CO 13 X ) o o CO
1
VO VO 0\ B o 4> Pt^ m'/ — N
0 0 0 0
Ov
^^
S ^ ^
13 tJ ^ v ^ u o Q • ^ /—V cs (TV ON
t - H
S . t f '
>> •al l
i
b t 3 § hia n .Lo t f ^ ^/ — N
•^ ON ON ^—^ •a « CO V g
I - H
s
cs m 00 OV ^"-^ o 00 CO O• - H
a> o c 4> U Ref e
, ^ « y
0 0 0 0 OV S—' 13 tJ enn a
i
0 0/ - * N
^-^ ON ON >.—' o CO 00 % PQ r-' /—:^ •n 00 ON
S - '
2.2 Physiological characteristics of elite women field hockey players.
2.2.1 Introduction
A vast amount of literature exists on physical characteristics of elite intermittent sports
performers however, a review of differences in physiological characteristics between FITS
is probably of little relevance to the women field hockey players in this experiment. Studies
investigating the physical characteristics of female ITS have found significant differences in
individual test results (Withers 1982). Therefore a comprehensive review of all elite
intermittent sports performers is not presented here, rather information on the physical
characteristics of women field hockey players has been reviewed. The majority of literature
on women's field hockey is descriptive information of their physical characteristics. Various
fitness profiles have been provided on state and international teams, providing a profile on
anthropometry, anaerobic power and maximal oxygen consumption of female field hockey
players. However, a number of restrictions exist when integrating the literature, including
measurement of physical characteristics at different times of the season reflecting different
phases of training, different testing protocols used, a variety of regression equations used to
convert skinfold measurements into a percentage. A more valid summary could be obtained
if all measurements were taken prior to major competition with similar standards of teams
using standardised exercise testing and analysis procedures. Information in this review will
include a range of physiological test results on state and national women field hockey
2.2.2 Anthropometry
i) Height and Body mass
Height does not appear to be a prerequisite for elite field hockey players as mean values
were in a relatively small range of 162 - 165 cm. The mean height was 164.6 for the South
Australian squad in 1981, whilst the average body mass was 62.9 ± 9.2 kg (Withers and
Roberts 1981). The Victorian field hockey squad had a mean body mass of 62.6 kg with a
range of 48.7 - 74.6 kg throughout seasons 1991 - 1993 (Walsh 1996, unpublished
research). The Australian National squad had a similar mean body mass of 61.4 kg and a
range of 50.7 - 72.1 kg (Lav^rence 1996, unpublished research),
ii) Body fat composition
Table 2.2 indicates a large range of % body fat and sum of skinfold measurements for
women field hockey players which may be due to players becoming leaner since 1968,
different regression equations used to convert a sum of millimetres to a percentage and or
the measurement of different skinfold sites. There are two published reports of a calculated
percentage of body fat on South Australian representative players using the Dumin and
Womersley (1974) formula (Withers and Roberts 1981, Withers et al 1987) (Table 2.4).
Errors introduced when muhiple regressions are used to convert a sum of millimetres to a
percentage have been shown to vary over twofold on occassions (Lohmann 1981 cited by
Norton and Olds 1996). A more popular approach is to use a sum of at least six sites from
the average of a minimum of two measurements within 0.2 mm at each site. According to
correspondence from the International Society for the Advancement of Kinanthropometry
(ISAK) these sites should comprise the bicep, tricep, supraspinale, subscapula, abdominal,
front thigh and medial calf skinfolds (Correspondence from the Laboratory standards
Assistance scheme, 1996). Due to the margin for error when using regression equations
more reliable and tangible means of intertest comparison and eventually will provide a
database of norms for comparison for specific populations. The individual sum of the seven
sites for the Victorian female hockey squad over a three year period from 1991 - 1993 was
92.5 mm with a range of 68 - 132 mm (Walsh 1996, unpublished research). Twenty
Australian women's hockey members preparing for the 1996 Olympics had a sum of nine
skinfolds of (mean ± SD) 77.1 + 14.6 mm with a range of 51.7 - 106.5 mm. (Lawrence
1996, unpublished research).
2.2.3 Anaerobic Power and Capacity
Anaerobic power tests provide a performance measure of the maximal rate of anaerobic
energy delivery which is important during intermittent sports. State female hockey players
registered a maximum power output of 813.4 W using the Margaria stair climb test which is
higher than those reported for other FITS (Withers and Roberts 1981) (Table 2.4). The
maximum power output for the Victorian Field Hockey squad over three seasons from
1991-1993 measured during a ten second sprint on a front access cycle ergometer was
similar to but higher than the Withers and Roberts (1981) report (Walsh, unpublished
research). Results on the Australian women hockey squad members preparing for the 1996
Olympics had the highest maximum power output from a ten second sprint on a front access
cycle ergometer (Lawrence, unpublished research) (Table 2.4). The higher maximium
power outputs by the National squad can be attributed to different standards of players and
a different type of computer software used by Lawrence to convert amplified high level
pulses from the ergometer to calculated powerpulses on the computer resulting in higher
peak power levels than the software used in this experiment (Lawrence, unpublished
2.2.4 Maximal Oxygen Consumption.
Maximal oxygen consumption provides an index of a player's aerobic fitness which is
important to the energy demands of field hockey. Table 2.2 indicates that the VOj max of
elite female field hockey players has changed very little over the past eighteen years. The
*
VOj max of the Canadian Women's National field hockey team leading up to the 1984
Olympics ranged from a mean of 52.7 ml.kg'^.min'l at the beginning of their preparation to
59.0 ml.kg"^.min"i just prior to the 1984 Olympic games (Ready and van der Merwe 1986).
The mean VO2 max of Western Australian hockey players was 50.1 ml.kg'^.min"! at the end
of an intense training program (Rate and Pyke 1978). The mean VOjmax for the Victorian
field hockey squad over three seasons from 1991-1993 was 51.6 ml.kg'^.min'^ with a range
of 44.3 - 62.4 ml.kg'l.min"^ (Walsh, unpublished research). The Australian women's
hockey team perform a maximal multi stage shuttle run test to predict VO2 Max. The test,
which reportedly has good reliability (Intra class correlation .97) when subjects have good
motivation (Australian Institute of Sport, unpublished data), calculates VO2 from a level and
stage reached during a progressive series of twenty metre shuttle runs to volitional
exhaustion. The Intra class correlation was 0.93 in a report comparing the shuttle run test
with directly measured VO2 max tests with 19-36 year old women (Ramsbottom et al
1988). According to maximal shuttle run test results the twenty Australian women hockey
squad members preparing for the 1996 Olympics had a predicted VO2 max of 53.0 ±3.4
CO u ta c o B
I
"o (4-1 o CO O CO •c vi
x: 13 •5b "o cs csI
•3I
001
,rtt
1
.2^i
CA a o ei
8 C/3 00 CQ 00 oo r~ <s
1
I
0 0 <S <s C/3I
S < S1
OI
JSUi
I
sr
1
s
=3 i n o "3 c p p n ' wo ON i2i
I
I
^«-) *o
S g" CO o Z
I
I
VO 00 00 vqi
— ^ -3 ^ HJ (A
u 60 St a Mult i M i i ^ Ov
sr
•c o •S1
<r> 00I
00 ONI
00 r-ON 73 (A ••3 m 0 0 r-ON 42 vS
«N S '4) ?5^ i I
I
US (AI
^ r-NO ON ONi
I
8 I
- ^ NO
00
8 "
%
2.3 Activity Analysis
2.3.1 Classification of Match Activities.
Intermittent sports are characterised by a variety of movement types and the first stage in
movement analysis is the classification of these activities. The most commonly described
movements during FITS are jogging, walking and standing and the classification of these
terms have a high reliability (Withers et al 1982). Other movements occurring less
frequently during a game include backwards and sideways walking and/or jogging (Withers
et al. 1982, Bangsbo 1991, Lothian and Farrally 1992). Mayhew and Wenger (1985)
combined backwards running, shuffling and jumping under the heading of utility
movements. Different terms used to describe striding movements include cruise (Reilly and
Thomas 1976, Lothian and Farrally 1992), running (Mayhew and Wenger 1985) and
moderate to high intensity running (Bangsbo 1991). Due to the difficulty of distinguishing
between striding and sprinting several authors combined them into terms such as running
(Jacques and Pavia 1974), sprinting (Hahn et al. 1979) and high intensity runs (McKenna et
al. 1987). Reliability was increased when striding and sprinting were classified into a single
category (Withers et al. 1982). In field hockey Lothian and Farrally (1992) included the
high intensity activity (HIA) category of hockey skills which mvolved periods the player
spent with the ball. The justification for this category was that when moving with the ball
the stooping posture required an additional energy cost compared to moving with an
2.3.2 Distance Covered
Most early studies estimated the distance covered during intermittent team sports. Several
authors simply observed the game and used special ground markings or cues to estimate the
distance covered (Pyke and Smith 1975, Reilly and Thomas 1976). Use of ground marldngs
minimised the potential errors involved in measuring by observation and then estimating the
distance however, this would still provide a large margin for error due to parallax error and
an inability to replay the event (Pyke and Smith 1975).
To reduce the errors inherent in this method, more recent investigations have videotaped
the game and counted the number of steps taken in each activity, using a predetermined
stride length to estimate the distance covered (Craig et al. 1981, Withers et al 1982).
However, limitations with this technique include the problems of changing step frequency
and length, as well as the exorbitant amount of time needed to conduct this analysis (Craig
et al 1981, Douge 1982, Jacques and Pavia 1974). Further, it is possible that gait
characteristics may change during the game due to fatigue. Thus, considerable potential
errors remain in distance based activity analyses.
Male soccer players travelled between 8.7 km and 13.2 km per game, v^ath an average of
approximately 11 km during a match (Bangsbo et al 1991; Van Gool et al 1987; Ekblom,
1986; Withers et al 1982; Reilly and Thomas 1976). Differences in playing patterns existed
between the different positions on the field. Mid-fielders cover an overall greater distance
during the game than defenders and attackers and also do more work at a lower intensity
(Reilly and Thomas 1976; Van Gool et al 1987). However a comparison between the
distance covered at various speeds indicated that there was no statistically significant
difference between the fiiUbacks, central defenders, midfield players and forwards in a game
of soccer (Withers et al. 1982). No published data exists on the distance travelled by women
under 8.5 km during a game (Cited in Brewer 1994). Time motion analyses using video
editing equipment linked to a cassette tape recorder found that during a practice game in
positions of the highest workrate two elite women field hockey players travelled similar
distances to Ekblom's reports (6-7 km) whilst two males travelled 8-10 km (Walshl992,
unpublished data).
2.3.3 Time Spent in various movement activities.
A more precise method involves determination of time spent in different activities rather
than the estimation of distance (Green et al. 1976; McKenna et al.l987; Mayhew and
Wenger 1985; Lothian and Farrally 1992). This information can then be used to obtain the
mean and range of durations spent in different activities as well as to calculate work to rest
ratios, which provide a more detailed indication of the intensity of the game (Mayhew and
Wenger 1985; McKenna 1987; Withers 1982). Mayhew and Wenger (1985) reported the
work to rest ratio averaged over the whole game whilst. Withers et al (1982) presented the
frequency that ratios exceeded certain values at any time during the game. Lothian and
Farrally (1992) used the time spent and an estimate of energy cost to calculate energy
expenditure for each movement category. Bangsbo (1991) used the product of mean
velocity and total time spent for each activity pattern to calculate the match distance by the
sum of the distances covered during each type of activity.
Time motion analysis of field hockey shows that 78.0 % of the game is spent in low
intensity activity (LIA) including; standing, walking and jogging whilst 22 % is spent in HIA
including; cruising (or striding), sprinting and hockey skills (Lothian and Farrally 1992).
Unfortunately Lothian and Farrally (1992) did not provide a complete breakdown in
percentages of the individual high intensity and low intensity activities. Some 31% of the
total playing time in soccer was spent in LIA such as standing and walking, 47% was spent
in medium intensity activity such as jogging and 19% was spent in the HIA movement
patterns of striding or sprinting (Withers et al 1982). Similar values were found by Reilly
and Thomas (1976) and Van Gool et al (1987) for soccer players, although high intensity
exercise only accounted for 8% and 11% respectively. Additionally, data collected by Reilly
and Thomas (1976) found that soccer players sprint for approximately 15 meters every 90
seconds. Mayhew and Wenger (1985) claim the ratio of high intensity to low/medium
intensity work in soccer is 1:7 and therefore for every 4 sec of hard/sprint running
approximately 28 s is spent in activities more aerobic in nature. They also combined
distance and time measures. This provided a clearer picture of the range and distance of
intensities, the frequency and distance of the higher intensities and hence, the maximal
workrate achieved by the players during the game. A common characteristic of high
intensity sprint periods for all FITS was the short duration indicated by the range of 1.9
-4.0 seconds (Table 2.4). The periods of high intensity activities only account for a small
percentage of the total game time however, these movements occur during decisive phases
of the match which were directly connected to the scoring potential of the team and often
were the deciding factor in the game (Yamanaka et al. 1988).
With the use of video recordings and computer analysis McKenna et al. (1987) described
the activity patterns of Australian Rules football rovers (on ball running players). Activity
patterns were classified into high intensity (HI) and low intensity (LI). HI activity included
high intensity running comprising sprinting and striding and game related activities such as
tackling, jumping, diving and physical clashes. LI activity included standing, walking and
jogging. The study revealed that the rovers spent 94% of the game time in LI activities.
There was a high intensity run every 73 sec, v^th an average duration of 2.7 sec (max 10.4
sec). It was also reported that 65% of all HI activity lasted less than 4.5 sec, with 80%
VO 4> C 0) Cl. a> H en cs
1
* ^ U3 ••-> o •*s e •c CO IJ T3•c ••-•
CO 00
£
!-.» Wal k inar y u' ^ 4->
CO o o Te n (« 4> '»i t : o CO ca. 00 cs • 00 1 t-^ >v u o X •n "^' VO c^ fl-H 3. 8 VO »n cs cs lia n Rule s Footbal l tr a CO ^ B ^ O N O ''T 4. 5 -^ 00 00 en ^ ON 00 «n -"a-v6 1. 0 m r^ en rf Unio n
-a
00s
o ri m Z^ o 00 C<0 6. 4 •^ en cs »n i-i o o o CO 7-1 0 ^tt 00 00 1 en 00 1 o 1 •«1-NO t*-o en VO t~- t-1t — 1 00 .-^ «yo fo 0. 4 -^ 1—< 00 00 ON
I
•n" oo" 00 ON 13 Q 00 00 ON 13 t> t2 OvCO 2
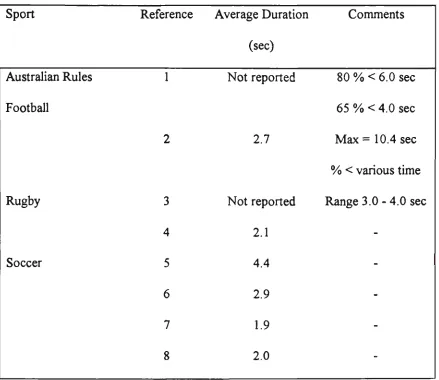
Table 2.4: Average duration of the high intensity (sprint) periods in elite field intermittent
team sports.
Sport
Australian Rules
Football
Rugby
Soccer
Reference
1
2
3
4
5
6
7
8
Average Duration
(sec)
Not reported
2.7
Not reported
2.1
4.4
2.9
1.9
2.0
Comments
80 % < 6.0 sec
65 % < 4.0 sec
Max = 10.4 sec
% < various time
Range 3.0-4.0 sec
-N.B. % refers to the proportion of the total number of sprints
References 1. Hahn et al. (1979), 2. McKenna et al. (1988), 3. Allen (1989), 4. Docherty et al.
(1988) 5. Mayhew and Wenger (1985), 6. Withers et al. (1982), 7. Brodowicz et al. (1990),
2.3.4 Conclusions
The most objective analysis of intermittent sport activity patterns should include a
classification of a range of reliable movement types, the determination of time spent in each
movement activity and calculated work to rest ratios during the game. Analysis of an
intermittent sport should focus on either CITS or FITS as sufficient studies exist for analysis
of either type of sport to focus on making a literature review more specific to the sport.
Comparing CITS and FITS could confiise activity pattern conclusions due to the differences
in the playing area, duration and the work to rest ratios. If sufficient research exists on a
FITS for a particular sex this should be the major focus of the investigation. Very little
published data has investigated field hockey, including only one incomplete analysis of the
2.4 Physiological responses to Elite field Intermittent sports.
2.4.1 Estimation of exercise intensity.
i) Heart rate
Heart rate (HR) responses during intermittent sports can be easily measured with the use of
a micro-computer which is strapped to the wrist or around the waist and will continuously
record and display the average of the previous five seconds. Very little literature exists on
heart rates measured during competition field hockey (Table 2.5). HR monitoring of female
hockey players during a match has shown average HR values of 171 bts.min"' (Lothian and
Farrally 1992) while published data on males reports average HR values of 159 bts.min'*.
(Boyle et al 1992). Heart rates were measured in male state hockey players at the Australian
Men's senior championships in 1988 and during a men's domestic division 1 competition
four state players were monitored in the 1988 and 1989 seasons (Cibich 1991). The right
inner, striker and back liners spent approximately 28 % of their time with HR exceeding 92
% of their maximum HR, 80 % of their total time was spent above 75 % of their maximum
HR. The mean percentage time for the four positions measured (back, centre half, inner and
striker) was 60.5 % of time with HR exceeding 85% of maximum HR (Cibich 1991). These
figures are similar to heart rates reported during soccer matches in which 2/3 of the game
were spent above 85 % of maximum HR (Smodlaka 1978). Soccer players during a game
have shown average HR values of 165-169 (Van Gool et al. 1987) and 160-180 bts.min"\
with occasional peak values over 190 bts.min"' (Ekblom 1986). While Pyke and Smith
(1975) showed Australian rules footballers' game average heart rates appear to increase
according to their position with rovers at 178 bts.min"' and halfback flankers at 160
bts.min"'. Thus despite the vast majority of time spent in low intensity activities HR remains
very high throughout in all of these FITS. This suggests that an average HR is not always a
Table 2.5 Mean heart rate and percentage of maximum heart rate values during field
intermittent team sports.
Sport Hockey Australian Football Rugby Soccer Reference 1 2 3 4 5 6 7 8 9 10 11 12 Competition level English International
South Australian state
league National league -Rugby Union League 1st division 1st division Swedish national Australian National State Belgian University Position — -Rover (n=l)
Half back flank
Rovers Backs -Centre back Forward Full back Mid fielder " Average HR (bts.min"') 159 -171 178 160 164 159 161 165 165 175 165 155 171 155 170
1st half 169
2nd Half 165
HR
(%max#)
65 % of game
>85
60 % of game
>85 -86 -78 74
# % of max heart rate is the percentage of the laboratory derived maximum heart rate.
Authors 1. Boyle et al (1992), 2. Cibich (1991), 3. Lothian and Farrally (1992) 4. Pyke and Smith (1975). 5.
Hahn et al (1979), 6. Morton (1978), 7. Seliger (1968a), 8. Seliger (1968a), 9. Astrand and Rodahl (1977),
ii) Oxygen consumption
Oxygen consumption during continuous sports has been estimated from heart rate based on
the linear relationship between HR and VO2 during submaximal exercise (Malhotra, Gupta
and Rai 1963, Morgan and Bennett 1976). However the linearity between HR and VO2 is
not seen at maximal workloads (Astrand and Rodahl 1977 p.460). Also HR may be
markedly affected by previous exercise, emotion, heat, environmental conditions and the
mode of exercise (Washburn and Montoye 1986; Montgomery 1988). The influence of
emotional factors on HR can be cleariy seen in a study on basketballers (Ramsay et al
1970). During basketball free throws (approximately 40 sec rest) and time outs (1 minute
rest) the HR dropped by approximately 12 bts.min"' and 22 bts.min"' respectively, the
players' HR did not decrease when actually taking the free-throw, indicating that the
emotional and physical involvement of taking a free-throw is such that the HR rate does not
decrease significantly (Ramsay et al 1970) and therefore is unrelated to VOj changes.
Despite these limitations several authors have reported estimated VO2 based on an assumed
relationship between VO2 and HR in field hockey (Skubic and Hodgkins 1967; Boyle et al.
1992; Lothian and Farrally 1992) and soccer (Van Gool et al. 1988; Ali and Farrally 1990).
Lothian and Farrally (1992) also attempted to estimate energy expenditure from activity
patterns by calculating the work performed from data obtained at different speeds on a
treadmill for the LIA and using various formulae to predict and estimate the HIA energy
expenditure. It was decided not to calculate VO2 during this investigation due to i) the
inherent errors in using regression equations involved in calculating VO2 (Tumilty 1993)
and energy expenditure during intermittent games (Van Gool et al. 1988; Ali and Farrally
1990; Lothian and Farrally 1992), ii) the arbritary choice of speeds for the movement
categories during intermittent sports (Lothian and Farrally 1992) and iii) unfounded
workloads and then used for maximal efforts during a game (Lothian and Farrally 1992). In
summary it was decided too many errors and invalid assumptions exist to estimate VO2
2.4.2 Metabolic responses
i) The sources of energy during intermittent team sports
It is important that the activity patterns during FITS are considered to enable an
understanding of the sources of energy during FITS. Common characteristics of FITS were
that the average HIA period lasts for approximately three to four seconds and that on
average they occur every fifteen to thirty seconds. In between the HIA the player recovers
during a LIA period until the nature of the game requires another HIA period. This pattern
will occur sporadically throughout the game in varying HIA to LIA ratios. The intermittent
test protocol used during this study is more intense than an average passage of play during
hockey however, the tests does provide an indication of metabolic responses and
intermittent fitness for FITS.
The test protocols in the literature used to investigate metabolic sources of energy during
intermittent exercise manipulate the time and intensity of the exercise bout and the
intervening recovery period. Due to the nature of FITS outlined earlier this review will
concentrate on exercise bouts less than six seconds in duration and with recovery periods
of less than thirty seconds, since these are more specific to field hockey.
A recent study used muscle biopsies to investigate the sources of energy during 10 sprints
of 6 seconds duration, interspersed with 30 seconds of recovery ((jaitanos et al 1993). The
contribution of creatine phosphate (CP) increased throughout the sprint bouts whilst the
contribution of anaerobic glycolysis decreased. Gaitanos et al. (1993) speculated that this
may be due to an inhibition of glycolysis and glycogenolysis with increasing intramuscular
acidosis resuUing in an increased contribution of CP and aerobic metabolism to the energy
demands. It is interesting that power output declined by 26.6 % from the first to the last
bout which suggests that CP levels were not fiilly restored during the thirty seconds rest.
(Bogdanis et al. 1995). Following this a FITS player involved in several relatively long HIA
periods in succesion may fatigue due to an inadequate period required to restore CP levels.
Blood lactate concentrations may indicate the contribution of glycolysis during intermittent
exercise but it does not provide information on all of the sources of anaerobic energy. As
the time period of the intermittent exercise increases a decrease in blood lactate
concentration may suggest a decrease in the contribution of the anaerobic system when in
fact CP contribution is increasing (Boobis 1987). According to Boobis (1987) during
supramaximal exercise of less than six seconds the majority of energy is supplied by the
simuhaneous breakdown of CP and muscle glycogen.
Inactive periods during intermittent exercise may provide time for the resynthesis of CP and
ATP, the decrease in inorganic phosphate (Harris et al. 1976), ADP and AMP (Essen et al.
1977) and the restoration of resting intramuscular pH levels (Holymard et al.l988; Balsom
et al. 1992a). The energy used to resynthesise CP during these periods is believed to be
supplied predominantly by aerobic pathways (Sahlin et al. 1979). Therefore lengthening the
recovery periods during intermittent exercise may reduce the contribution of glycolysis and
prevent an excessive increase in blood lactate and hydrogen ion concentrations (Saltin et al.
1976; Essen and Kaijser 1978). The accumulation of hydrogen ions in the muscle is believed
to be a major cause of fatigue during high intensity exercise (Metzger and Fitts 1987; Tesch
and Wright 1983). However more recent studies are not as definite about the effect of
hydrogen ions on fatigue.
Shortening the recovery period during intermittent exercise decreases sprint performance
(Balsom et al. 1992a), increases HR (Keul 1973; Balsom et al. 1992a), blood lactate
concentration (Keul 1973; Margaria 1969) and VO2 (Margaria et al. 1969) during
time for the restoration of CP resulting in an increased reliance on glycolysis during
subsequent exercise bouts (Holymard et al. 1988; Saltin et al. 1976; Essen 1978).
It appears that the major sources of energy during the high intensity activity during FITS
will be derived from the intramuscular CP stores and glycolysis whilst, the energy during the
lower intensity activity exercise is likely to be predominantly provided by the aerobic
pathway. During mtense periods of play v^th small rest periods glycolysis may be inhibited
by a fall in intramuscular pH of the muscle during which the CP stores are likely to provide
the majority of energy along with an increasing contribution from the aerobic pathways.
\\) Blood glucose
Muscle glycogen is the major source of carbohydrate during exercise at intensities
exceeding 65 - 70 %, whilst vdth increasing duration of exercise the contribution of muscle
glycogen declines and that of blood glucose increases (Romijn et al. 1993). Blood glucose
concentration is maintained by liver glycogenolysis and gluconeogenesis as well as absorbed
glucose from the dietary intake (Costill and Hargreaves 1992). Glucose is an essential fiiel
for the central nervous system and becomes an increasingly important substrate for
prolonged exercise with carbohydrate supplementation (Coyle et al. 1986). Fatigue during
strenuous exercise is associated with the depletion of glycogen, additionally an increase in
blood glucose occurs when muscle glycogen levels decrease (Costill and Hargreaves 1992).
Hypoglycaemia (low blood glucose concentrations) can have serious effects on performance
and health. Low blood glucose concentrations between 2.8 to 3.9 mmol.l' can cause
nervousness and trembling, whilst levels below 2.8 mmol.l"' can cause a person to lose
consciousness (Guyton 1981). It has been proposed that low blood glucose concentrations
may have a deleterious eflfect on tactical thought as well as cooperative action between
In a study of Canadian National soccer players Leatt (1986) reported a pre game blood
glucose concentration of 4.96 mmoLl'*, which was increased by half time to 5.67 mmol.l''
and decreased to less than rest at 4.74 mmol.l'' at the end of the game. In contrast to an
increase in blood glucose levels, a study by Ekblom (1986) found that the average glucose
concentration at the end of a soccer game had fallen to 3.8 mmol.l'' with three players
having readings of only 3.0 - 3.2 mmol.l''. With no pre game glucose concentrations
reported by Ekblom (1986) it is difficult to assess the condition of the players before the
game however, the lower than rest blood glucose concentrations at the end of the game may
be explained by low pre game liver glycogen levels.
Provided the pre exercise liver glycogen reserves are adequate and the glucose precursors
are available, the intense nature of soccer will normally result in blood glucose levels close
to or slightly above resting levels during a match (Reynolds and Ekblom 1985a; Shepherd
and Leatt 1987; Leatt and Jacobs 1989). Due to the restrictions of fluid replacement during
soccer and field hockey it is difficult to supplement with glucose polymer drinks during the
match. The only occasions available appear to be immediately before the game during injury
time or at half time. There have been no published reports of blood glucose concentrations
for a game of field hockey,
iii) Lactate
Muscle lactate increases when the rate of glycolysis exceeds the rate of pyruvate entering
the tri Krebs citric acid cycle (Powers and Howley 1990). Several authors have taken
muscle biopsies before, following and during soccer matches (Agnevik 1970; Jacobs et al
1982; Ekblom 1986); however, no study has reported more than pre and post muscle
biopsies. Obtaining muhiple muscle biopsies during field testing in ITS is largely impractical
due to the availability and access of elite players as well as the potential adverse effects.
Body contact also raises the risk of excessive bleeding and spread of infection compared to
laboratory studies. Therefore blood sampling and measurement of blood lactate
concentration is the preferred method for measuring the glycolytic contribution to FITS.
Mean venous blood lactate concentrations from studies reporting only pre and post game
samples ranged between 4.9 and 9.5 mmol.l'' at half time to 2.8 - 7.2 mmol.l'' at the end of
the match with most investigations reporting a lower blood lactate concentration at the end
of the game (Table 2.6). Between four (Table 2.6) and ten capillary blood samples (Ekblom
1986) have been taken during a match to obtain a clearer picture of blood lactate
concentrations during soccer and rugby games (Ekblom 1986, Bangsbo 1991, Bangsbo
1994, McClean 1991).
Despite the increasing use of blood lactate concentration measurements to estimate the
anaerobic contribution to the energy demands of intermittent sports, there are a number of
problems with their use. These blood samples have usually been taken after a half or quarter
has been completed. Blood lactate concentration represents a balance between lactate
production and subsequent entry into the bloodstream and it's clearance and each of these
are dependent on the exercise intensity and work to rest ratio of the activity (Brooks 1986
Anderson and Rhodes 1989). However blood lactate concentration was related to the
percentage of high intensity running during the five minutes prior to blood sampling
(Bangsbo 1991). Therefore it could be suggested that blood lactate concentrations give a
crude indication of the anaerobic contribution to the energy demands of play during this five
minute period. (Bangsbo 1991). It should be emphasised that post game or average game
lactate concentrations give no indication of the range of individual player concentrations
produced during the game (Table 2.6) or of the degree of lactate production and clearance
from the blood during heavy and light work loads. The effects of FITS on blood lactate
o •c 3 73 CO C4-I 13 Xi •o c cs (4-1 13 x:
i
t: o 0. CO o O N I O ens
ON Ov 13 § COI
Q CO COi
« VO +1 00 13 Xi o o 00 00 O N Q Xi 00 COI
« fS + 1 00 en 00 O N I NO CO o NOi
VO NO 00 o I O N VO' 00 en 0 0 0 -^ 0 NO 1 VO - H cn ON 1 en «sin — -H
L" (3 •^ 9" c4 CO S 0 C u > CO 3 0 e 4> > M 3 Q a u
>
I
o
en
VO
^ ^
§- §• ^
u u u
*
CO
o -^ +1
(S NO
VO cs'
O N
en
en cs o • > * '
VO >o * ON — 4. 9
+ «o Ov
0
0 0 '^. f S
ON
CO
Ov NO
NO , 0 3 u ona l c4 Z ona l eJ 2 ona l C4 Z di v •«-> CA "^ di v • 0 s CS di v •4-> CA "^ di v ^ e CM 1& 2 > Q as 00 O N g Ov O N U U o ON
I
U 4> O o o CO NO 00 ON B o1
ON as
Ov ON o Xi CA op CQ o Xi CA op OQ C O C o I-I u c o u o . -s
CO ^
+ |T3 e o
CO 2
CO T3
^ ^ CO ^ Q f2
iv) Potassium
Muscle K* plays an important role in muscle fiinction with disturbances in the
intracellular-to-extracellular muscle K^ concentration gradient regulation linked with reduced membrane
potential and excitability (Sjogaard 1991; McKenna 1992; McKenna et al 1996). A
decrease of this gradient has been reported during both intense and prolonged exercise
(Sj0gaard 1991). During intense exercise plasma K^ concentration increases rapidly due to
release from contracting muscle. However in recovery, unlike lactate concentration, plasma
K* falls rapidly to below resting levels by approximately three minutes post exercise, due to
rapid re-uptake by the muscle (Medb0 and Sejersted 1990). This probably accounts for the
10 % decrease in plasma K"^ concentration of 23 Australian rules footballers at the end of
the game (Pohl et al 1981). There are no other reports on muscle or plasma K*
concentrations during other FITS.
v) Fluid regulation
During exercise heat is produced due to inefficient energy transduction processes which
may elevate core temperature. Regulations governing hockey, soccer, and ice hockey do not
allow trainers onto the ground during play to supply the team with fluids, the only
opportunities for hydration are at half time or when an injury break occurs. The rise in core
temperature during these FITS is dependent on the intensity and duration of the exercise
bouts, recovery periods, environmental factors such as temperature, relative humidity and
player clothing, sweat loss and fluid intake (Maughan and Leiper 1994). It has been
reported that intermittent sports raise the core body temperature higher than continuous
sports at the same oxygen consumption (Ekblom et al 1981). The extent of this increase is
not only affected by the prevailing environmental conditions but also by the standard of the
game. Most studies examining fluid regulation on FITS have examined soccer players
1993). At the completion of the game first division soccer teams had a higher rectal
temperature (39.5° C ) when compared with teams from three lower divisions (39.0-39.2"
C) (Ekblom et al. 1981).
Very high increases in core temperature occur in the warmer weather (Mustafa and
Mahoumad 1979). A major criticism of these papers investigating the effects of intermittent
sport on core temperature is the lack of information on environmental conditions at the
time. Despite this a study involving Afiican soccer players in "warm conditions" found
losses of 4-5 kg representing 3% of the subject's body mass (Mustafa and Mahoumad
1979). A decrease of more than 2% in body mass can impair both the performance of an
athlete and increase core temperature during exercise (Costill et al.l970). Mustafa and
Mahoumad (1979) report that a major reason for the decrease in body mass was inadequate
fluid replacement during the half time break. Shepherd and Leatt (1987) found that
dehydration adversely affected the player when between one and two kilograms were lost.
Given a player can absorb a Htre or more of fluid during a game dehydration is only a
concern during warmer conditions ie above 21° C (Shepherd and Leatt 1987). However a
study by Pohl et al (1981) investigating fluid loss and rectal temperature in Australian rules
footballers with the temperature at 12-15° C and humidity of 55 - 88% suggests that
temperatures below 21° C can also cause significant hypohydration. During this match
players drank freely from a 2.5 % solution of glucose in distilled water. By the end of the
game the mean fluid deficit was 2 % of the players' body mass while rectal temperatures
had increased to 39.5 °C. An increase of more than 2°C in core temperature can cause
significant impairment of mental and physical fiinction (Guyton 1981; Gopinathan et al.
1988). Therefore air temperature, humidity and the hydration of the athlete all affect both
the core temperature and body mass loss of athletes. As a result of these responses
performance can be adversely effected and in extreme cases, compromise the health of the
athlete. No published data exists on fluid loss during FITS involving women or during a
2.4.3 Conclusions
It appears that the major sources of energy during the HIA periods m FITS will be derived
from the intramuscular CP stores and anaerobic glycolysis whilst the energy during the LIA
periods is likely to be predominantly provided by the aerobic pathway. During intense
periods of play with shorter rest periods (between 30-60 sees) anaerobic glycolysis may be
inhibited by a fall in pH of the muscle during which the CP stores are likely to provide the
majority of energy. It is reported that during these very intense periods of play in FITS the
aerobic contribution increases.
Heartrate (HR) is the only continuous variable that can be easily measured during FITS
without impeding the players' normal game. The continuous monitoring of HR shows that
despite the vast majority of time spent in LIA heart rate remains very high throughout in all
FITS, therefore HR is not always a true indicator of the intensity of the game. It appears
that the calculation of V02from HR or activity patterns is more unreliable than heart rate as
a measure of exercise intensity during FITS. Unlike HR and discrete biochemical
concentrations measured directly from blood samples, VO2 is calculated indirectly using
unreliable regression equations from HR or the activity patterns. Therfore it may be
«
suggested that a physiological response (VO2) calculated using unreliable regression
equations from another physiological response (HR) which is already not always a true
indicator of the intensity of the game contains too many errors and invalid assumptions for a
calculated VO2 to be reported as a reliable measure of intensity during FITS. Lactate,
glucose and potassium concentrations exhibited during competition and the suggested
implications for training have been made on the basis of discrete or average values.
Individual lactate concentrations vary a great deal in FITS, this could be due to the sporadic
nature of the activity patterns and of different playing positions. Therefore, conclusions
regarding average values obtained from a number of different sample times cannot be very


![Figure 5). Plasma [glucose] was elevated at half-time and at the end of the match compared to](https://thumb-us.123doks.com/thumbv2/123dok_us/8012885.1332198/73.591.45.523.511.610/figure-plasma-glucose-elevated-half-time-match-compared.webp)